| Param | Original file | Final file |
|---|---|---|
| Filename | modeM0/AS1T03_275T01_9000004180_29093cztM0_level2.evt | modeM0/AS1T03_275T01_9000004180_29093cztM0_level2_quad_clean.evt |
| Size (bytes) | 577,549,440 | 82,984,320 |
| Size | 550.8 MB | 79.1 MB |
| Events in quadrant A | 3,573,284 | 537,704 |
| Events in quadrant B | 3,758,789 | 543,429 |
| Events in quadrant C | 4,165,605 | 499,391 |
| Events in quadrant D | 5,556,196 | 481,491 |
| Mode M9 | |||
|---|---|---|---|
| Quadrant | BADHDUFLAG | Total packets | Discarded packets |
| A | 0 | 12 | 0 |
| B | 0 | 12 | 0 |
| C | 0 | 12 | 0 |
| D | 0 | 12 | 0 |
| Mode M0 | |||
|---|---|---|---|
| Quadrant | BADHDUFLAG | Total packets | Discarded packets |
| A | 0 | 14753 | 2 |
| B | 0 | 15253 | 2 |
| C | 0 | 16934 | 2 |
| D | 0 | 21020 | 2 |
| Mode SS | |||
|---|---|---|---|
| Quadrant | BADHDUFLAG | Total packets | Discarded packets |
| A | 0 | 132 | 0 |
| B | 0 | 132 | 0 |
| C | 0 | 132 | 0 |
| D | 0 | 132 | 0 |
| Quadrant | Total seconds | Saturated seconds | Saturation percentage |
|---|---|---|---|
| A | 6458 | 72 | 1.114896% |
| B | 6458 | 118 | 1.827191% |
| C | 6459 | 121 | 1.873355% |
| D | 6459 | 399 | 6.177427% |
Noise dominated data is calculated using 1-second bins in cleaned event files. If a bin has >2000 counts, and if more than 50% of those come from <1% of pixels, then it is considered to be noise-dominated and hence unusable.
| Quadrant | # 1 sec bins | Bins with >0 counts | Bins with >2000 counts | High rate bins dominated by noise | Noise dominated (total time) | Noise dominated (detector-on time) | Marked lightcurve |
|---|---|---|---|---|---|---|---|
| A | 7728 | 6459 | 0 | 0 | 0.00% | 0.00% | 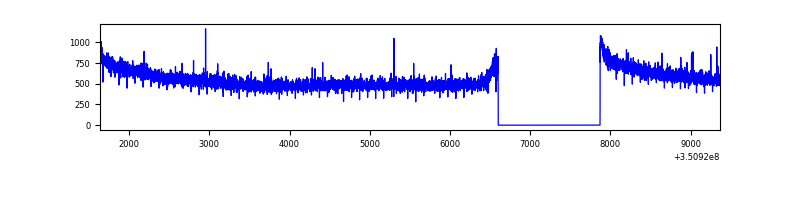 |
| B | 7728 | 6459 | 33 | 33 | 0.43% | 0.51% | 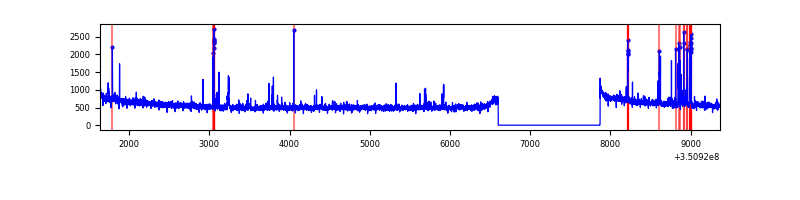 |
| C | 7729 | 6460 | 8 | 8 | 0.10% | 0.12% | 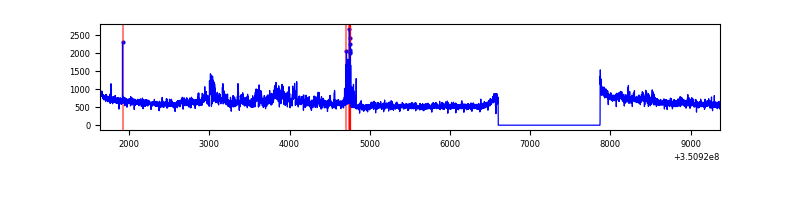 |
| D | 7729 | 6460 | 330 | 330 | 4.27% | 5.11% | 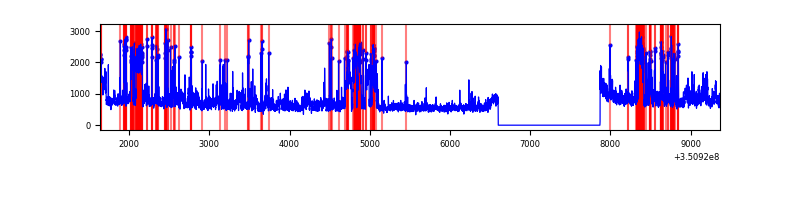 |
Top three noisy pixels from each quadrant. If the there are fewer than three noisy pixels in the level2.evt file, extra rows are filled as -1
| Pixel properties | Quadrant properties | ||||||
|---|---|---|---|---|---|---|---|
| Quadrant | DetID | PixID | Counts | Sigma | Mean | Median | Sigma |
| A | 13 | 254 | 12371 | 63.38 | 924 | 910 | 180.8 |
| A | 0 | 226 | 7990 | 39.15 | 924 | 910 | 180.8 |
| A | 3 | 137 | 7579 | 36.88 | 924 | 910 | 180.8 |
| B | 5 | 255 | 120290 | 713.39 | 910 | 894 | 167.4 |
| B | 5 | 172 | 32415 | 188.34 | 910 | 894 | 167.4 |
| B | 12 | 111 | 18662 | 106.16 | 910 | 894 | 167.4 |
| C | 3 | 233 | 624789 | 3180.36 | 854 | 862 | 196.2 |
| C | 14 | 238 | 142024 | 719.55 | 854 | 862 | 196.2 |
| C | 2 | 16 | 46843 | 234.38 | 854 | 862 | 196.2 |
| D | 8 | 195 | 1224959 | 6126.47 | 859 | 841 | 199.8 |
| D | 1 | 52 | 638389 | 3190.8 | 859 | 841 | 199.8 |
| D | 12 | 233 | 325692 | 1625.82 | 859 | 841 | 199.8 |
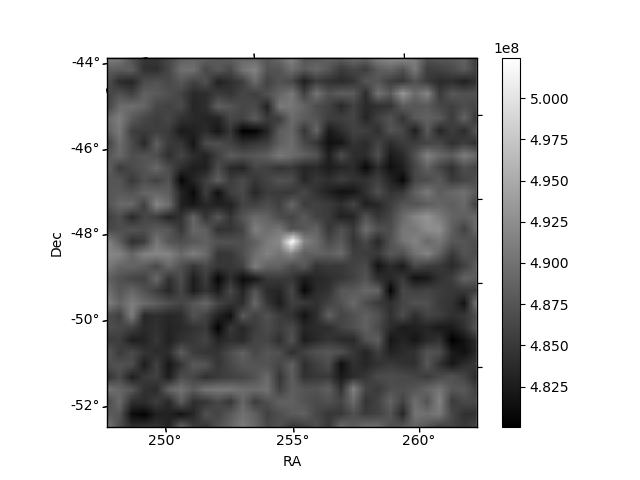
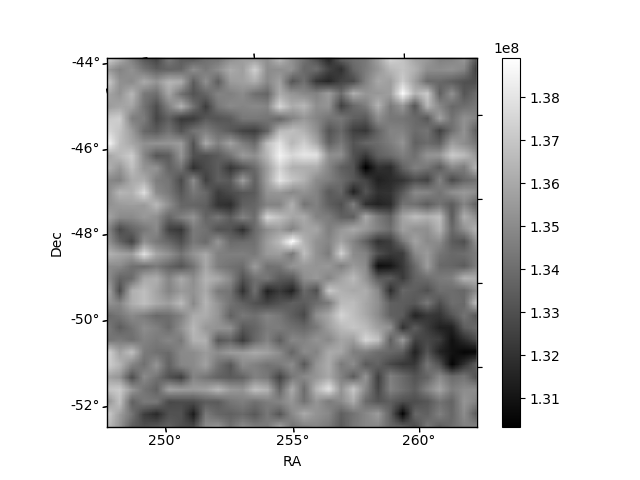
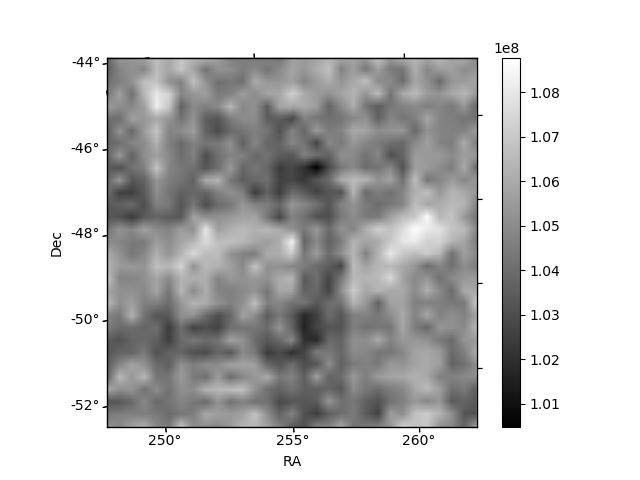
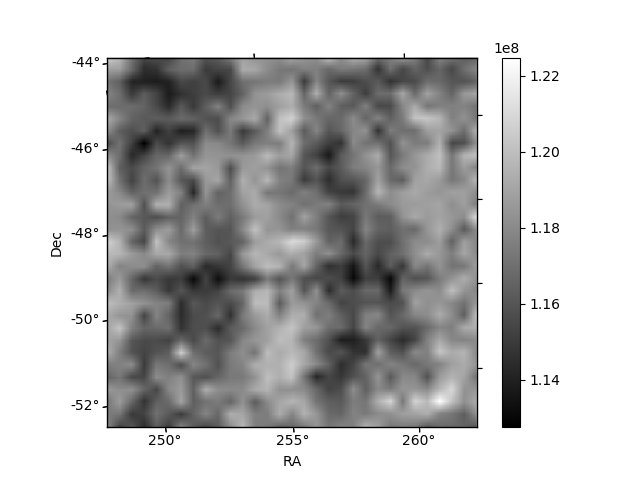
Histogram calculated using DETX and DETY for each event in the final _common_clean file
| Quadrant A | 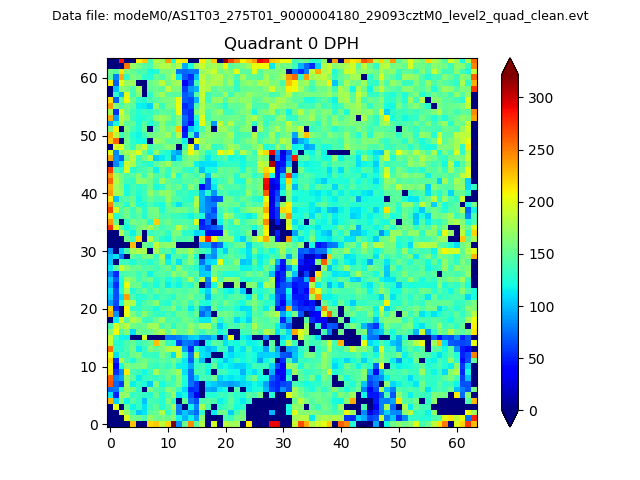 |
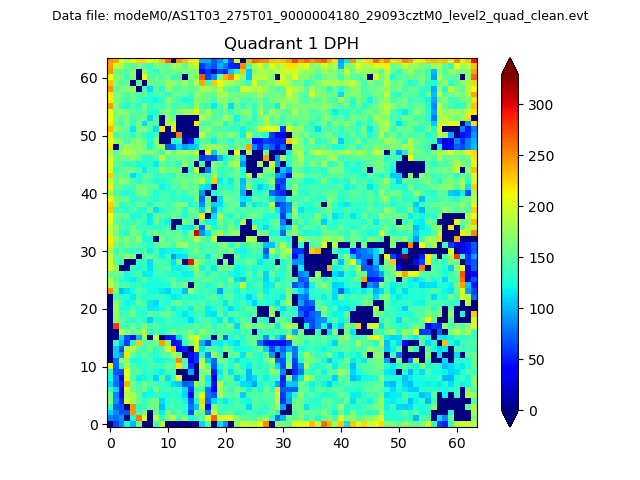 |
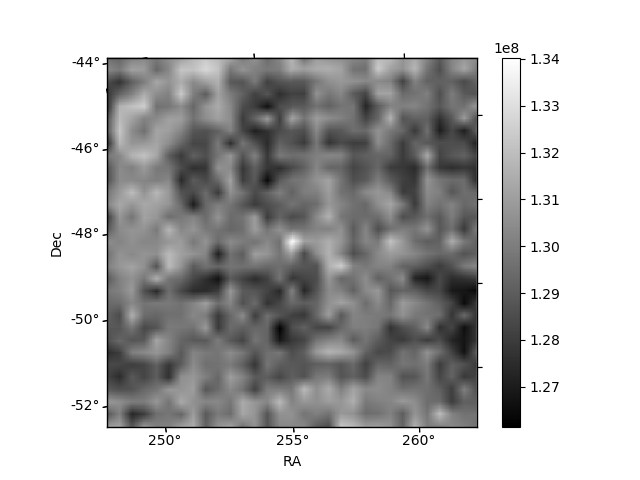
Quadrant B |
|---|---|---|---|
| Quadrant D |  |
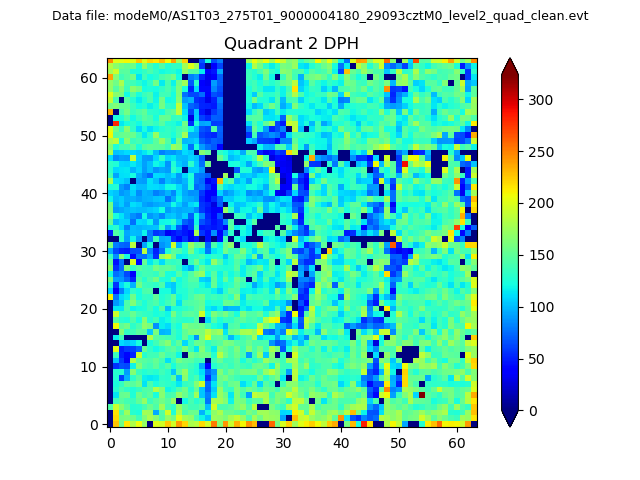 |
Quadrant C |
| Plot type | Count rate plots | Images |
|---|---|---|
| Comparison with Poisson distribution Blue bars denote a histogram of data divided into 1 sec bins. Red curve is a Poisson curve with rate = median count rate of data. |
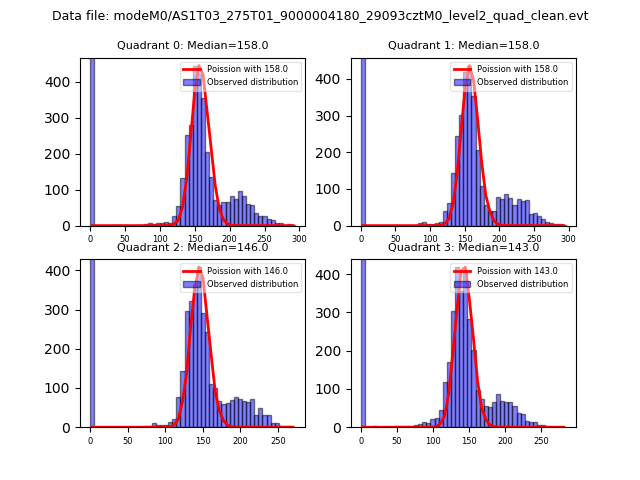 |
 |
| Quadrant-wise count rates Data is divided into 100 sec bins |
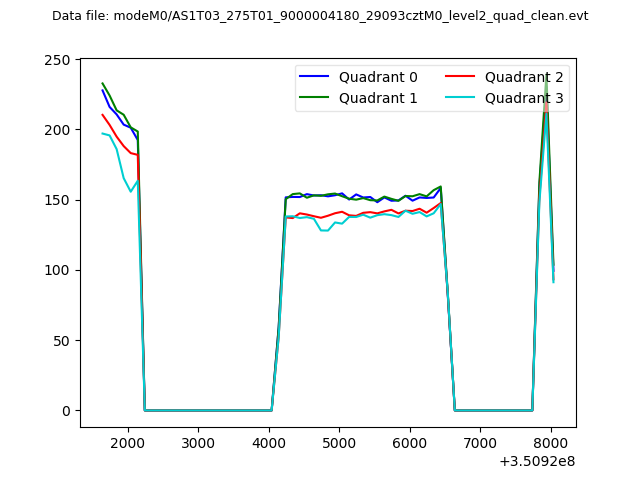 |
|
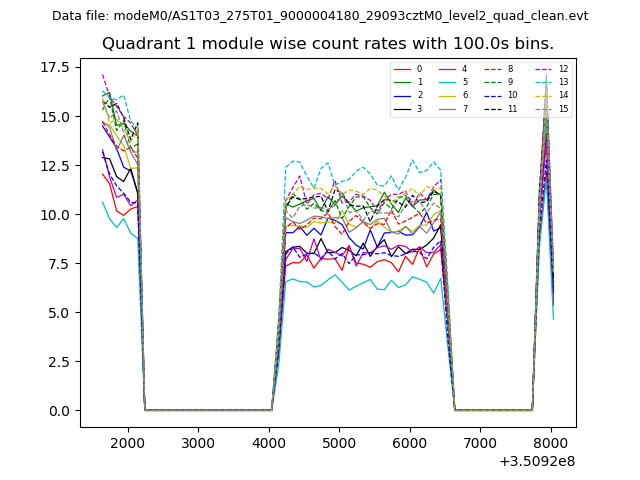
| Module-wise count rates for Quadrant A Data is divided into 100 sec bins |
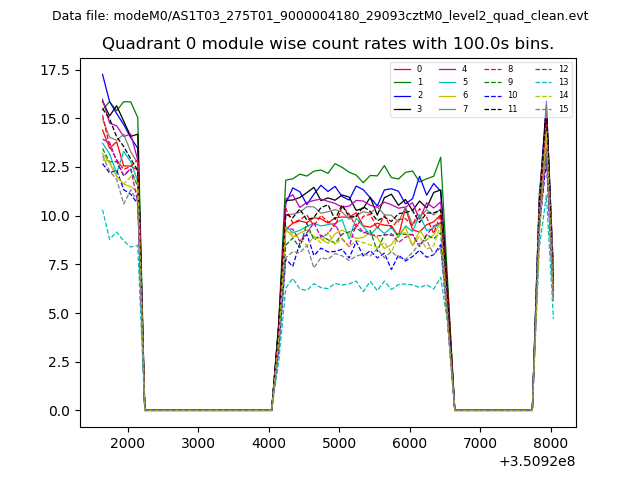 |
 |
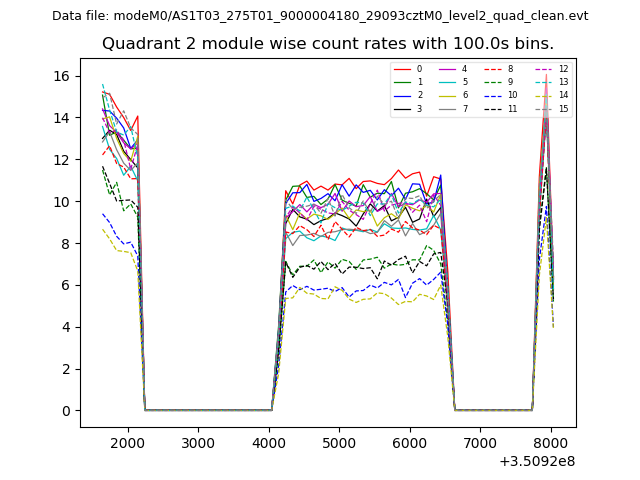
| Module-wise count rates for Quadrant B Data is divided into 100 sec bins |
 |
 |
| Module-wise count rates for Quadrant C Data is divided into 100 sec bins |
 |
 |
| Module-wise count rates for Quadrant D Data is divided into 100 sec bins |
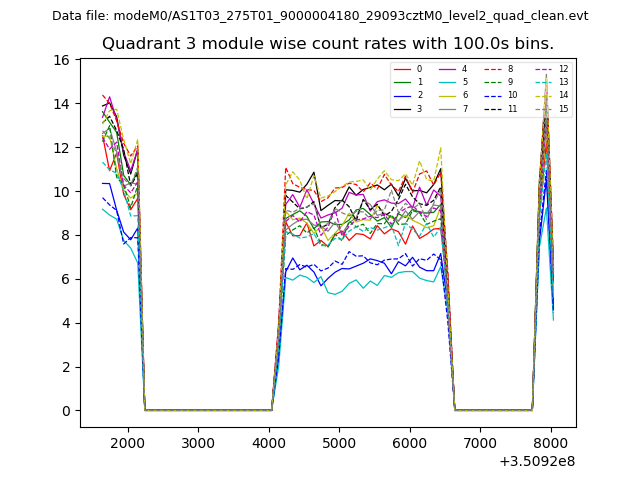 |
 |
| Parameter | Plot |
|---|---|
| CZT HV Monitor | 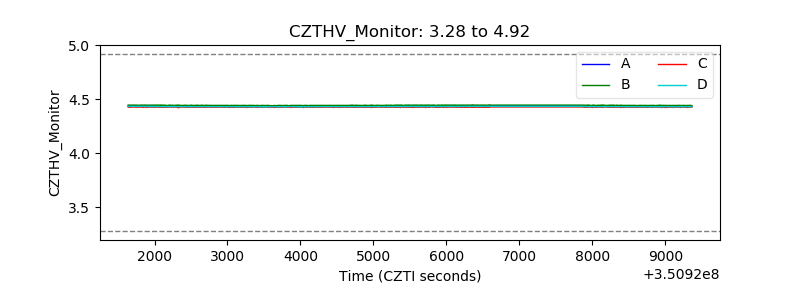 |
| D_VDD | 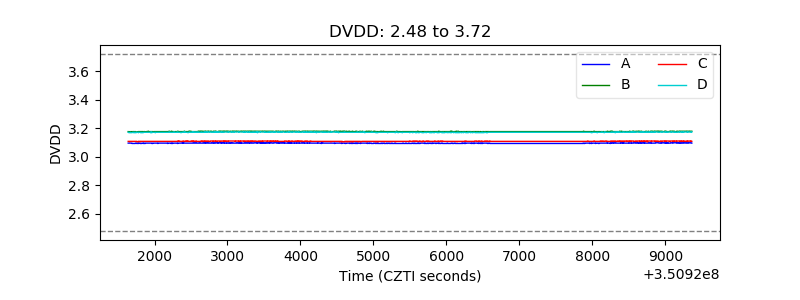 |
| Temperature 1 | 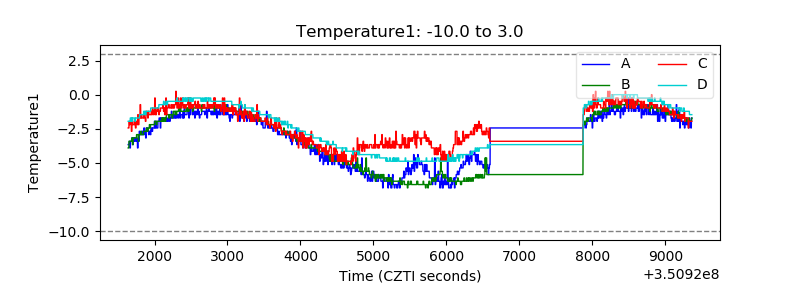 |
| Veto HV Monitor |  |
| Veto LLD | 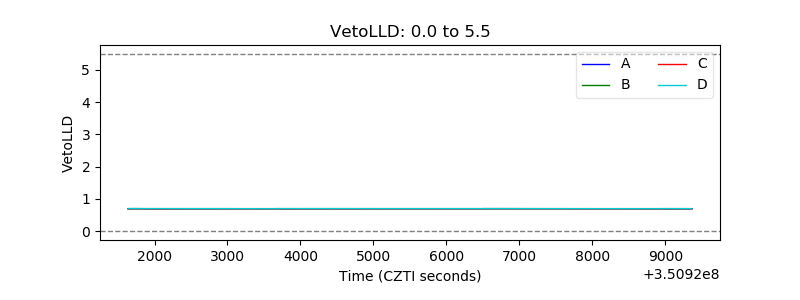 |
| Alpha Counter | 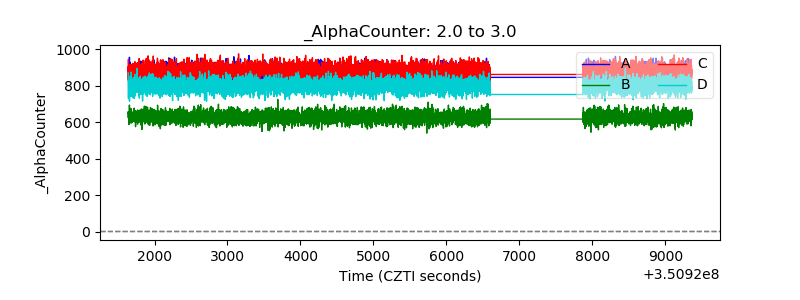 |
| _CPM_Rate | 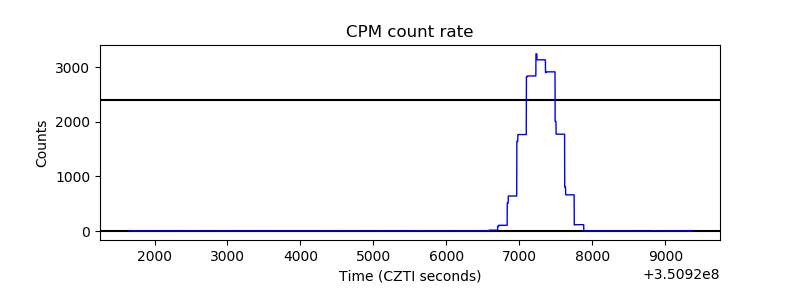 |
| CZT Counter |  |
| +2.5 Volts monitor | 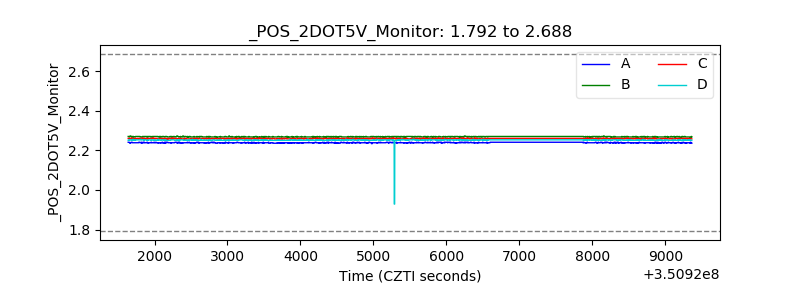 |
| +5 Volts monitor |  |
| _ROLL_ROT | 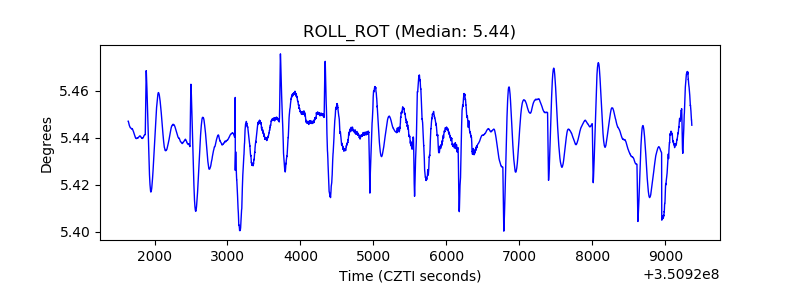 |
| _Roll_DEC | 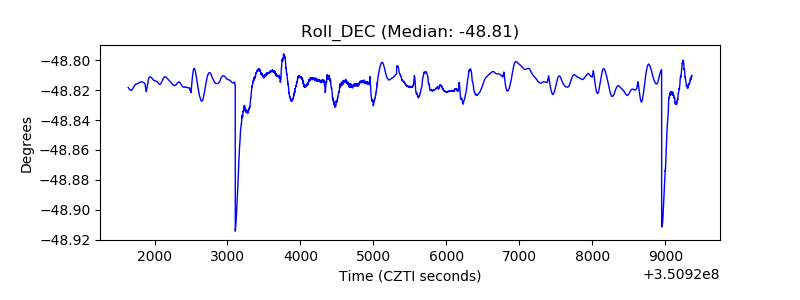 |
| _Roll_RA | 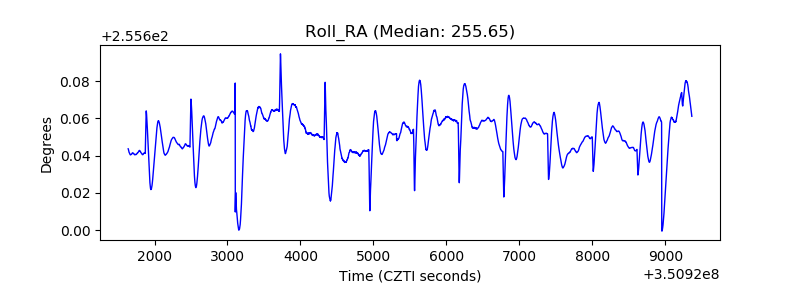 |
| Veto Counter | 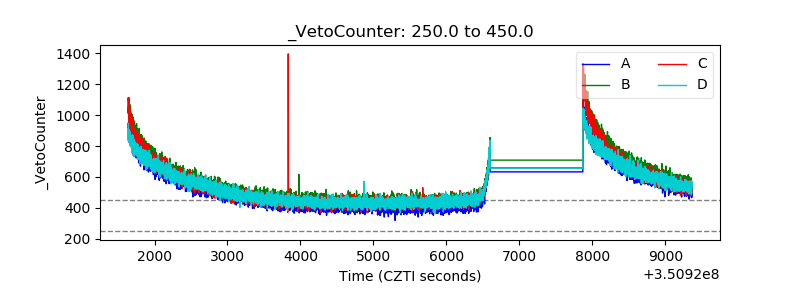 |