| Param | Original file | Final file |
|---|---|---|
| Filename | modeM0/AS1T03_275T01_9000004180_29094cztM0_level2.evt | modeM0/AS1T03_275T01_9000004180_29094cztM0_level2_quad_clean.evt |
| Size (bytes) | 504,408,960 | 68,613,120 |
| Size | 481.0 MB | 65.4 MB |
| Events in quadrant A | 3,185,976 | 436,755 |
| Events in quadrant B | 3,496,188 | 438,624 |
| Events in quadrant C | 3,466,717 | 406,026 |
| Events in quadrant D | 4,740,784 | 397,422 |
| Mode M9 | |||
|---|---|---|---|
| Quadrant | BADHDUFLAG | Total packets | Discarded packets |
| A | 0 | 13 | 0 |
| B | 0 | 13 | 0 |
| C | 0 | 13 | 0 |
| D | 0 | 13 | 0 |
| Mode M0 | |||
|---|---|---|---|
| Quadrant | BADHDUFLAG | Total packets | Discarded packets |
| A | 0 | 13004 | 2 |
| B | 0 | 13985 | 1 |
| C | 0 | 14021 | 1 |
| D | 0 | 18112 | 1 |
| Mode SS | |||
|---|---|---|---|
| Quadrant | BADHDUFLAG | Total packets | Discarded packets |
| A | 0 | 116 | 0 |
| B | 0 | 116 | 0 |
| C | 0 | 116 | 0 |
| D | 0 | 116 | 0 |
| Quadrant | Total seconds | Saturated seconds | Saturation percentage |
|---|---|---|---|
| A | 5702 | 100 | 1.753771% |
| B | 5703 | 194 | 3.401718% |
| C | 5703 | 154 | 2.700333% |
| D | 5703 | 301 | 5.277924% |
Noise dominated data is calculated using 1-second bins in cleaned event files. If a bin has >2000 counts, and if more than 50% of those come from <1% of pixels, then it is considered to be noise-dominated and hence unusable.
| Quadrant | # 1 sec bins | Bins with >0 counts | Bins with >2000 counts | High rate bins dominated by noise | Noise dominated (total time) | Noise dominated (detector-on time) | Marked lightcurve |
|---|---|---|---|---|---|---|---|
| A | 7027 | 5703 | 0 | 0 | 0.00% | 0.00% | 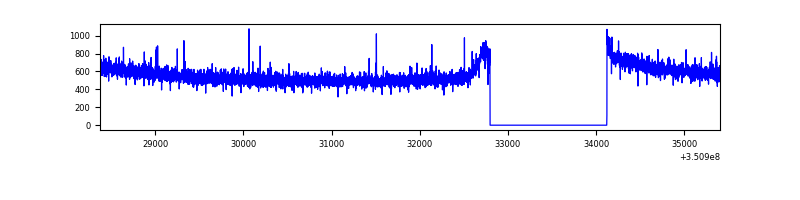 |
| B | 7028 | 5704 | 59 | 59 | 0.84% | 1.03% | 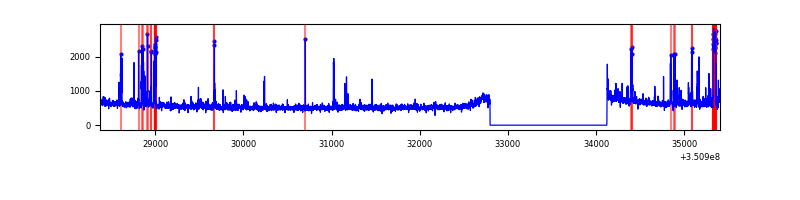 |
| C | 7028 | 5704 | 3 | 3 | 0.04% | 0.05% | 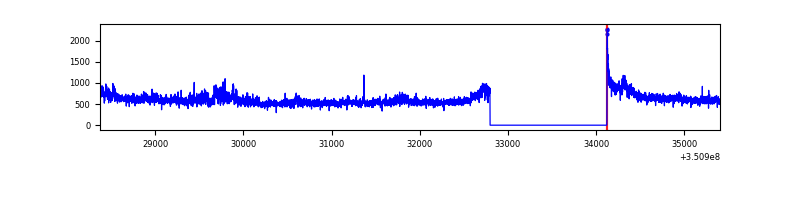 |
| D | 7028 | 5704 | 204 | 204 | 2.90% | 3.58% | 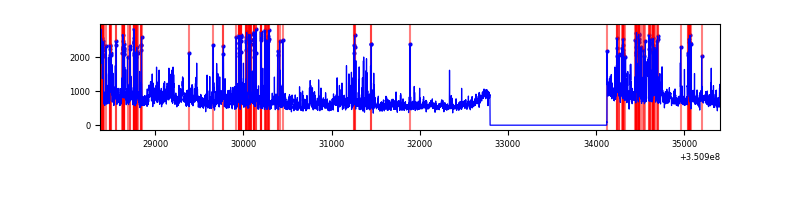 |
Top three noisy pixels from each quadrant. If the there are fewer than three noisy pixels in the level2.evt file, extra rows are filled as -1
| Pixel properties | Quadrant properties | ||||||
|---|---|---|---|---|---|---|---|
| Quadrant | DetID | PixID | Counts | Sigma | Mean | Median | Sigma |
| A | 13 | 254 | 10627 | 60.78 | 822 | 809 | 161.5 |
| A | 6 | 16 | 9350 | 52.87 | 822 | 809 | 161.5 |
| A | 9 | 130 | 7511 | 41.49 | 822 | 809 | 161.5 |
| B | 5 | 172 | 166530 | 1123.07 | 807 | 792 | 147.6 |
| B | 5 | 255 | 102663 | 690.3 | 807 | 792 | 147.6 |
| B | 10 | 246 | 29244 | 192.8 | 807 | 792 | 147.6 |
| C | 3 | 233 | 350883 | 2016.48 | 761 | 770 | 173.6 |
| C | 14 | 238 | 128102 | 733.37 | 761 | 770 | 173.6 |
| C | 2 | 114 | 14135 | 76.98 | 761 | 770 | 173.6 |
| D | 8 | 195 | 846225 | 4709.75 | 764 | 747 | 179.5 |
| D | 1 | 52 | 469055 | 2608.72 | 764 | 747 | 179.5 |
| D | 12 | 233 | 327119 | 1818.06 | 764 | 747 | 179.5 |
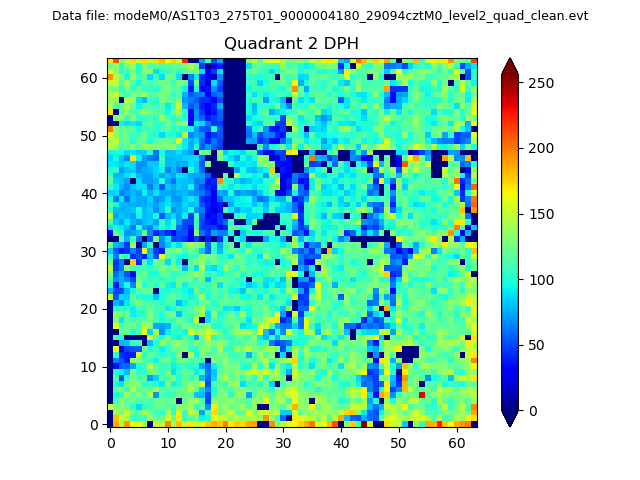
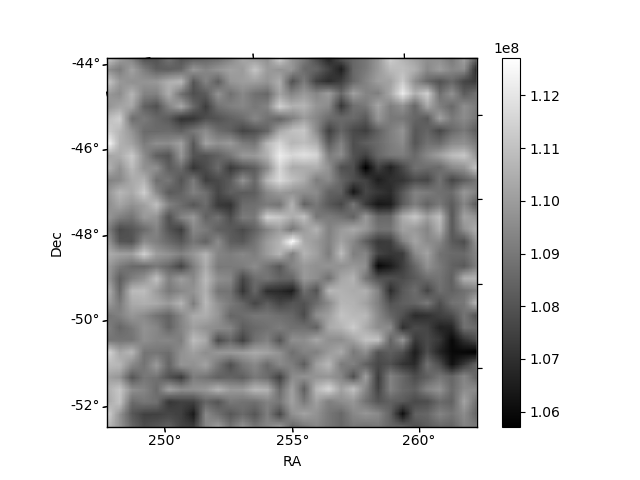
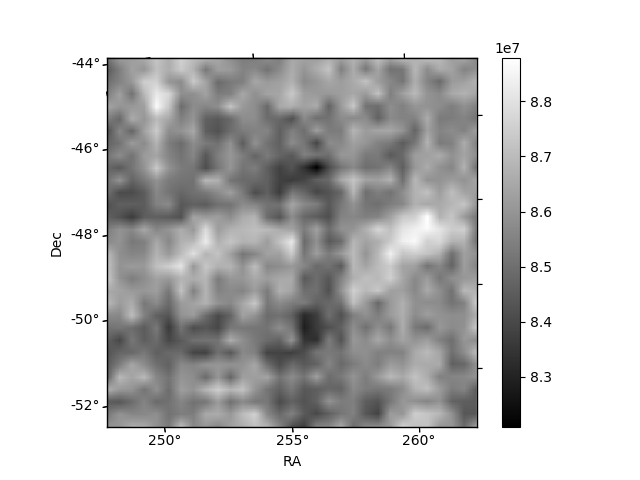
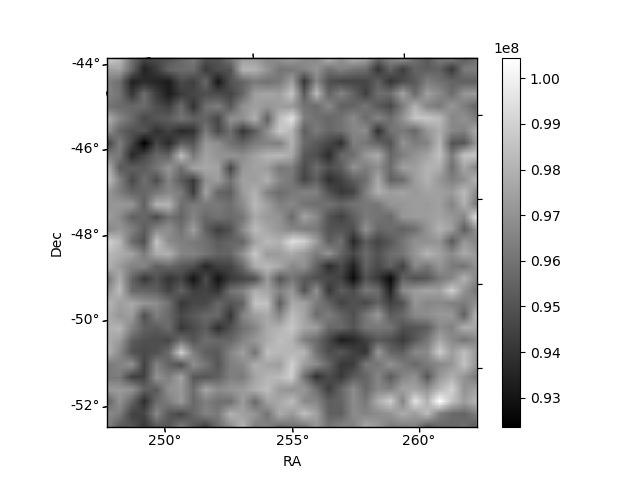
Histogram calculated using DETX and DETY for each event in the final _common_clean file
| Quadrant A | 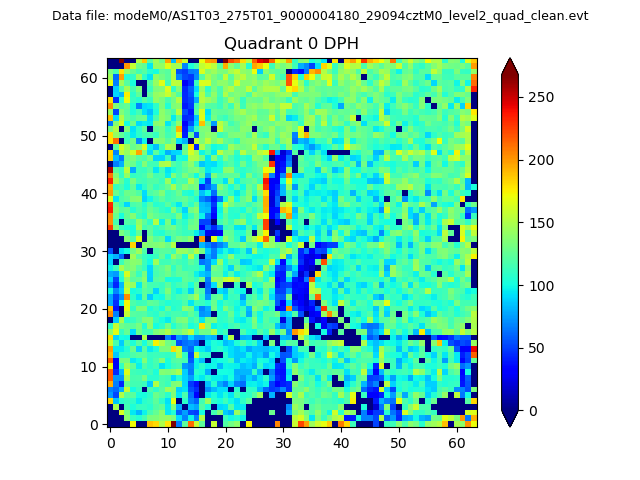 |
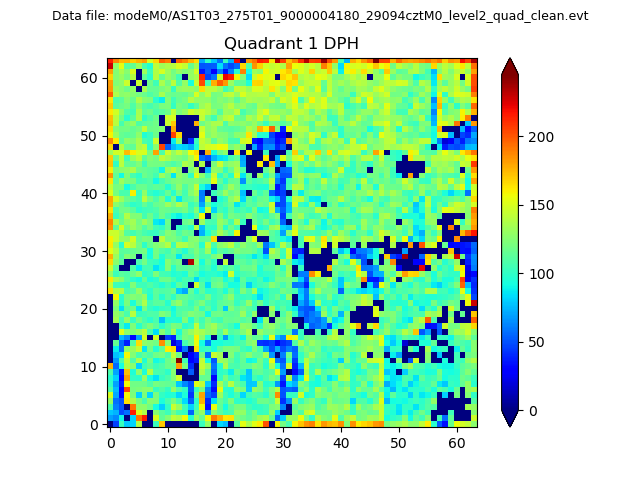 |
Quadrant B |
|---|---|---|---|
| Quadrant D | 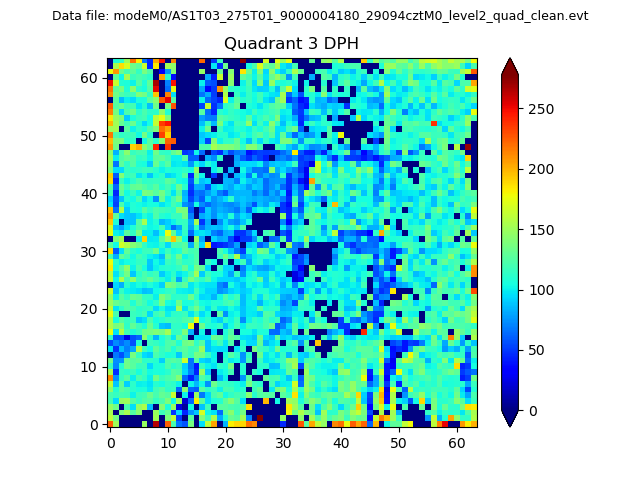 |
 |
Quadrant C |
| Plot type | Count rate plots | Images |
|---|---|---|
| Comparison with Poisson distribution Blue bars denote a histogram of data divided into 1 sec bins. Red curve is a Poisson curve with rate = median count rate of data. |
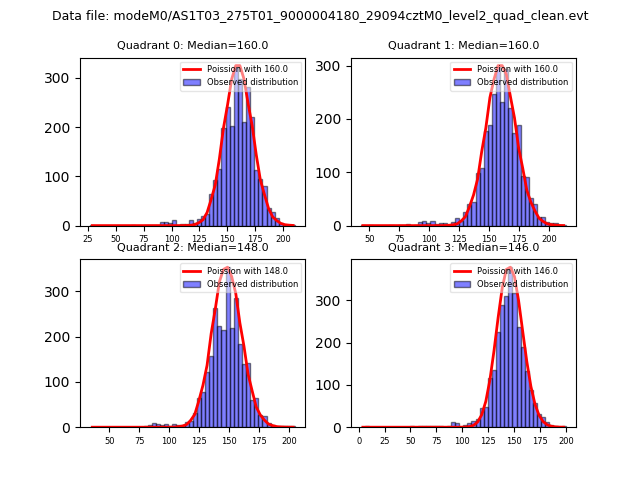 |
 |
| Quadrant-wise count rates Data is divided into 100 sec bins |
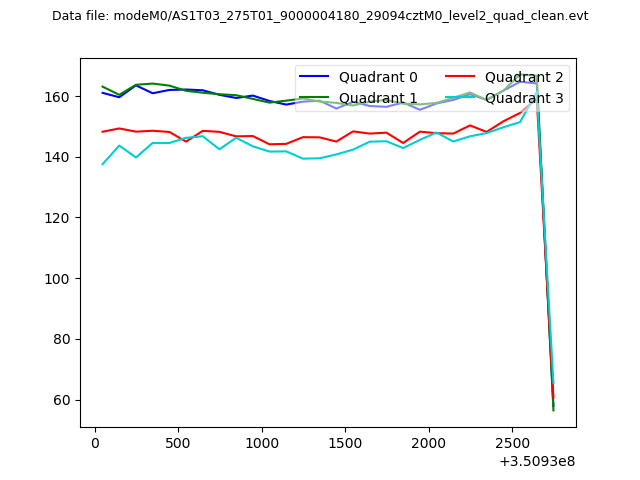 |
|
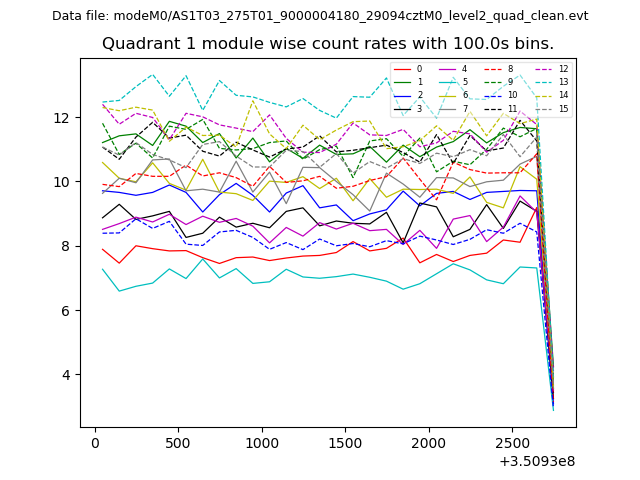
| Module-wise count rates for Quadrant A Data is divided into 100 sec bins |
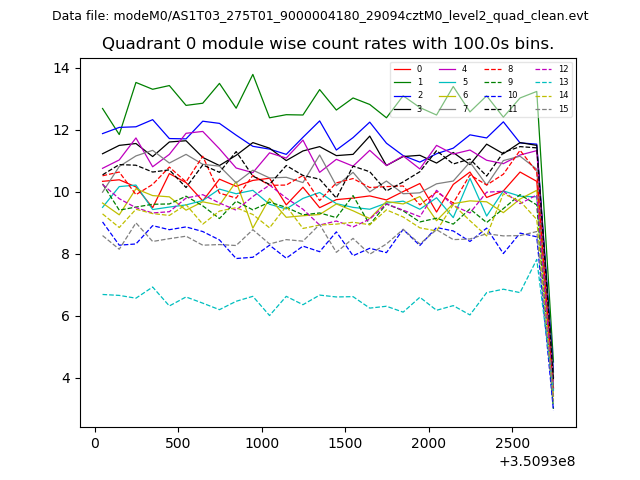 |
 |
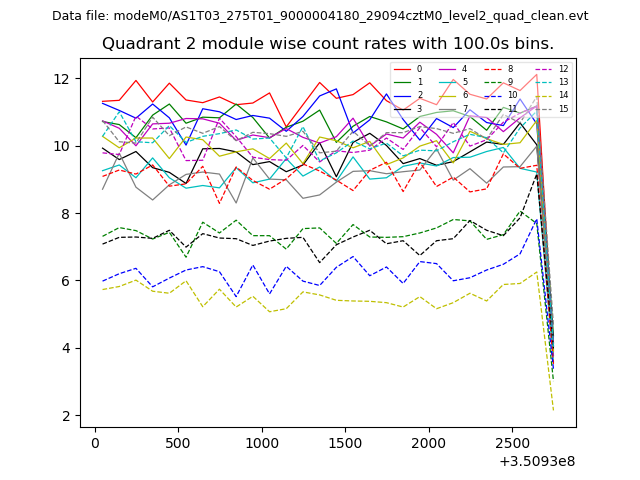
| Module-wise count rates for Quadrant B Data is divided into 100 sec bins |
 |
 |
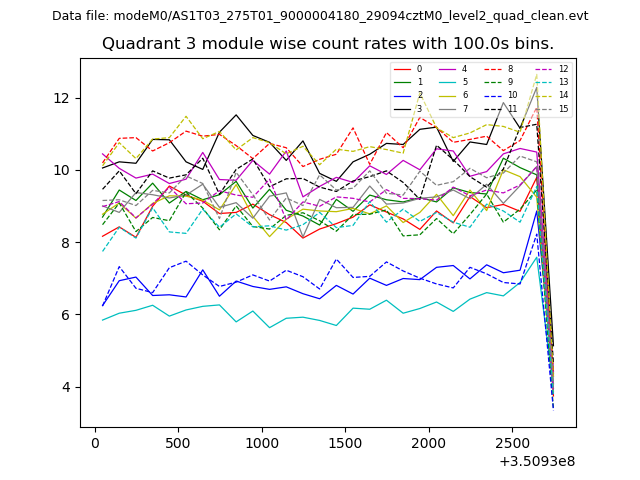
| Module-wise count rates for Quadrant C Data is divided into 100 sec bins |
 |
 |
| Module-wise count rates for Quadrant D Data is divided into 100 sec bins |
 |
 |
| Parameter | Plot |
|---|---|
| CZT HV Monitor | 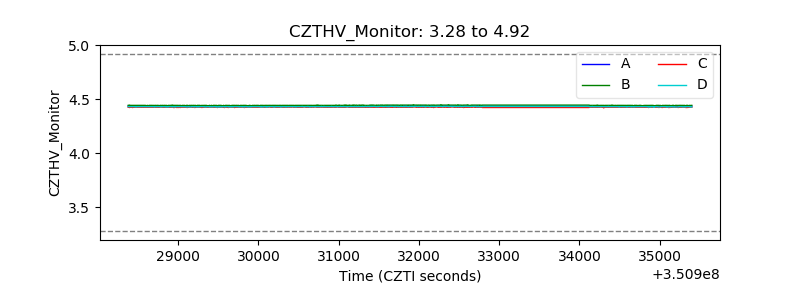 |
| D_VDD |  |
| Temperature 1 | 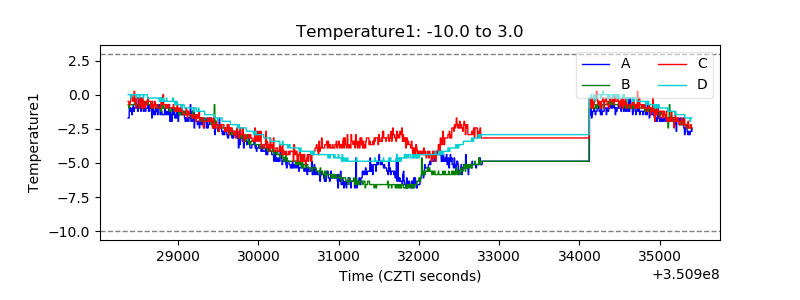 |
| Veto HV Monitor | 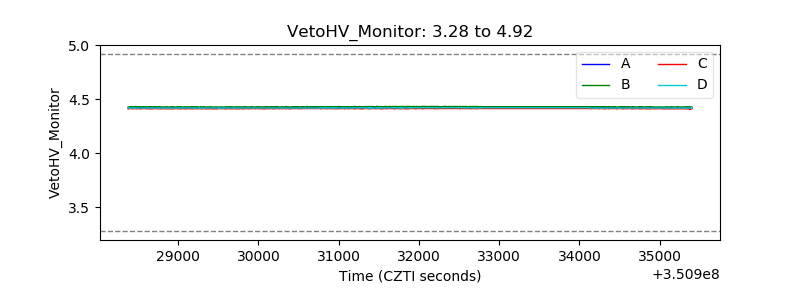 |
| Veto LLD | 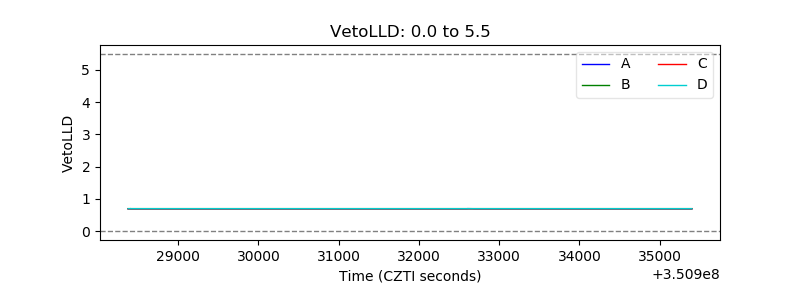 |
| Alpha Counter |  |
| _CPM_Rate | 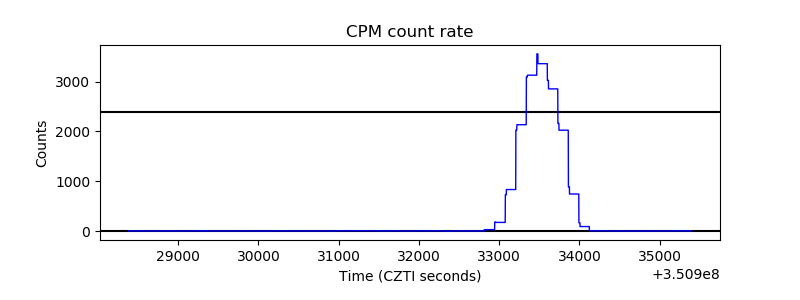 |
| CZT Counter | 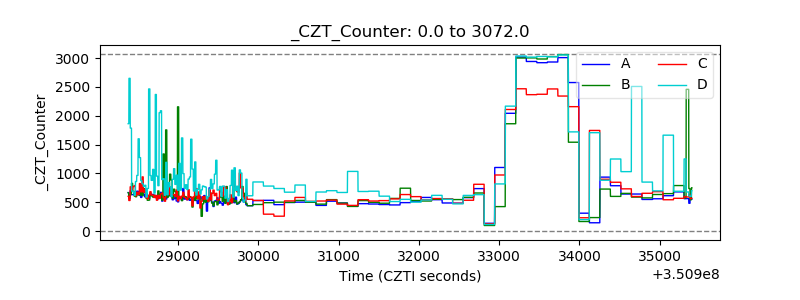 |
| +2.5 Volts monitor |  |
| +5 Volts monitor |  |
| _ROLL_ROT | 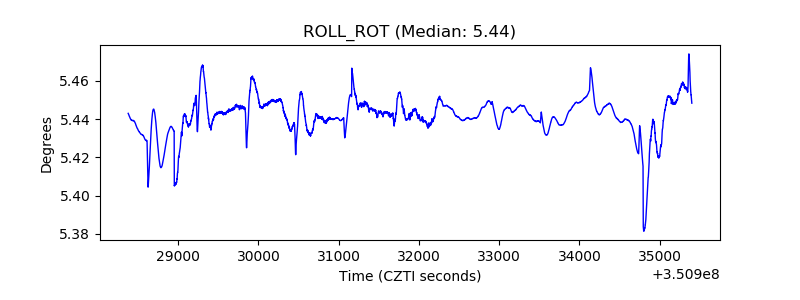 |
| _Roll_DEC | 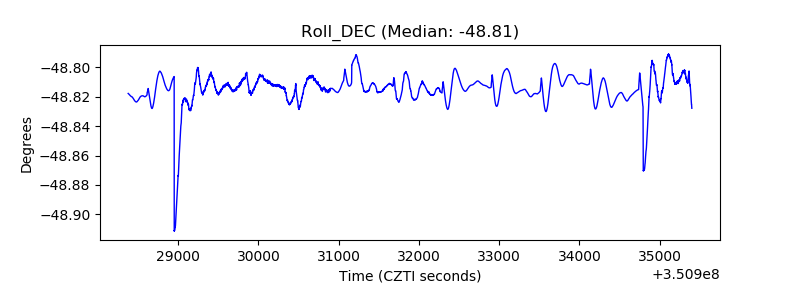 |
| _Roll_RA | 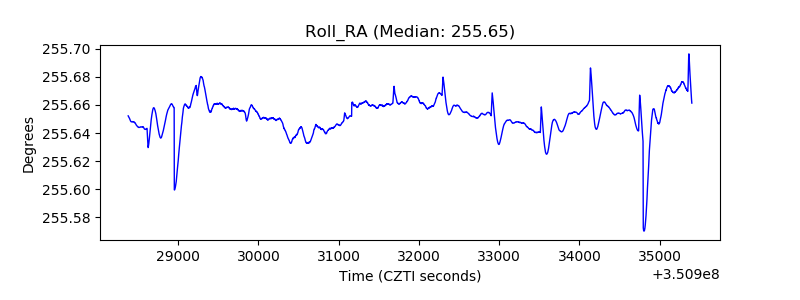 |
| Veto Counter | 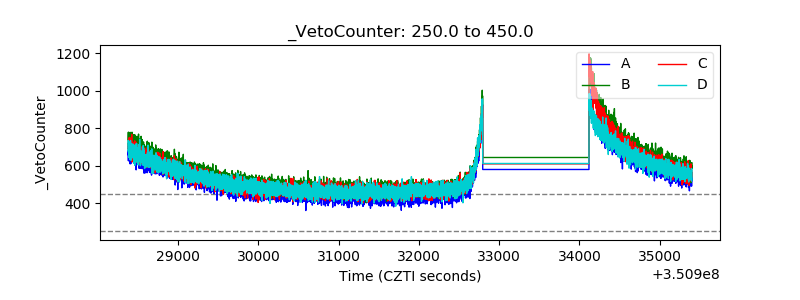 |