| Param | Original file | Final file |
|---|---|---|
| Filename | modeM0/AS1T03_275T01_9000004180_29095cztM0_level2.evt | modeM0/AS1T03_275T01_9000004180_29095cztM0_level2_quad_clean.evt |
| Size (bytes) | 488,053,440 | 76,423,680 |
| Size | 465.4 MB | 72.9 MB |
| Events in quadrant A | 3,154,292 | 497,509 |
| Events in quadrant B | 3,432,795 | 501,767 |
| Events in quadrant C | 3,466,655 | 460,359 |
| Events in quadrant D | 4,337,712 | 453,089 |
| Mode M9 | |||
|---|---|---|---|
| Quadrant | BADHDUFLAG | Total packets | Discarded packets |
| A | 0 | 14 | 0 |
| B | 0 | 14 | 0 |
| C | 0 | 14 | 0 |
| D | 0 | 14 | 0 |
| Mode M0 | |||
|---|---|---|---|
| Quadrant | BADHDUFLAG | Total packets | Discarded packets |
| A | 0 | 12879 | 1 |
| B | 0 | 13790 | 1 |
| C | 0 | 14044 | 3 |
| D | 0 | 16912 | 1 |
| Mode SS | |||
|---|---|---|---|
| Quadrant | BADHDUFLAG | Total packets | Discarded packets |
| A | 0 | 118 | 0 |
| B | 0 | 118 | 0 |
| C | 0 | 118 | 0 |
| D | 0 | 118 | 0 |
| Quadrant | Total seconds | Saturated seconds | Saturation percentage |
|---|---|---|---|
| A | 5739 | 40 | 0.696986% |
| B | 5739 | 116 | 2.021258% |
| C | 5738 | 111 | 1.934472% |
| D | 5738 | 162 | 2.823283% |
Noise dominated data is calculated using 1-second bins in cleaned event files. If a bin has >2000 counts, and if more than 50% of those come from <1% of pixels, then it is considered to be noise-dominated and hence unusable.
| Quadrant | # 1 sec bins | Bins with >0 counts | Bins with >2000 counts | High rate bins dominated by noise | Noise dominated (total time) | Noise dominated (detector-on time) | Marked lightcurve |
|---|---|---|---|---|---|---|---|
| A | 7154 | 5740 | 0 | 0 | 0.00% | 0.00% | 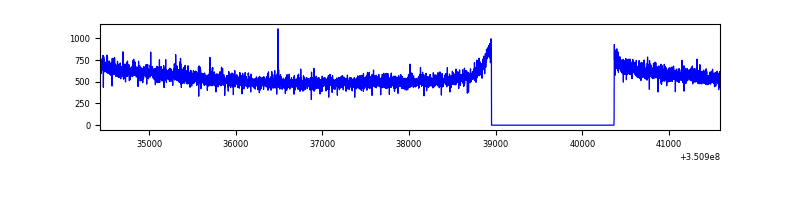 |
| B | 7154 | 5740 | 47 | 47 | 0.66% | 0.82% | 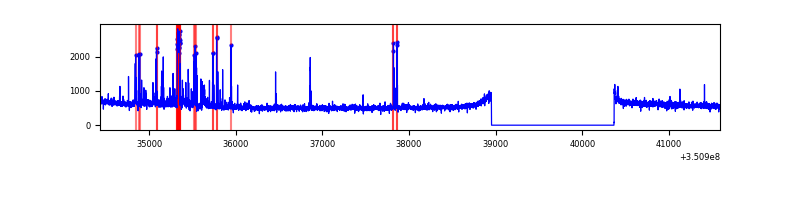 |
| C | 7153 | 5739 | 1 | 1 | 0.01% | 0.02% | 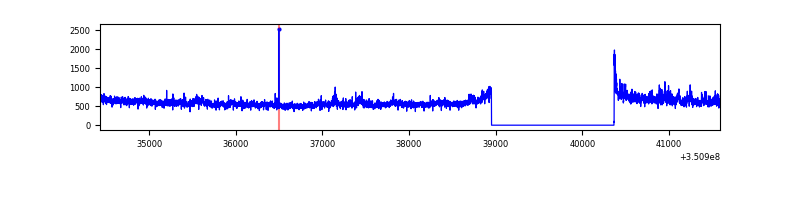 |
| D | 7153 | 5739 | 131 | 131 | 1.83% | 2.28% | 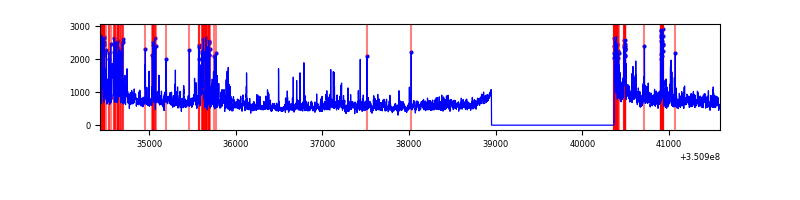 |
Top three noisy pixels from each quadrant. If the there are fewer than three noisy pixels in the level2.evt file, extra rows are filled as -1
| Pixel properties | Quadrant properties | ||||||
|---|---|---|---|---|---|---|---|
| Quadrant | DetID | PixID | Counts | Sigma | Mean | Median | Sigma |
| A | 6 | 16 | 17061 | 101.96 | 813 | 803 | 159.4 |
| A | 13 | 254 | 10618 | 61.56 | 813 | 803 | 159.4 |
| A | 0 | 226 | 7138 | 39.73 | 813 | 803 | 159.4 |
| B | 5 | 172 | 186665 | 1281.54 | 803 | 788 | 145.0 |
| B | 10 | 246 | 22181 | 147.5 | 803 | 788 | 145.0 |
| B | 10 | 245 | 20120 | 133.29 | 803 | 788 | 145.0 |
| C | 3 | 233 | 368586 | 2127.11 | 756 | 763 | 172.9 |
| C | 14 | 238 | 127627 | 733.65 | 756 | 763 | 172.9 |
| C | 2 | 114 | 14302 | 78.3 | 756 | 763 | 172.9 |
| D | 8 | 195 | 784185 | 4412.04 | 759 | 742 | 177.6 |
| D | 1 | 52 | 311874 | 1752.17 | 759 | 742 | 177.6 |
| D | 12 | 233 | 311316 | 1749.03 | 759 | 742 | 177.6 |
Histogram calculated using DETX and DETY for each event in the final _common_clean file
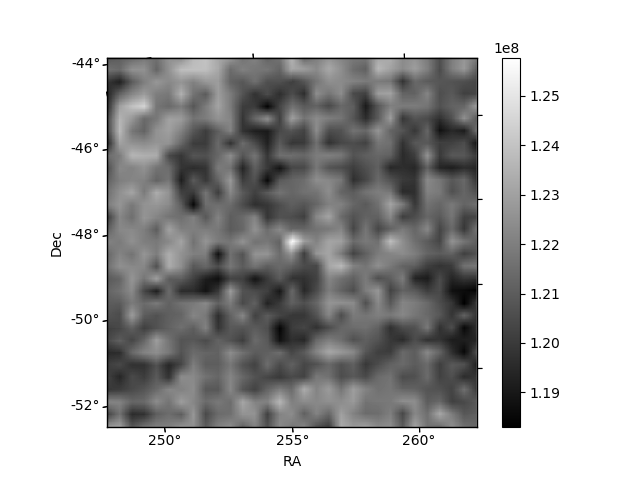
| Quadrant A | 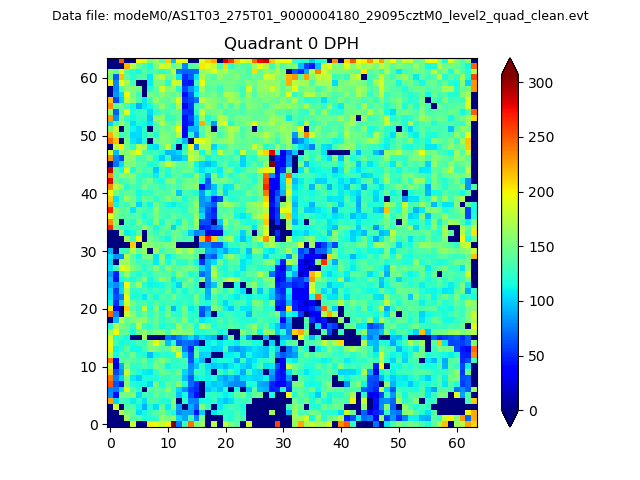 |
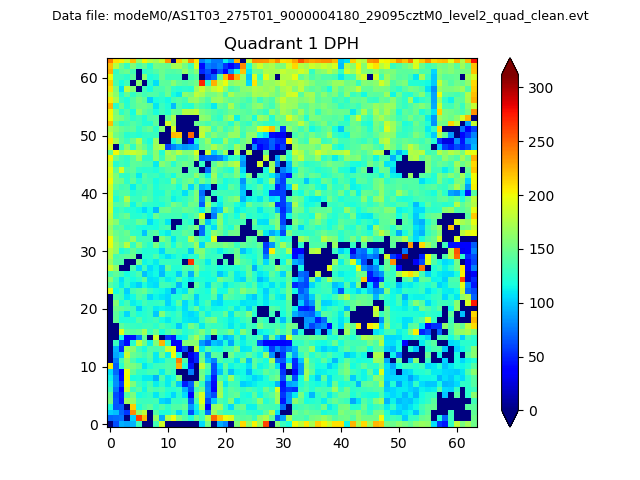 |
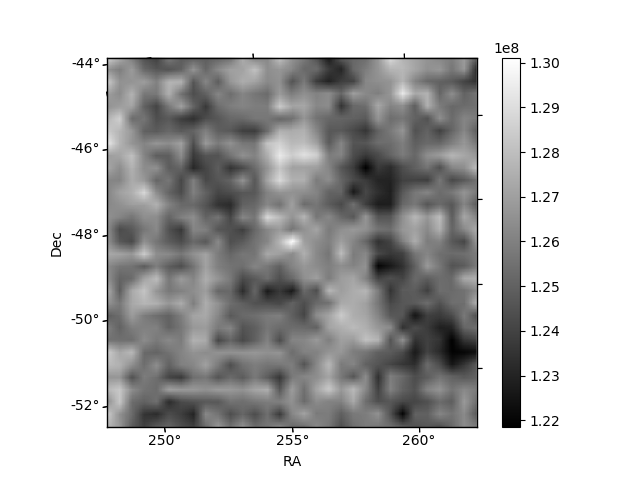
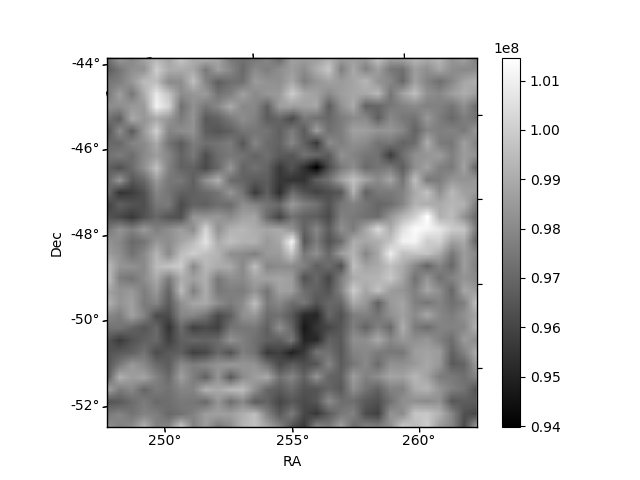
Quadrant B |
|---|---|---|---|
| Quadrant D |  |
 |
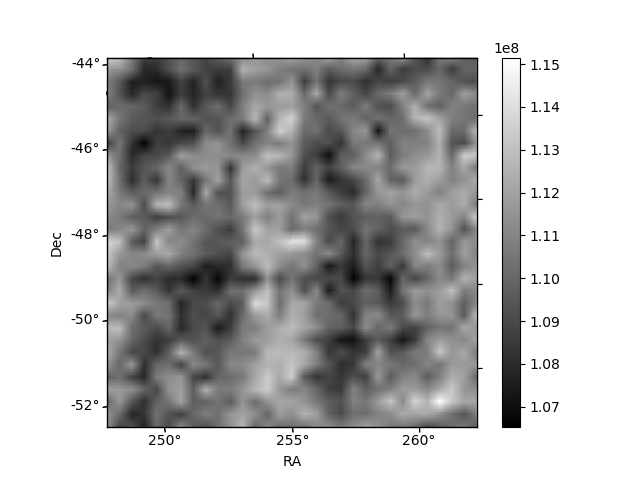
Quadrant C |
| Plot type | Count rate plots | Images |
|---|---|---|
| Comparison with Poisson distribution Blue bars denote a histogram of data divided into 1 sec bins. Red curve is a Poisson curve with rate = median count rate of data. |
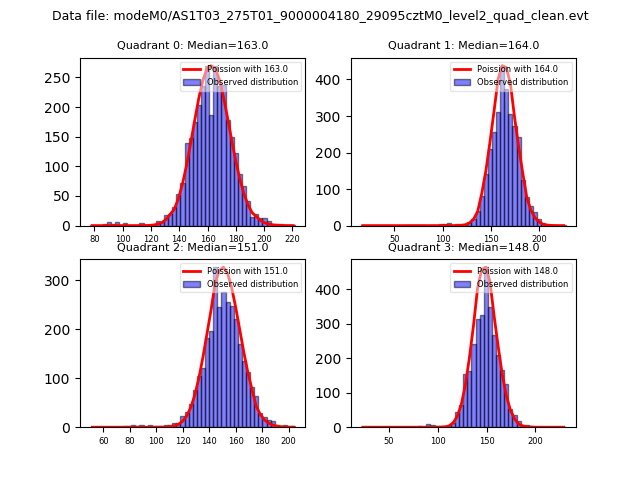 |
 |
| Quadrant-wise count rates Data is divided into 100 sec bins |
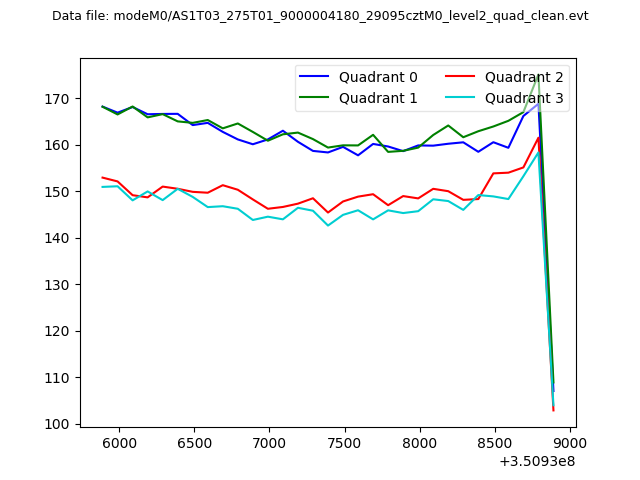 |
|
| Module-wise count rates for Quadrant A Data is divided into 100 sec bins |
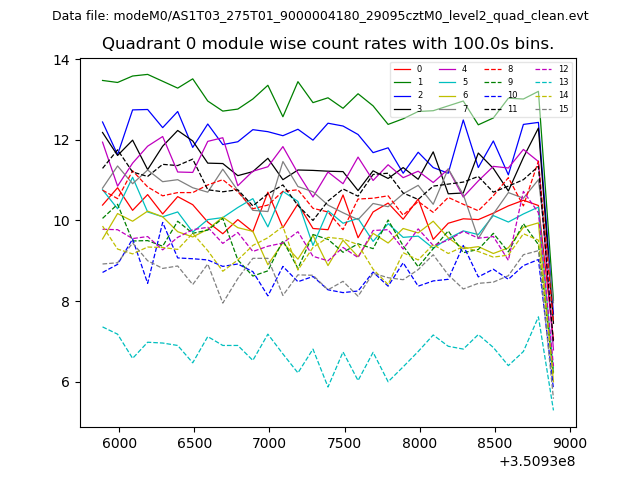 |
 |
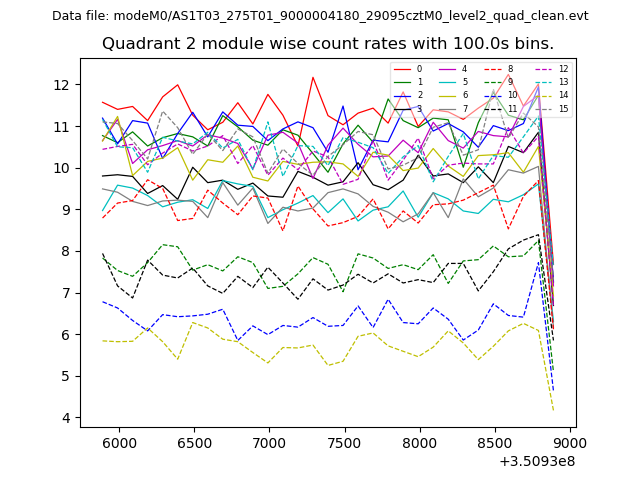
| Module-wise count rates for Quadrant B Data is divided into 100 sec bins |
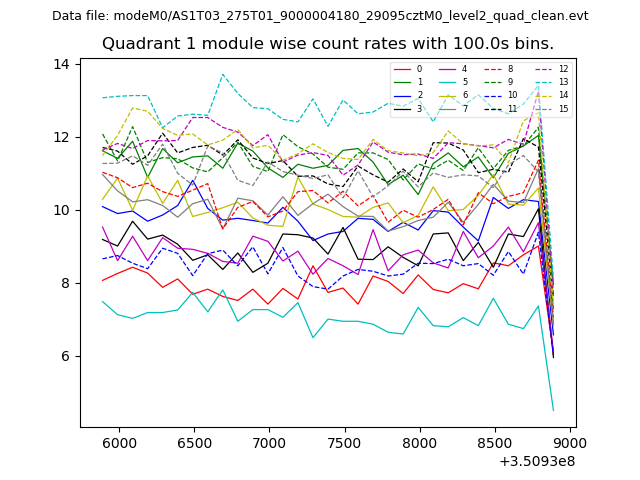 |
 |
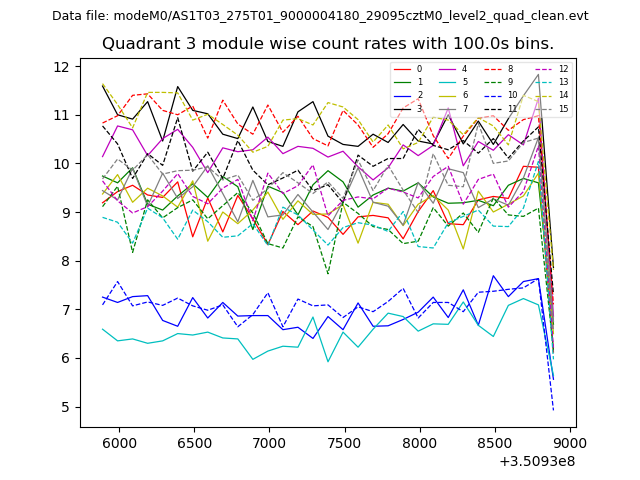
| Module-wise count rates for Quadrant C Data is divided into 100 sec bins |
 |
 |
| Module-wise count rates for Quadrant D Data is divided into 100 sec bins |
 |
 |
| Parameter | Plot |
|---|---|
| CZT HV Monitor | 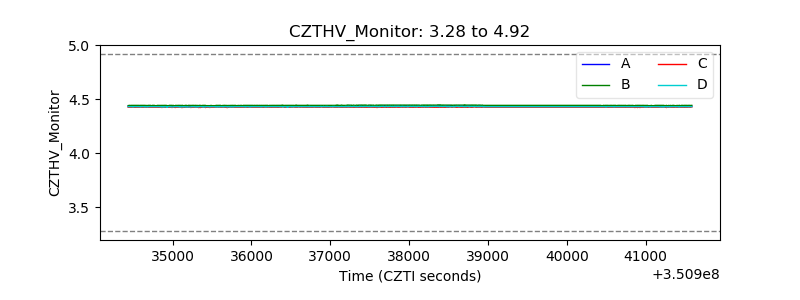 |
| D_VDD | 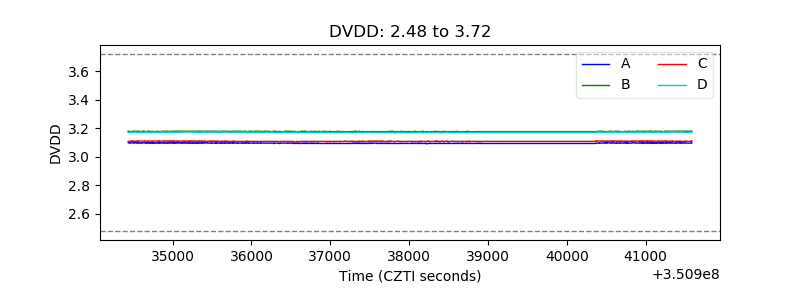 |
| Temperature 1 | 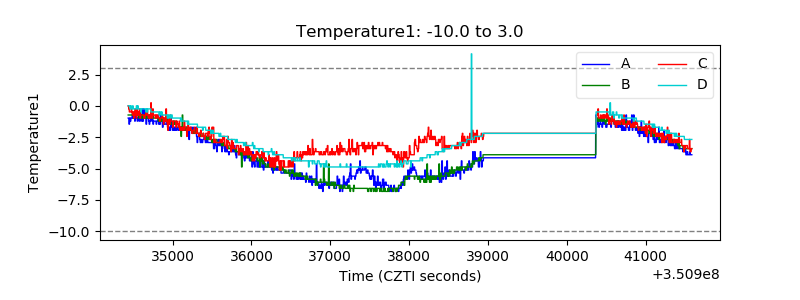 |
| Veto HV Monitor | 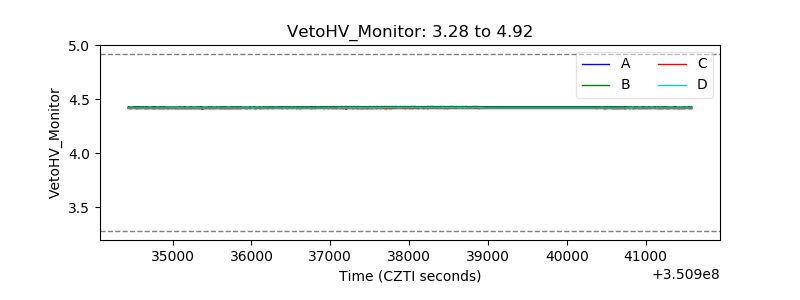 |
| Veto LLD | 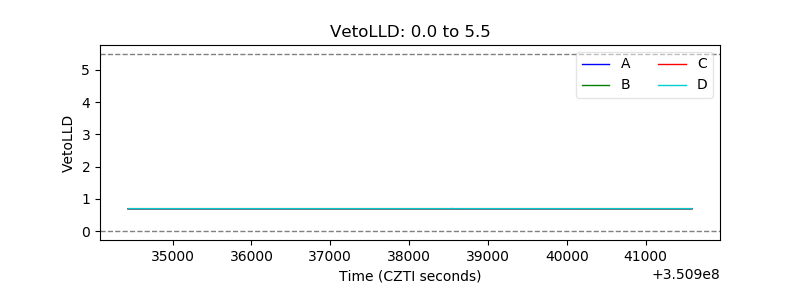 |
| Alpha Counter | 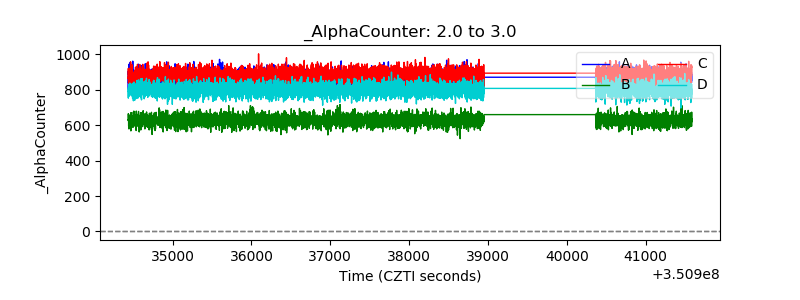 |
| _CPM_Rate | 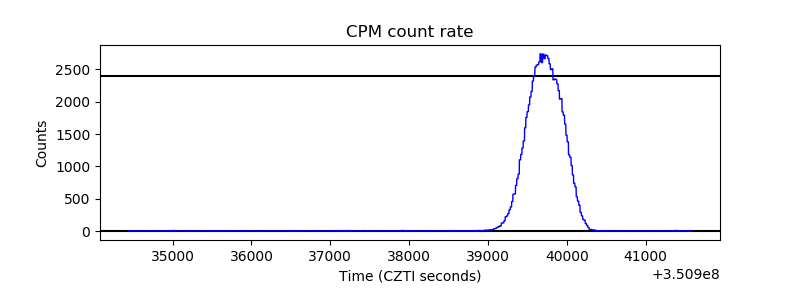 |
| CZT Counter |  |
| +2.5 Volts monitor |  |
| +5 Volts monitor | 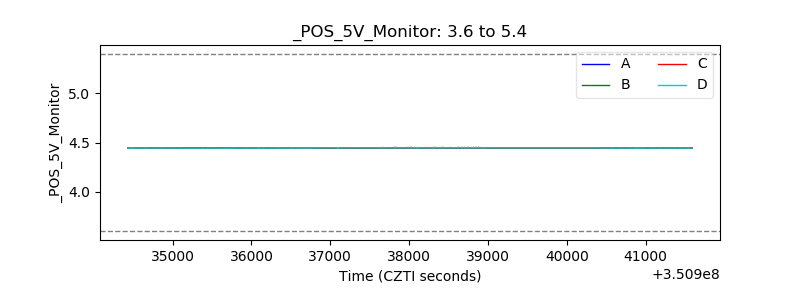 |
| _ROLL_ROT | 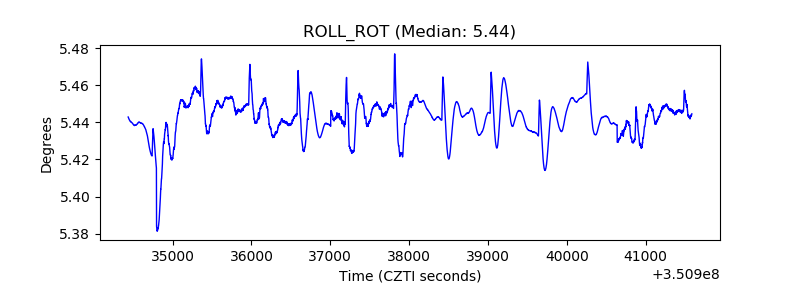 |
| _Roll_DEC | 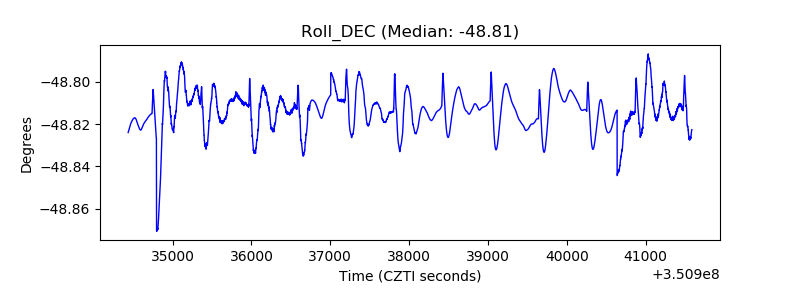 |
| _Roll_RA |  |
| Veto Counter | 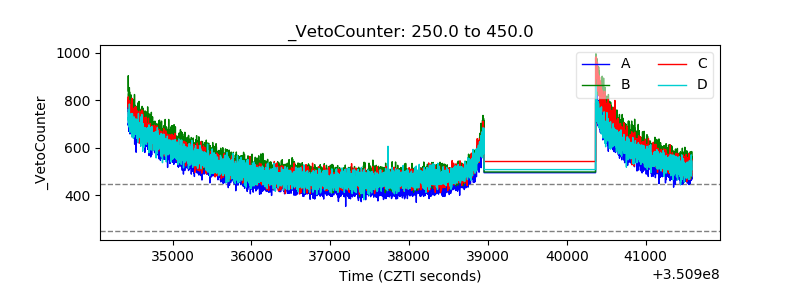 |