| Param | Original file | Final file |
|---|---|---|
| Filename | modeM0/AS1T03_275T01_9000004180_29096cztM0_level2.evt | modeM0/AS1T03_275T01_9000004180_29096cztM0_level2_quad_clean.evt |
| Size (bytes) | 280,120,320 | 52,174,080 |
| Size | 267.1 MB | 49.8 MB |
| Events in quadrant A | 1,778,520 | 348,383 |
| Events in quadrant B | 1,821,763 | 353,641 |
| Events in quadrant C | 1,997,809 | 322,830 |
| Events in quadrant D | 2,650,121 | 310,467 |
| Mode M0 | |||
|---|---|---|---|
| Quadrant | BADHDUFLAG | Total packets | Discarded packets |
| A | 0 | 7364 | 0 |
| B | 0 | 7460 | 0 |
| C | 0 | 8178 | 0 |
| D | 0 | 10253 | 0 |
| Mode SS | |||
|---|---|---|---|
| Quadrant | BADHDUFLAG | Total packets | Discarded packets |
| A | 0 | 68 | 0 |
| B | 0 | 68 | 0 |
| C | 0 | 68 | 0 |
| D | 0 | 68 | 0 |
| Quadrant | Total seconds | Saturated seconds | Saturation percentage |
|---|---|---|---|
| A | 3449 | 3 | 0.086982% |
| B | 3450 | 11 | 0.318841% |
| C | 3450 | 29 | 0.840580% |
| D | 3450 | 107 | 3.101449% |
Noise dominated data is calculated using 1-second bins in cleaned event files. If a bin has >2000 counts, and if more than 50% of those come from <1% of pixels, then it is considered to be noise-dominated and hence unusable.
| Quadrant | # 1 sec bins | Bins with >0 counts | Bins with >2000 counts | High rate bins dominated by noise | Noise dominated (total time) | Noise dominated (detector-on time) | Marked lightcurve |
|---|---|---|---|---|---|---|---|
| A | 3449 | 3449 | 0 | 0 | 0.00% | 0.00% | 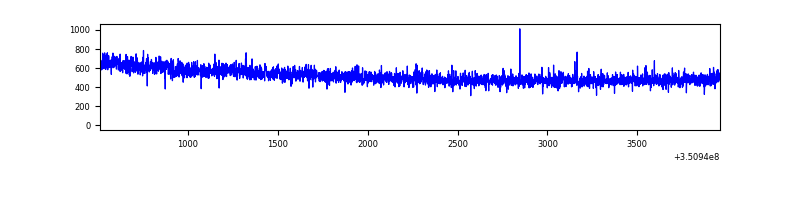 |
| B | 3450 | 3450 | 1 | 1 | 0.03% | 0.03% | 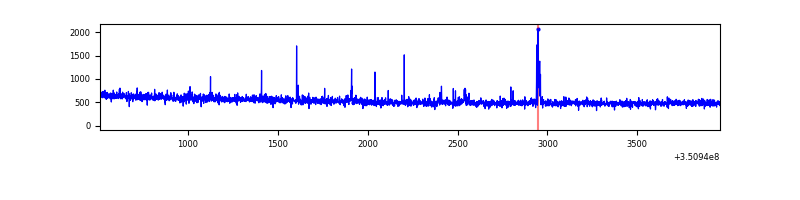 |
| C | 3450 | 3450 | 0 | 0 | 0.00% | 0.00% | 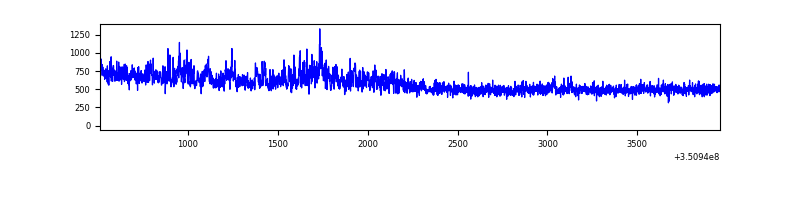 |
| D | 3450 | 3450 | 110 | 110 | 3.19% | 3.19% | 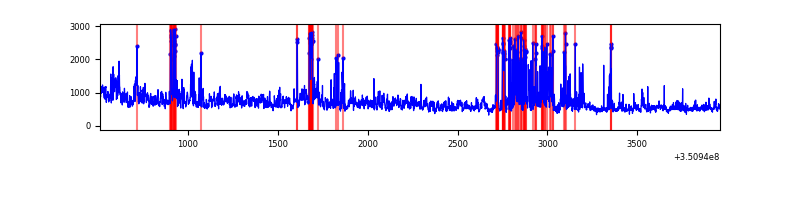 |
Top three noisy pixels from each quadrant. If the there are fewer than three noisy pixels in the level2.evt file, extra rows are filled as -1
| Pixel properties | Quadrant properties | ||||||
|---|---|---|---|---|---|---|---|
| Quadrant | DetID | PixID | Counts | Sigma | Mean | Median | Sigma |
| A | 6 | 16 | 21481 | 233.4 | 455 | 449 | 90.1 |
| A | 13 | 254 | 7063 | 73.4 | 455 | 449 | 90.1 |
| A | 0 | 226 | 3907 | 38.37 | 455 | 449 | 90.1 |
| B | 0 | 183 | 24510 | 283.99 | 456 | 448 | 84.7 |
| B | 12 | 111 | 9233 | 103.68 | 456 | 448 | 84.7 |
| B | 11 | 111 | 8202 | 91.52 | 456 | 448 | 84.7 |
| C | 3 | 233 | 250559 | 2540.28 | 427 | 432 | 98.5 |
| C | 14 | 238 | 72249 | 729.37 | 427 | 432 | 98.5 |
| C | 2 | 114 | 8390 | 80.82 | 427 | 432 | 98.5 |
| D | 8 | 195 | 467008 | 4625.83 | 423 | 412 | 100.9 |
| D | 1 | 52 | 346406 | 3430.19 | 423 | 412 | 100.9 |
| D | 2 | 250 | 200722 | 1985.87 | 423 | 412 | 100.9 |
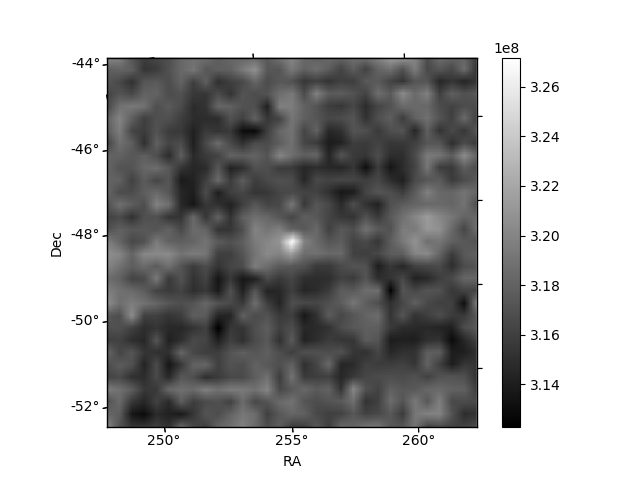
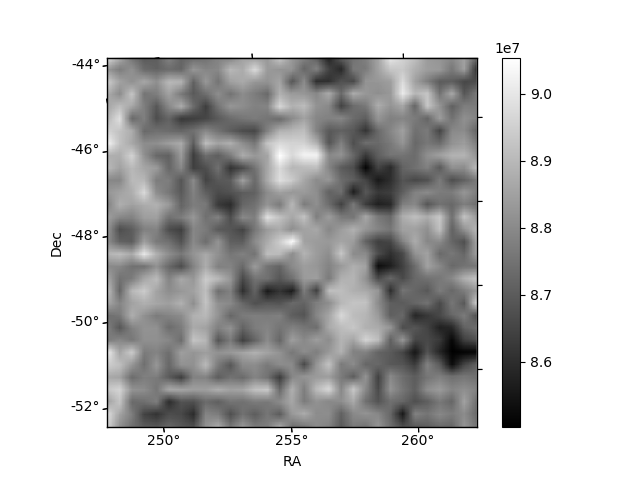
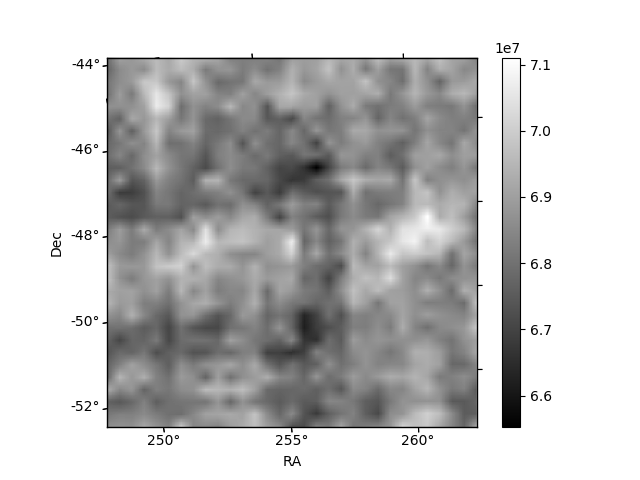
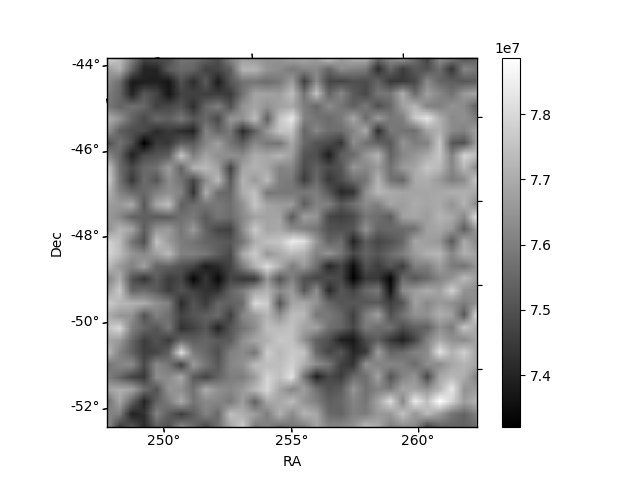
Histogram calculated using DETX and DETY for each event in the final _common_clean file
| Quadrant A | 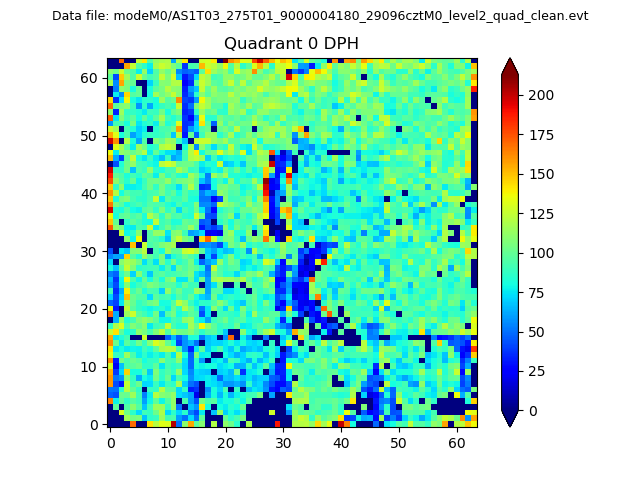 |
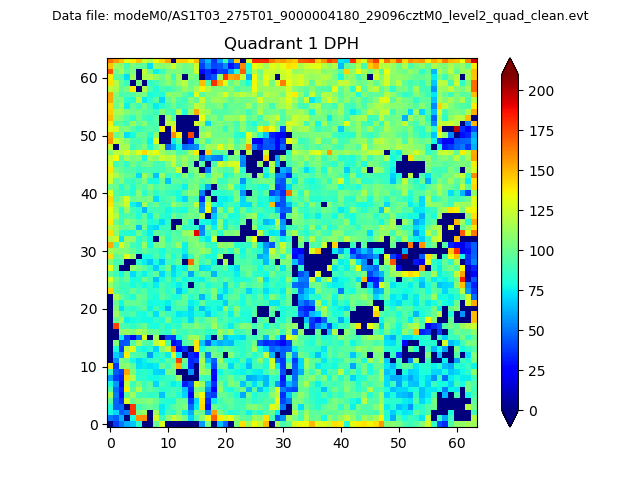 |
Quadrant B |
|---|---|---|---|
| Quadrant D | 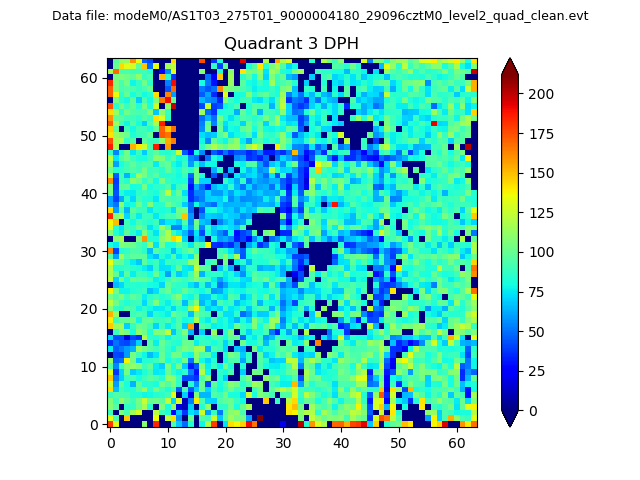 |
 |
Quadrant C |
| Plot type | Count rate plots | Images |
|---|---|---|
| Comparison with Poisson distribution Blue bars denote a histogram of data divided into 1 sec bins. Red curve is a Poisson curve with rate = median count rate of data. |
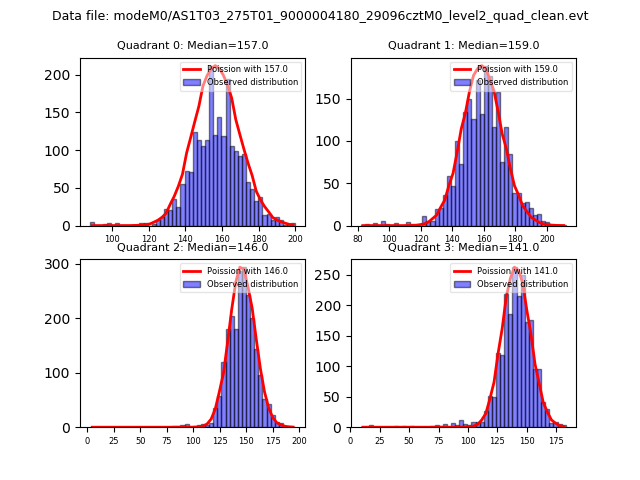 |
 |
| Quadrant-wise count rates Data is divided into 100 sec bins |
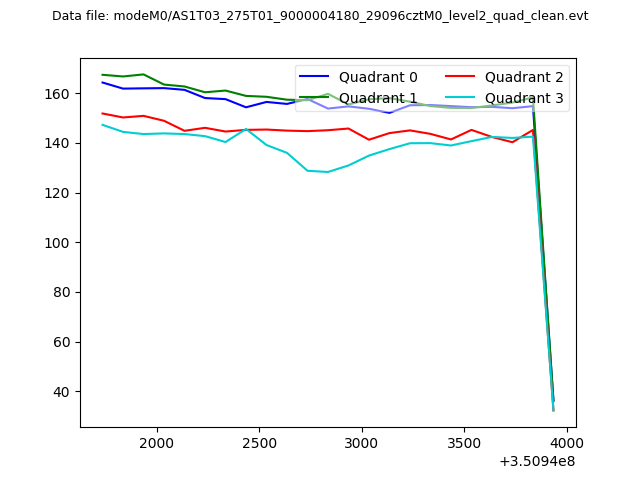 |
|
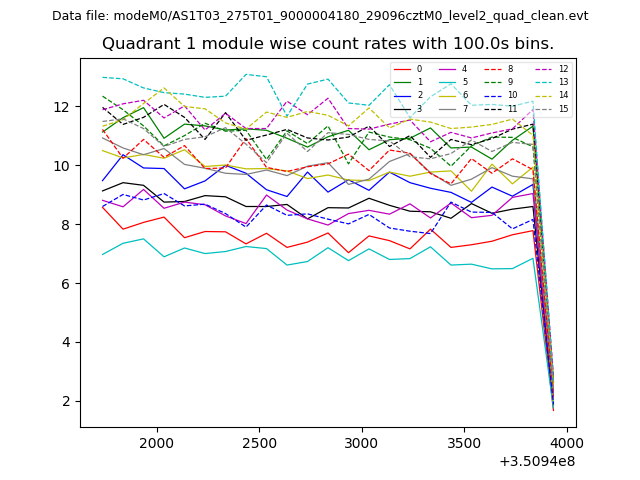
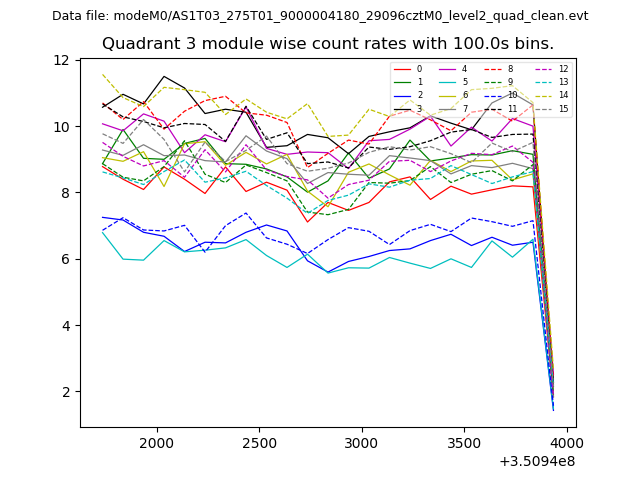
| Module-wise count rates for Quadrant A Data is divided into 100 sec bins |
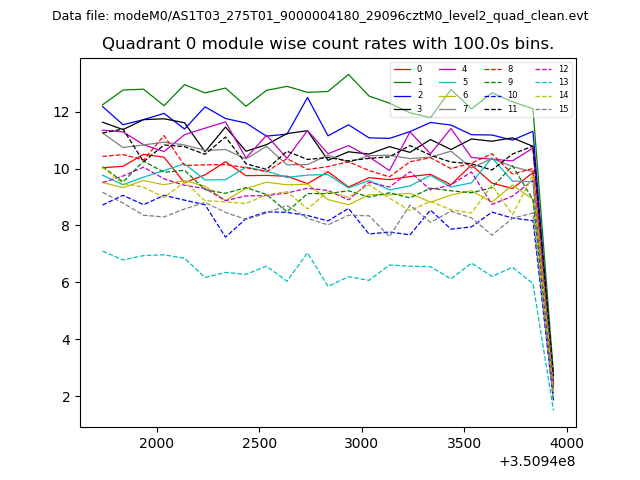 |
 |
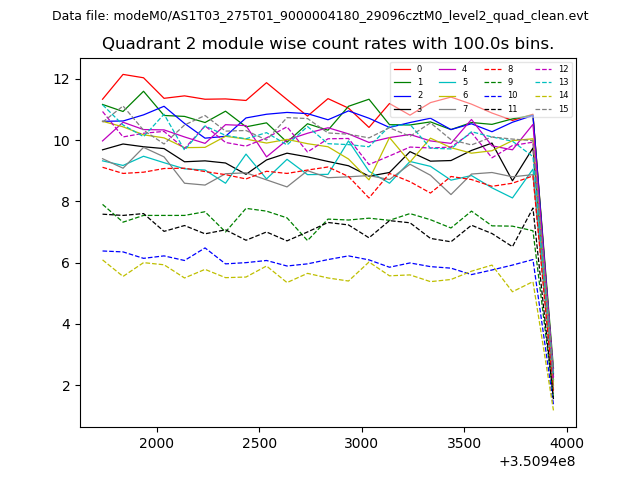
| Module-wise count rates for Quadrant B Data is divided into 100 sec bins |
 |
 |
| Module-wise count rates for Quadrant C Data is divided into 100 sec bins |
 |
 |
| Module-wise count rates for Quadrant D Data is divided into 100 sec bins |
 |
 |
| Parameter | Plot |
|---|---|
| CZT HV Monitor | 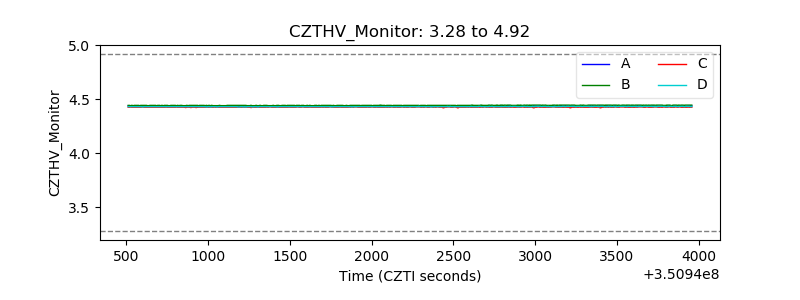 |
| D_VDD | 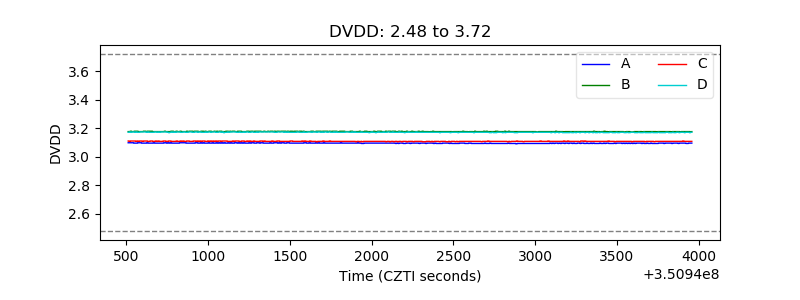 |
| Temperature 1 | 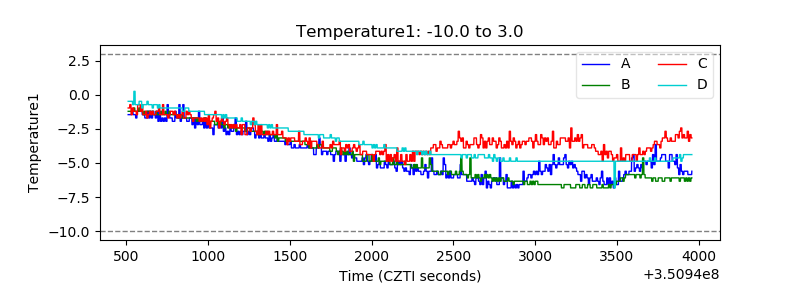 |
| Veto HV Monitor | 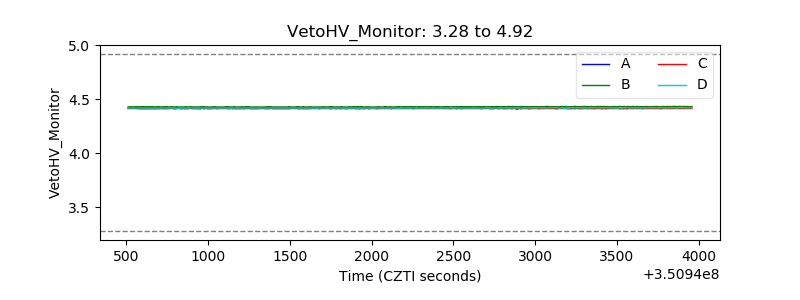 |
| Veto LLD | 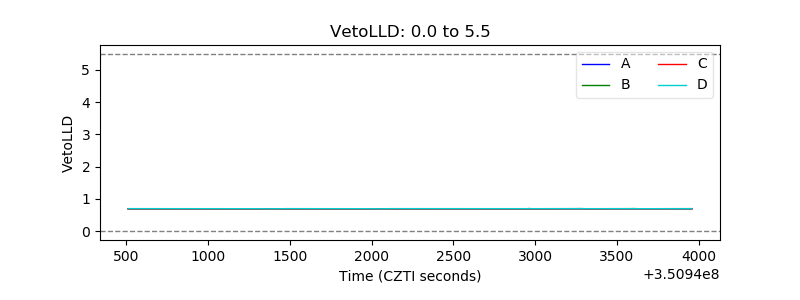 |
| Alpha Counter | 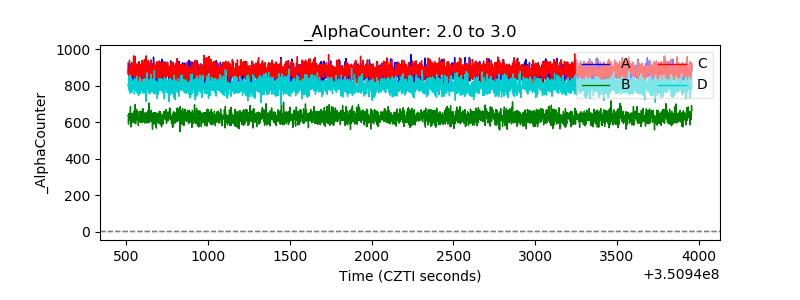 |
| _CPM_Rate | 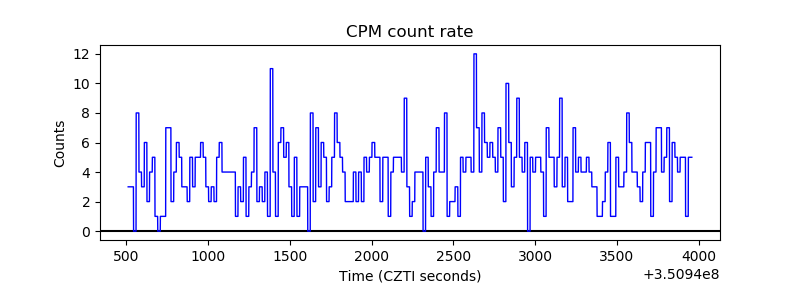 |
| CZT Counter |  |
| +2.5 Volts monitor |  |
| +5 Volts monitor | 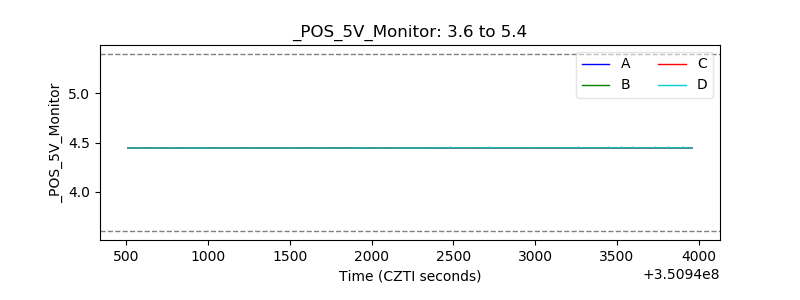 |
| _ROLL_ROT | 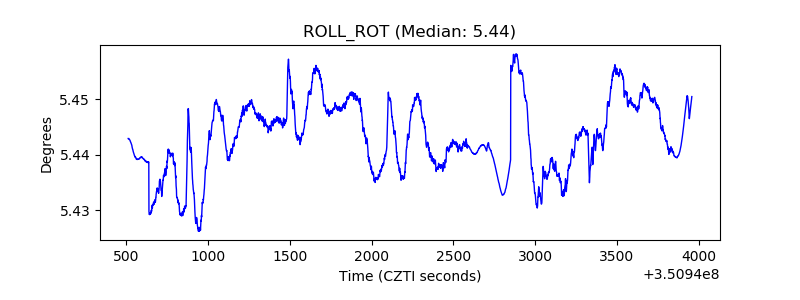 |
| _Roll_DEC | 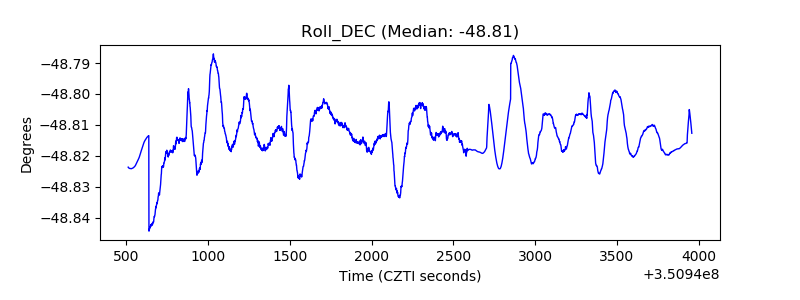 |
| _Roll_RA |  |
| Veto Counter | 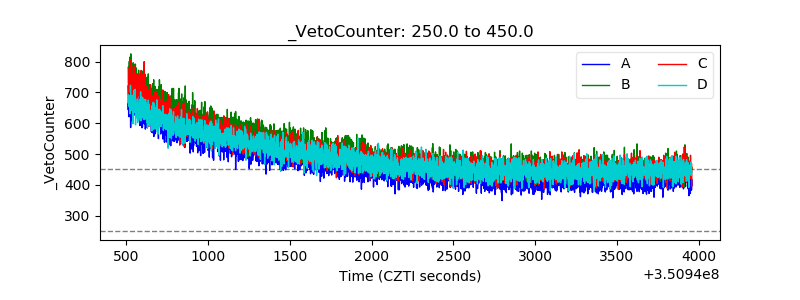 |