| Param | Original file | Final file |
|---|---|---|
| Filename | modeM0/AS1A10_099T01_9000004184cztM0_level2.fits | modeM0/AS1A10_099T01_9000004184cztM0_level2_quad_clean.evt |
| Size (bytes) | 3,004,188,480 | 2,584,624,320 |
| Size | 2.8 GB | 2.4 GB |
| Events in quadrant A | 18,891,800 | 15,226,177 |
| Events in quadrant B | 18,052,860 | 15,323,506 |
| Events in quadrant C | 18,192,030 | 14,479,519 |
| Events in quadrant D | 15,735,580 | 13,136,309 |
| Mode M9 | |||
|---|---|---|---|
| Quadrant | BADHDUFLAG | Total packets | Discarded packets |
| A | 0 | 472 | 0 |
| B | 0 | 472 | 0 |
| C | 0 | 472 | 0 |
| D | 0 | 472 | 0 |
| Mode SS | |||
|---|---|---|---|
| Quadrant | BADHDUFLAG | Total packets | Discarded packets |
| A | 0 | 5986 | 0 |
| B | 0 | 5986 | 0 |
| C | 0 | 5986 | 0 |
| D | 0 | 5986 | 0 |
| Mode M0 | |||
|---|---|---|---|
| Quadrant | BADHDUFLAG | Total packets | Discarded packets |
| A | 0 | 620560 | 0 |
| B | 0 | 638987 | 0 |
| C | 0 | 627894 | 0 |
| D | 0 | 811357 | 0 |
| Quadrant | Total seconds | Saturated seconds | Saturation percentage |
|---|---|---|---|
| A | 293608 | 3301 | 1.124288% |
| B | 293609 | 4658 | 1.586464% |
| C | 293609 | 5428 | 1.848717% |
| D | 293609 | 12843 | 4.374185% |
Noise dominated data is calculated using 1-second bins in cleaned event files. If a bin has >2000 counts, and if more than 50% of those come from <1% of pixels, then it is considered to be noise-dominated and hence unusable.
| Quadrant | # 1 sec bins | Bins with >0 counts | Bins with >2000 counts | High rate bins dominated by noise | Noise dominated (total time) | Noise dominated (detector-on time) | Marked lightcurve |
|---|---|---|---|---|---|---|---|
| A | 344289 | 293608 | 0 | 0 | 0.00% | 0.00% |  |
| B | 344288 | 293552 | 0 | 0 | 0.00% | 0.00% |  |
| C | 344289 | 293609 | 0 | 0 | 0.00% | 0.00% |  |
| D | 344288 | 293546 | 0 | 0 | 0.00% | 0.00% |  |
Top three noisy pixels from each quadrant. If the there are fewer than three noisy pixels in the level2.evt file, extra rows are filled as -1
| Pixel properties | Quadrant properties | ||||||
|---|---|---|---|---|---|---|---|
| Quadrant | DetID | PixID | Counts | Sigma | Mean | Median | Sigma |
| A | 0 | 29 | 15468 | 9.18 | 4921 | 4628 | 1181.4 |
| A | 7 | 110 | 14861 | 8.66 | 4921 | 4628 | 1181.4 |
| A | 9 | 19 | 13851 | 7.81 | 4921 | 4628 | 1181.4 |
| B | 2 | 9 | 14213 | 10.43 | 4773 | 4555 | 925.8 |
| B | 2 | 8 | 11894 | 7.93 | 4773 | 4555 | 925.8 |
| B | 5 | 225 | 11816 | 7.84 | 4773 | 4555 | 925.8 |
| C | 1 | 80 | 13969 | 7.86 | 4808 | 4507 | 1204.3 |
| C | 1 | 81 | 13967 | 7.86 | 4808 | 4507 | 1204.3 |
| C | 12 | 241 | 12426 | 6.58 | 4808 | 4507 | 1204.3 |
| D | 15 | 46 | 11759 | 6.48 | 4491 | 4099 | 1182.5 |
| D | 10 | 189 | 11156 | 5.97 | 4491 | 4099 | 1182.5 |
| D | 6 | 231 | 11107 | 5.93 | 4491 | 4099 | 1182.5 |
Histogram calculated using DETX and DETY for each event in the final _common_clean file
| Quadrant A |  |
 |
Quadrant B |
|---|---|---|---|
| Quadrant D | 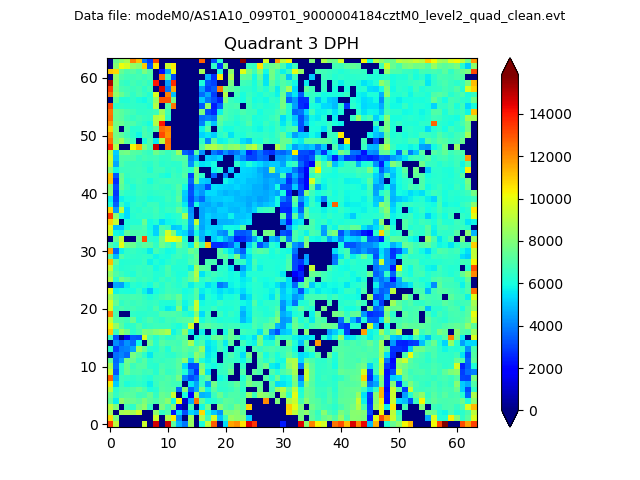 |
 |
Quadrant C |
| Plot type | Count rate plots | Images |
|---|---|---|
| Comparison with Poisson distribution Blue bars denote a histogram of data divided into 1 sec bins. Red curve is a Poisson curve with rate = median count rate of data. |
 |
 |
| Quadrant-wise count rates Data is divided into 100 sec bins |
 |
|
| Module-wise count rates for Quadrant A Data is divided into 100 sec bins |
 |
 |
| Module-wise count rates for Quadrant B Data is divided into 100 sec bins |
 |
 |
| Module-wise count rates for Quadrant C Data is divided into 100 sec bins |
 |
 |
| Module-wise count rates for Quadrant D Data is divided into 100 sec bins |
 |
 |
| Parameter | Plot |
|---|---|
| CZT HV Monitor |  |
| D_VDD |  |
| Temperature 1 |  |
| Veto HV Monitor |  |
| Veto LLD |  |
| Alpha Counter |  |
| _CPM_Rate | 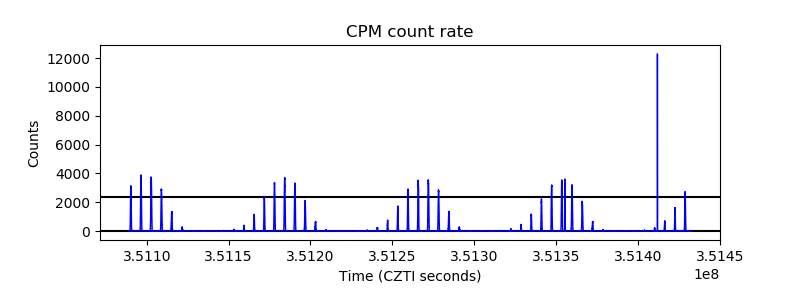 |
| CZT Counter |  |
| +2.5 Volts monitor |  |
| +5 Volts monitor |  |
| _ROLL_ROT |  |
| _Roll_DEC |  |
| _Roll_RA |  |
| Veto Counter |  |