| Param | Original file | Final file |
|---|---|---|
| Filename | modeM0/AS1A10_099T01_9000004184_29122cztM0_level2.evt | modeM0/AS1A10_099T01_9000004184_29122cztM0_level2_quad_clean.evt |
| Size (bytes) | 573,125,760 | 73,817,280 |
| Size | 546.6 MB | 70.4 MB |
| Events in quadrant A | 3,561,516 | 456,461 |
| Events in quadrant B | 3,686,394 | 461,768 |
| Events in quadrant C | 3,900,776 | 442,441 |
| Events in quadrant D | 5,774,174 | 427,067 |
| Mode M9 | |||
|---|---|---|---|
| Quadrant | BADHDUFLAG | Total packets | Discarded packets |
| A | 0 | 18 | 0 |
| B | 0 | 19 | 0 |
| C | 0 | 19 | 0 |
| D | 0 | 19 | 0 |
| Mode SS | |||
|---|---|---|---|
| Quadrant | BADHDUFLAG | Total packets | Discarded packets |
| A | 0 | 132 | 0 |
| B | 0 | 132 | 0 |
| C | 0 | 132 | 0 |
| D | 0 | 132 | 0 |
| Mode M0 | |||
|---|---|---|---|
| Quadrant | BADHDUFLAG | Total packets | Discarded packets |
| A | 0 | 14818 | 2 |
| B | 0 | 15090 | 2 |
| C | 0 | 16062 | 2 |
| D | 0 | 21534 | 2 |
| Quadrant | Total seconds | Saturated seconds | Saturation percentage |
|---|---|---|---|
| A | 6405 | 100 | 1.561280% |
| B | 6405 | 120 | 1.873536% |
| C | 6405 | 161 | 2.513661% |
| D | 6405 | 834 | 13.021077% |
Noise dominated data is calculated using 1-second bins in cleaned event files. If a bin has >2000 counts, and if more than 50% of those come from <1% of pixels, then it is considered to be noise-dominated and hence unusable.
| Quadrant | # 1 sec bins | Bins with >0 counts | Bins with >2000 counts | High rate bins dominated by noise | Noise dominated (total time) | Noise dominated (detector-on time) | Marked lightcurve |
|---|---|---|---|---|---|---|---|
| A | 7695 | 6405 | 0 | 0 | 0.00% | 0.00% |  |
| B | 7695 | 6405 | 14 | 14 | 0.18% | 0.22% |  |
| C | 7695 | 6405 | 1 | 1 | 0.01% | 0.02% |  |
| D | 7695 | 6405 | 733 | 733 | 9.53% | 11.44% | 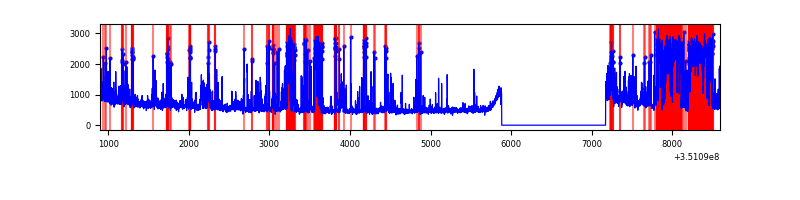 |
Top three noisy pixels from each quadrant. If the there are fewer than three noisy pixels in the level2.evt file, extra rows are filled as -1
| Pixel properties | Quadrant properties | ||||||
|---|---|---|---|---|---|---|---|
| Quadrant | DetID | PixID | Counts | Sigma | Mean | Median | Sigma |
| A | 13 | 254 | 10037 | 49.93 | 923 | 909 | 182.8 |
| A | 3 | 137 | 8116 | 39.42 | 923 | 909 | 182.8 |
| A | 0 | 226 | 8062 | 39.13 | 923 | 909 | 182.8 |
| B | 10 | 245 | 66764 | 390.26 | 910 | 892 | 168.8 |
| B | 0 | 190 | 59680 | 348.29 | 910 | 892 | 168.8 |
| B | 12 | 111 | 20070 | 113.62 | 910 | 892 | 168.8 |
| C | 3 | 233 | 334026 | 1654.13 | 874 | 884 | 201.4 |
| C | 14 | 238 | 143879 | 710.01 | 874 | 884 | 201.4 |
| C | 2 | 114 | 15346 | 71.81 | 874 | 884 | 201.4 |
| D | 1 | 52 | 2245258 | 11415.76 | 837 | 820 | 196.6 |
| D | 8 | 195 | 248178 | 1258.12 | 837 | 820 | 196.6 |
| D | 12 | 16 | 45488 | 227.19 | 837 | 820 | 196.6 |
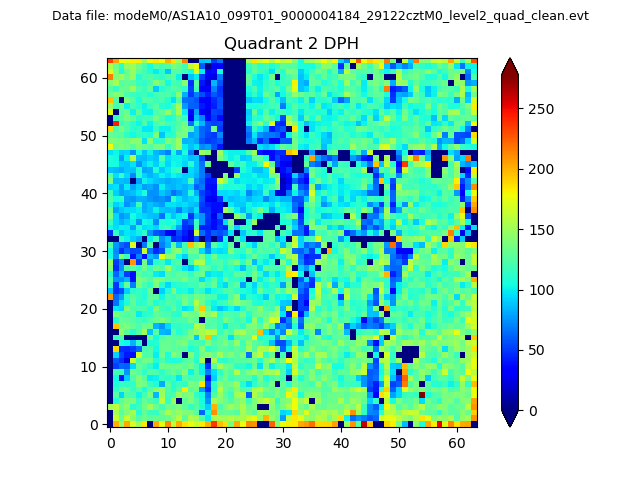
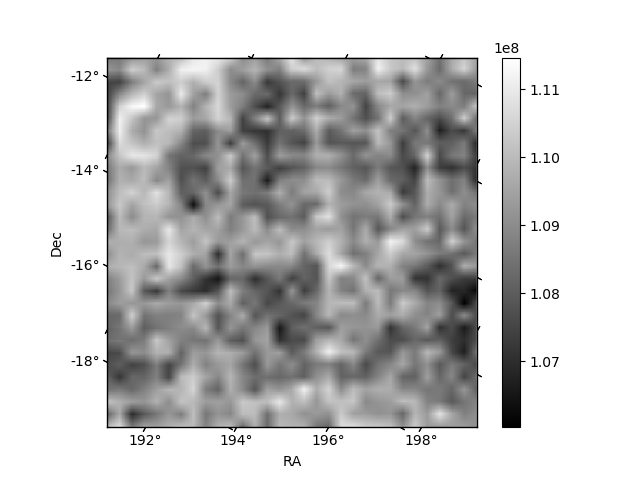
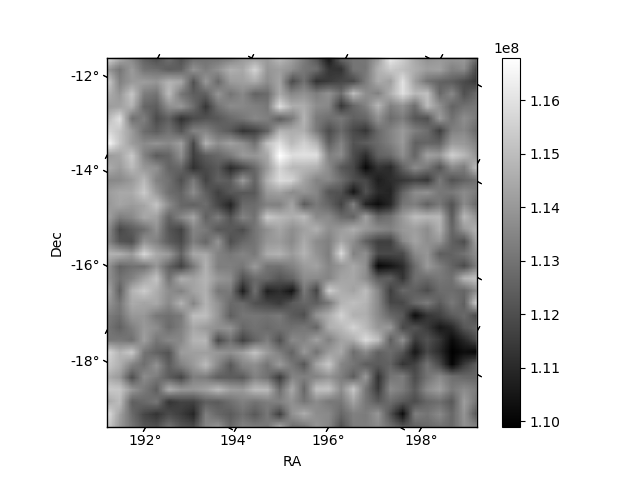
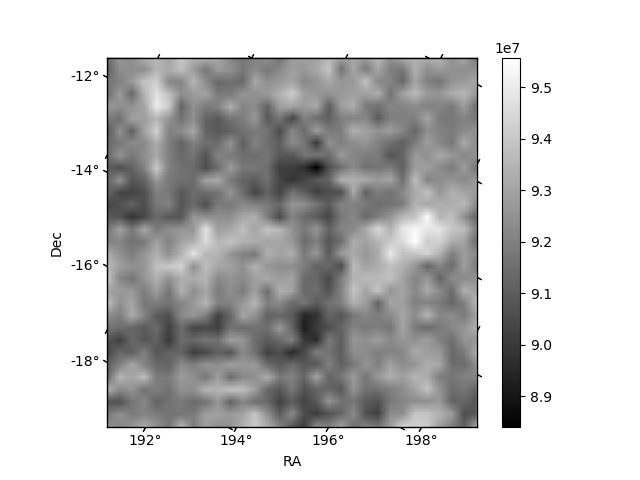
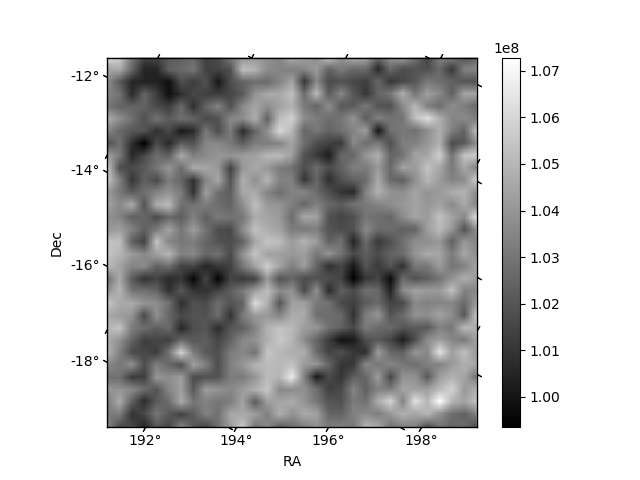
Histogram calculated using DETX and DETY for each event in the final _common_clean file
| Quadrant A | 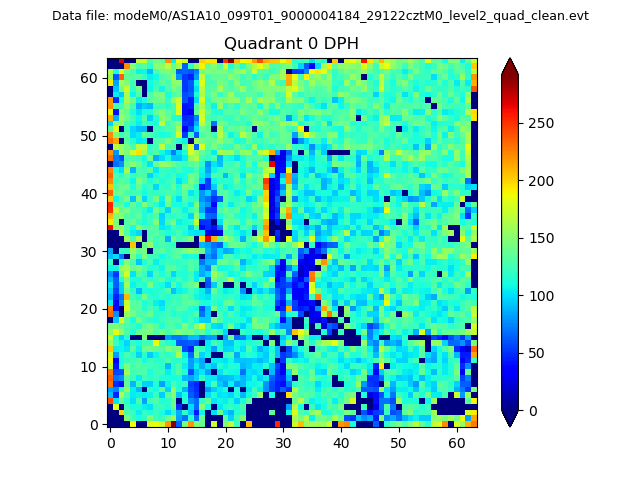 |
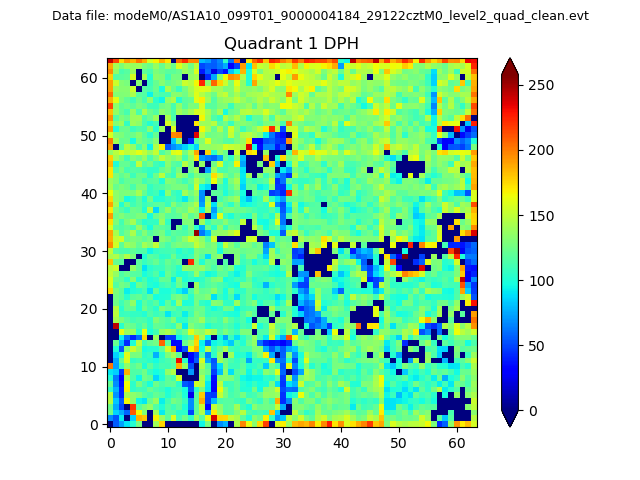 |
Quadrant B |
|---|---|---|---|
| Quadrant D | 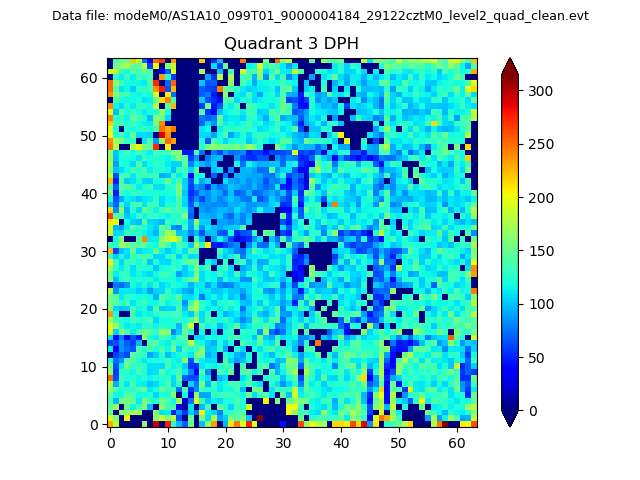 |
 |
Quadrant C |
| Plot type | Count rate plots | Images |
|---|---|---|
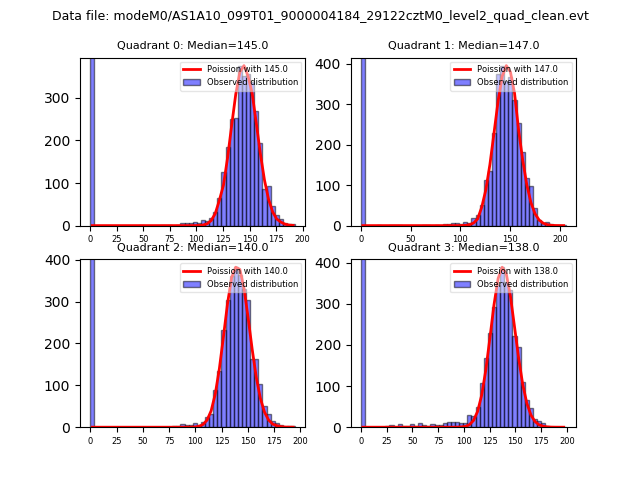
| Comparison with Poisson distribution Blue bars denote a histogram of data divided into 1 sec bins. Red curve is a Poisson curve with rate = median count rate of data. |
 |
 |
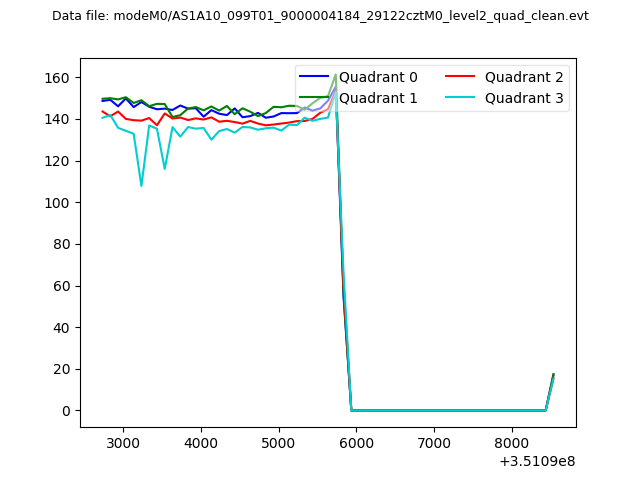
| Quadrant-wise count rates Data is divided into 100 sec bins |
 |
|
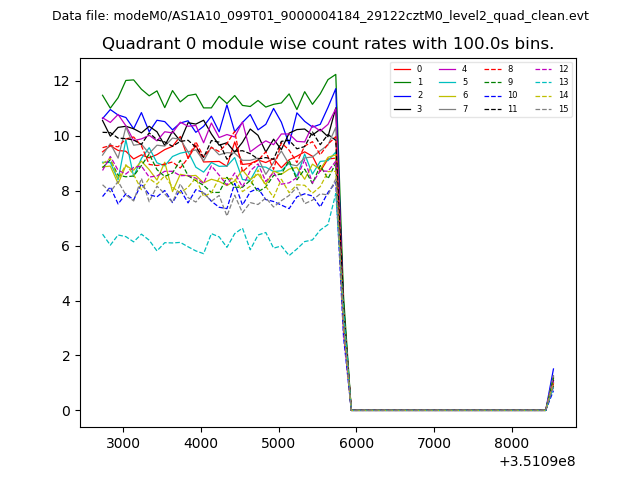
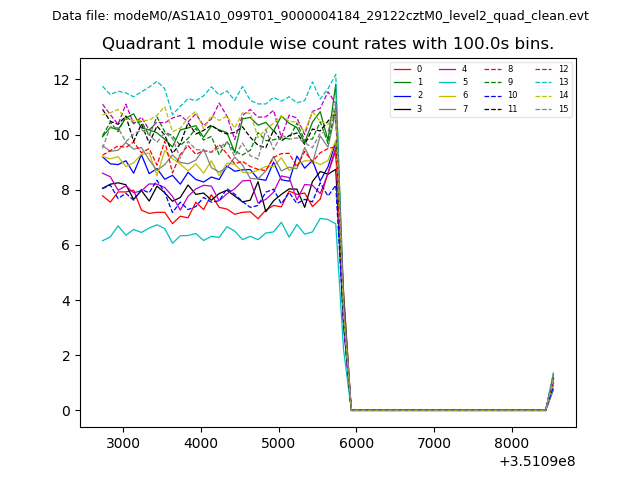
| Module-wise count rates for Quadrant A Data is divided into 100 sec bins |
 |
 |
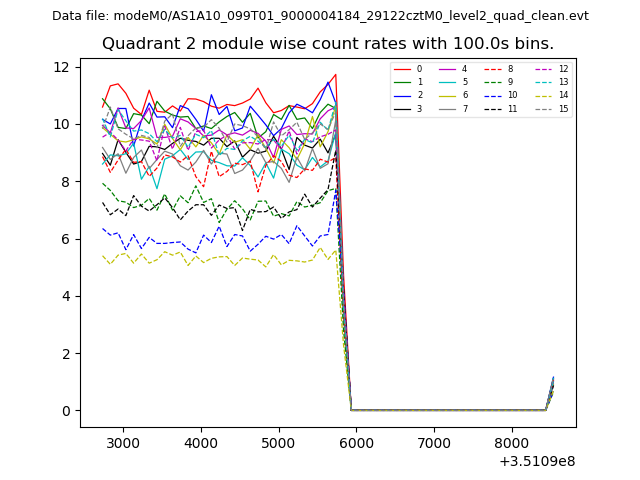
| Module-wise count rates for Quadrant B Data is divided into 100 sec bins |
 |
 |
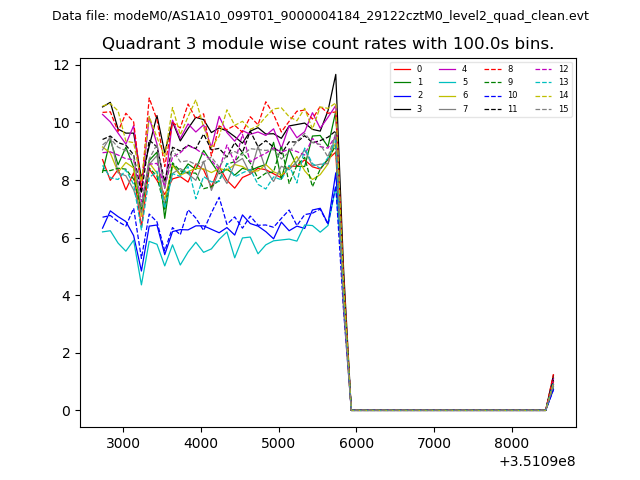
| Module-wise count rates for Quadrant C Data is divided into 100 sec bins |
 |
 |
| Module-wise count rates for Quadrant D Data is divided into 100 sec bins |
 |
 |
| Parameter | Plot |
|---|---|
| CZT HV Monitor | 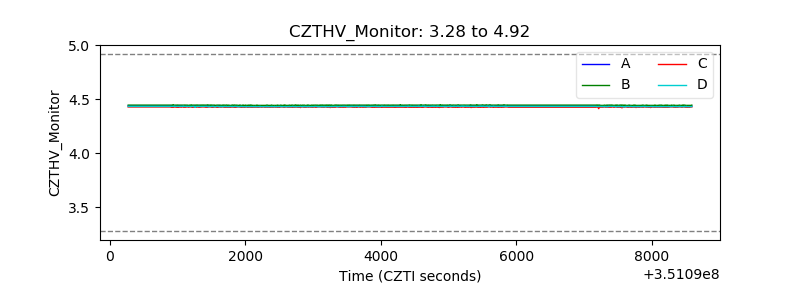 |
| D_VDD | 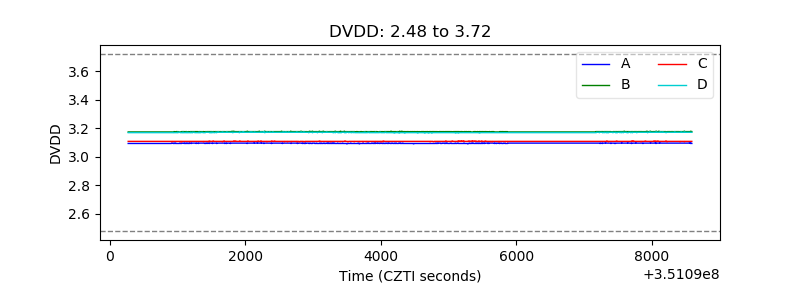 |
| Temperature 1 | 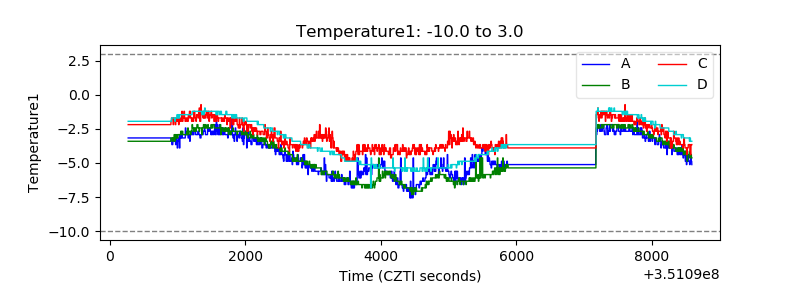 |
| Veto HV Monitor | 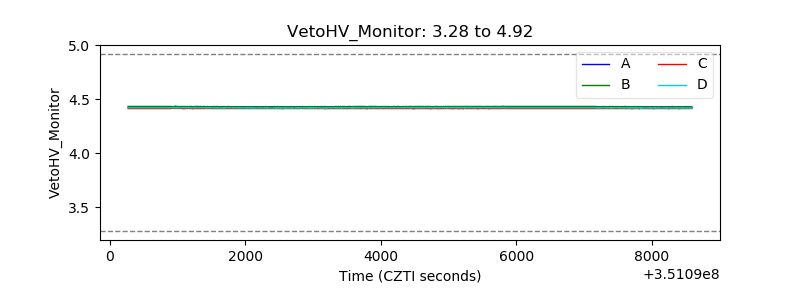 |
| Veto LLD | 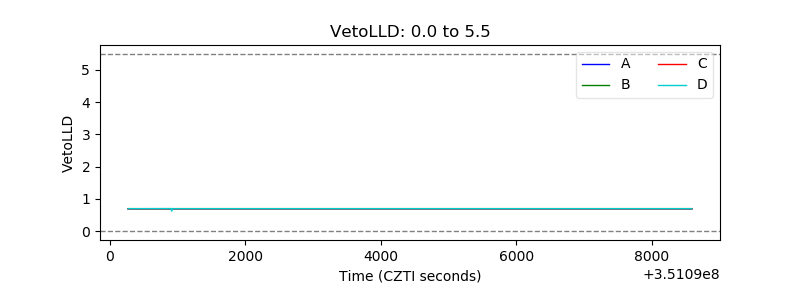 |
| Alpha Counter | 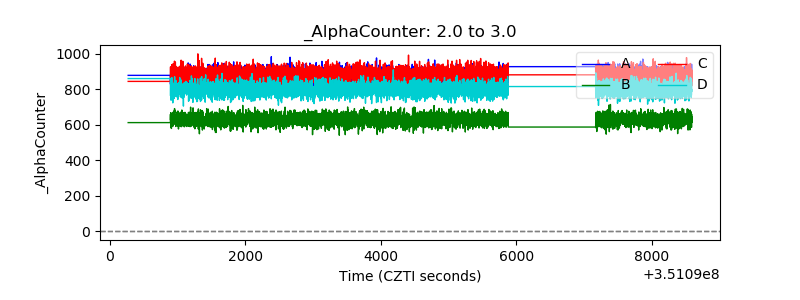 |
| _CPM_Rate | 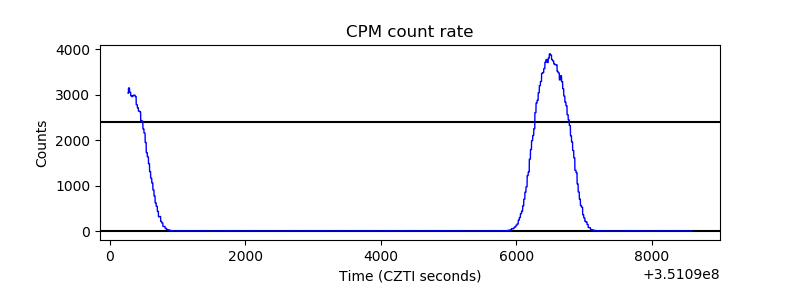 |
| CZT Counter | 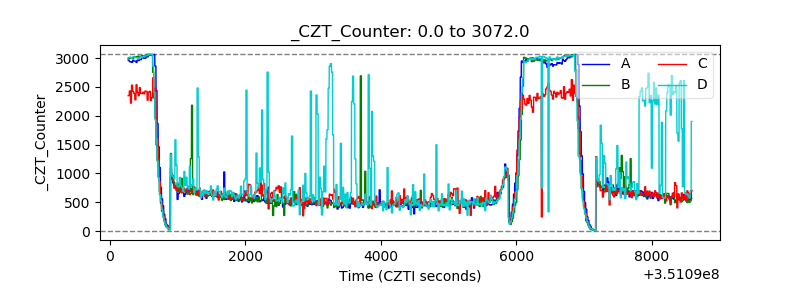 |
| +2.5 Volts monitor |  |
| +5 Volts monitor | 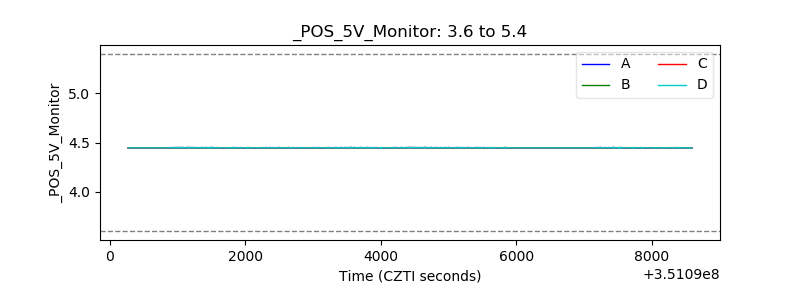 |
| _ROLL_ROT | 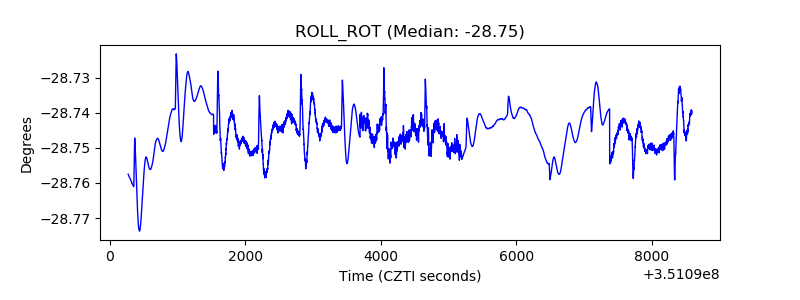 |
| _Roll_DEC |  |
| _Roll_RA |  |
| Veto Counter | 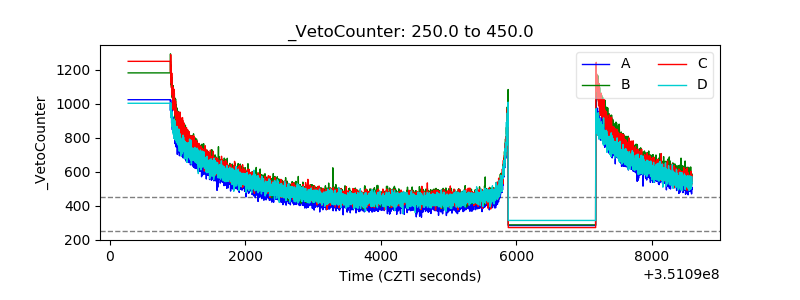 |