| Param | Original file | Final file |
|---|---|---|
| Filename | modeM0/AS1A10_099T01_9000004184_29126cztM0_level2.evt | modeM0/AS1A10_099T01_9000004184_29126cztM0_level2_quad_clean.evt |
| Size (bytes) | 500,512,320 | 103,939,200 |
| Size | 477.3 MB | 99.1 MB |
| Events in quadrant A | 3,302,170 | 686,282 |
| Events in quadrant B | 3,391,576 | 703,150 |
| Events in quadrant C | 3,530,946 | 662,873 |
| Events in quadrant D | 4,483,315 | 633,152 |
| Mode M9 | |||
|---|---|---|---|
| Quadrant | BADHDUFLAG | Total packets | Discarded packets |
| A | 0 | 10 | 0 |
| B | 0 | 11 | 0 |
| C | 0 | 11 | 0 |
| D | 0 | 11 | 0 |
| Mode SS | |||
|---|---|---|---|
| Quadrant | BADHDUFLAG | Total packets | Discarded packets |
| A | 0 | 134 | 0 |
| B | 0 | 134 | 0 |
| C | 0 | 134 | 0 |
| D | 0 | 134 | 0 |
| Mode M0 | |||
|---|---|---|---|
| Quadrant | BADHDUFLAG | Total packets | Discarded packets |
| A | 0 | 14018 | 2 |
| B | 0 | 14214 | 2 |
| C | 0 | 14627 | 2 |
| D | 0 | 17724 | 2 |
| Quadrant | Total seconds | Saturated seconds | Saturation percentage |
|---|---|---|---|
| A | 6635 | 56 | 0.844009% |
| B | 6635 | 73 | 1.100226% |
| C | 6635 | 100 | 1.507159% |
| D | 6635 | 250 | 3.767898% |
Noise dominated data is calculated using 1-second bins in cleaned event files. If a bin has >2000 counts, and if more than 50% of those come from <1% of pixels, then it is considered to be noise-dominated and hence unusable.
| Quadrant | # 1 sec bins | Bins with >0 counts | Bins with >2000 counts | High rate bins dominated by noise | Noise dominated (total time) | Noise dominated (detector-on time) | Marked lightcurve |
|---|---|---|---|---|---|---|---|
| A | 7595 | 6636 | 5 | 5 | 0.07% | 0.08% | 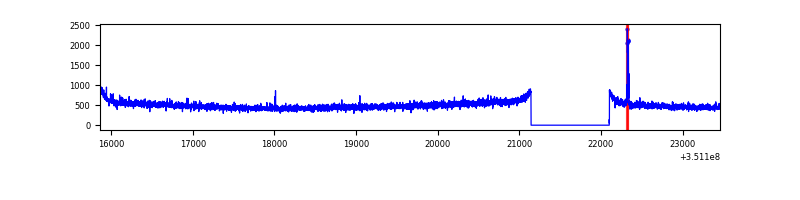 |
| B | 7595 | 6636 | 0 | 0 | 0.00% | 0.00% | 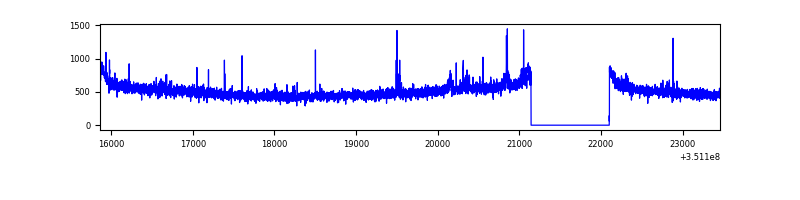 |
| C | 7595 | 6636 | 1 | 1 | 0.01% | 0.02% | 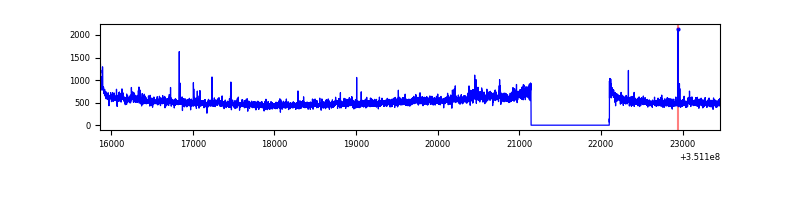 |
| D | 7595 | 6636 | 222 | 222 | 2.92% | 3.35% | 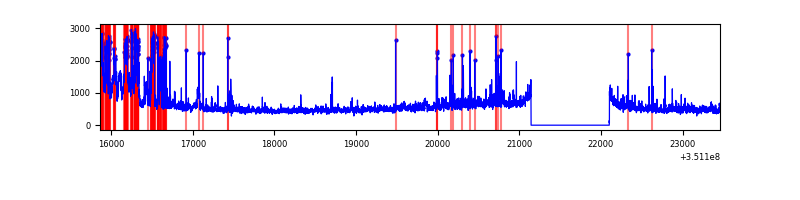 |
Top three noisy pixels from each quadrant. If the there are fewer than three noisy pixels in the level2.evt file, extra rows are filled as -1
| Pixel properties | Quadrant properties | ||||||
|---|---|---|---|---|---|---|---|
| Quadrant | DetID | PixID | Counts | Sigma | Mean | Median | Sigma |
| A | 15 | 174 | 27632 | 158.43 | 847 | 832 | 169.2 |
| A | 13 | 254 | 10973 | 59.95 | 847 | 832 | 169.2 |
| A | 13 | 6 | 8680 | 46.39 | 847 | 832 | 169.2 |
| B | 10 | 245 | 20397 | 120.83 | 847 | 826 | 162.0 |
| B | 12 | 111 | 20169 | 119.42 | 847 | 826 | 162.0 |
| B | 11 | 111 | 17880 | 105.29 | 847 | 826 | 162.0 |
| C | 3 | 233 | 196181 | 1021.68 | 813 | 821 | 191.2 |
| C | 14 | 238 | 130337 | 677.33 | 813 | 821 | 191.2 |
| C | 2 | 16 | 20456 | 102.68 | 813 | 821 | 191.2 |
| D | 8 | 195 | 793178 | 4139.19 | 799 | 779 | 191.4 |
| D | 1 | 52 | 573192 | 2990.07 | 799 | 779 | 191.4 |
| D | 13 | 104 | 32229 | 164.28 | 799 | 779 | 191.4 |
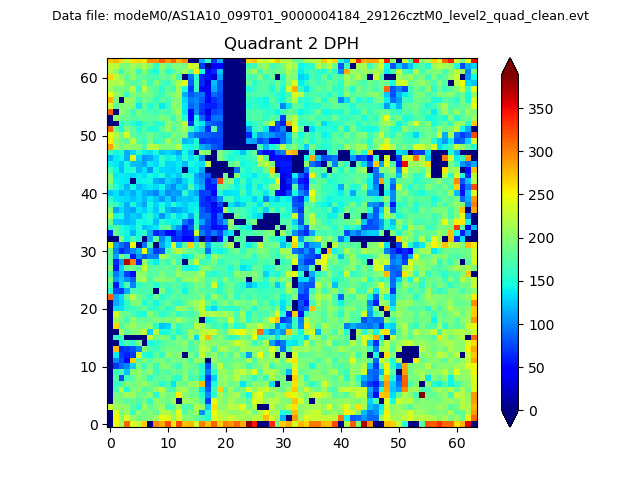
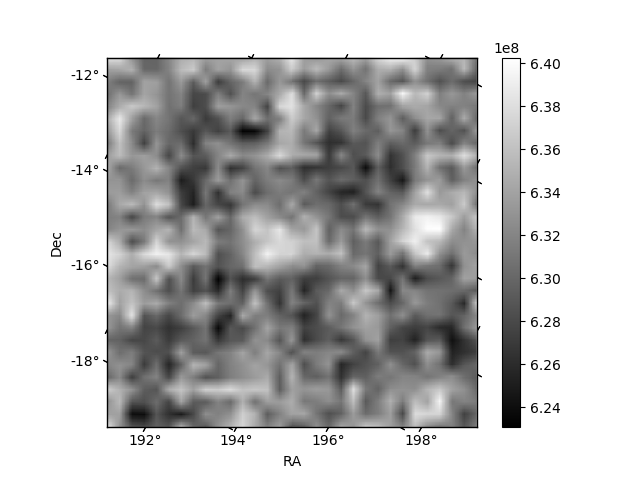
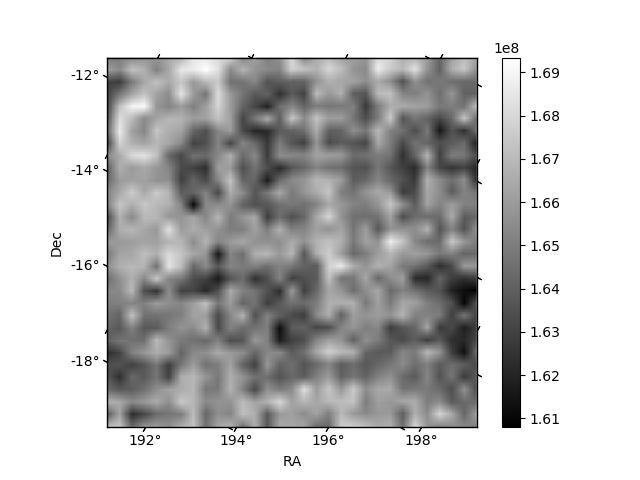
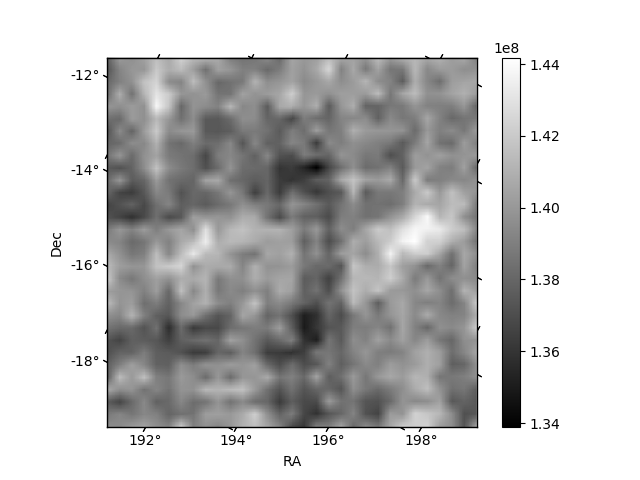
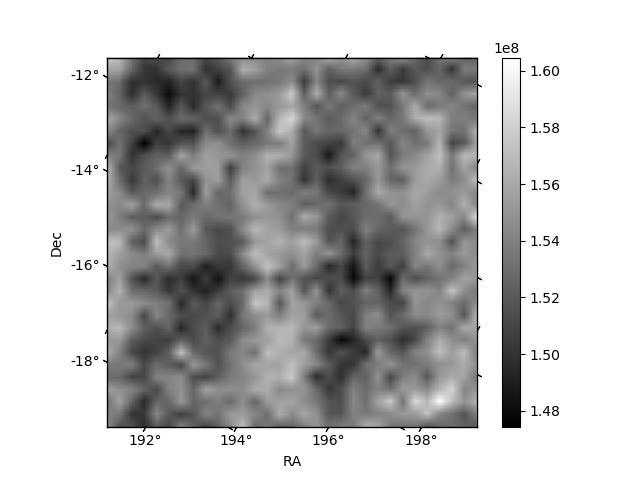
Histogram calculated using DETX and DETY for each event in the final _common_clean file
| Quadrant A | 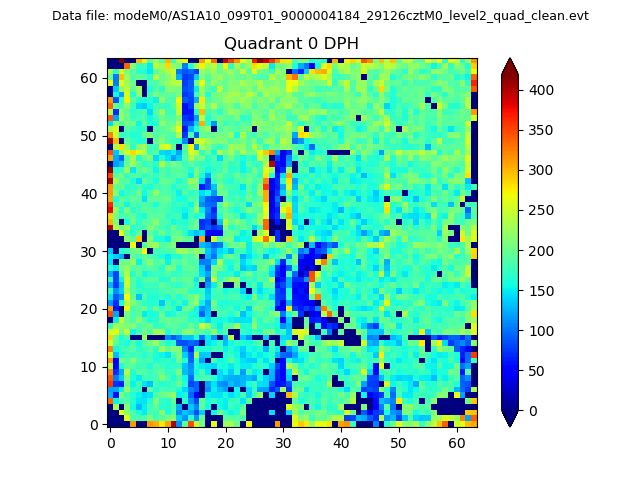 |
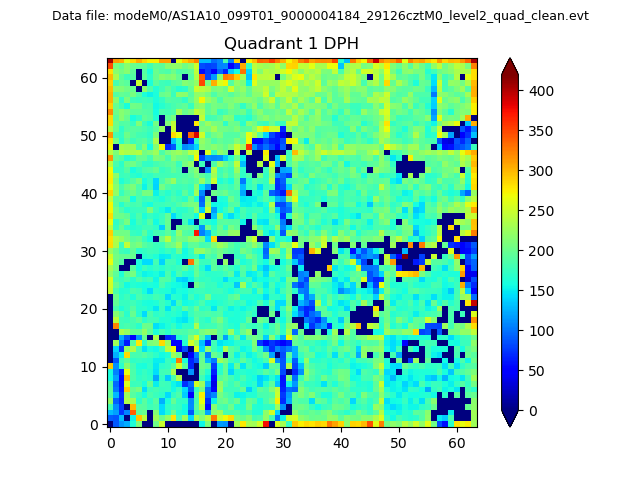 |
Quadrant B |
|---|---|---|---|
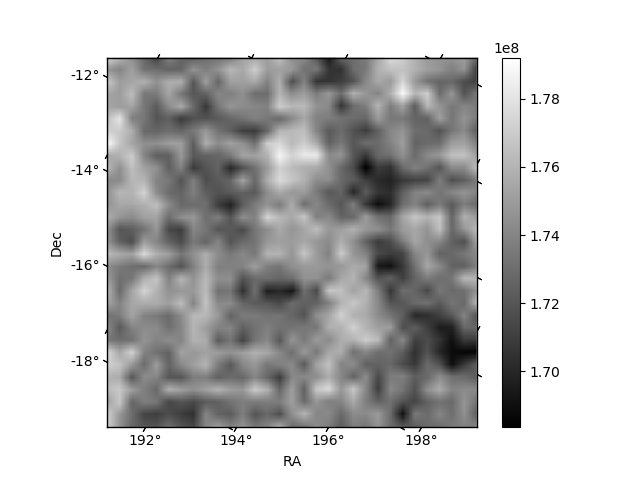
| Quadrant D | 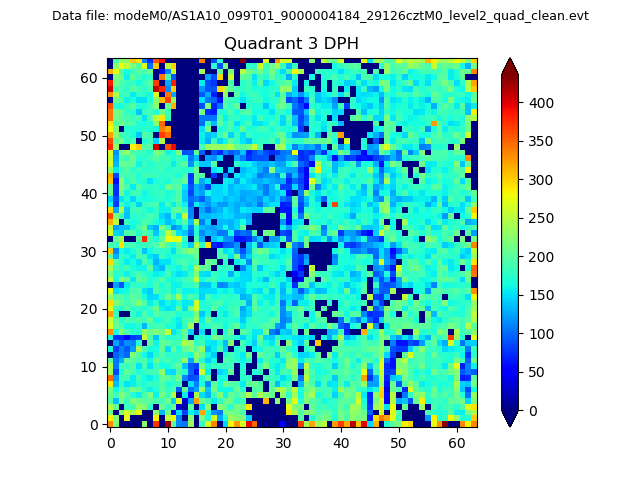 |
 |
Quadrant C |
| Plot type | Count rate plots | Images |
|---|---|---|
| Comparison with Poisson distribution Blue bars denote a histogram of data divided into 1 sec bins. Red curve is a Poisson curve with rate = median count rate of data. |
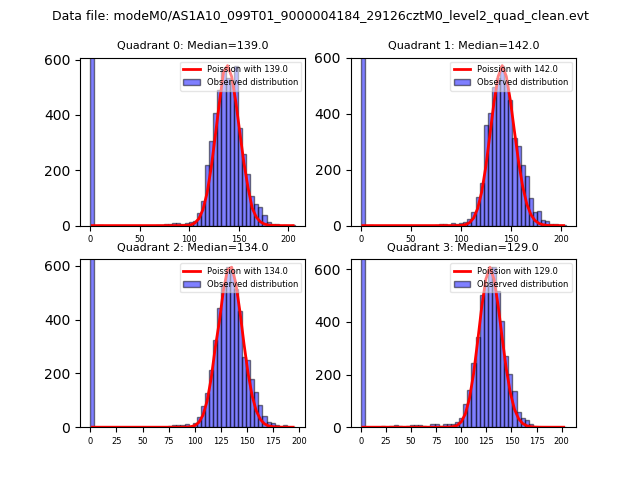 |
 |
| Quadrant-wise count rates Data is divided into 100 sec bins |
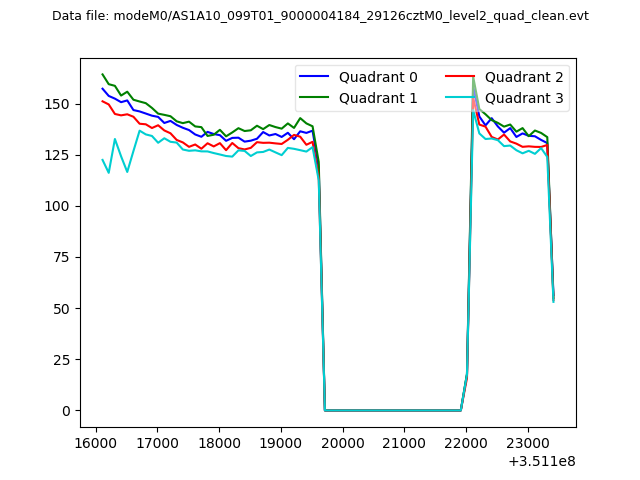 |
|
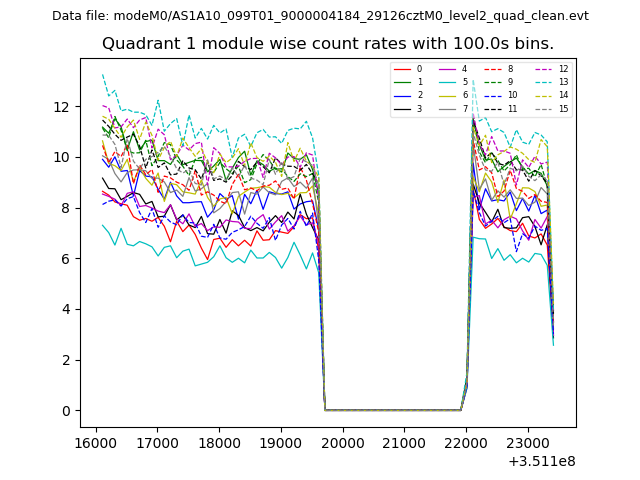
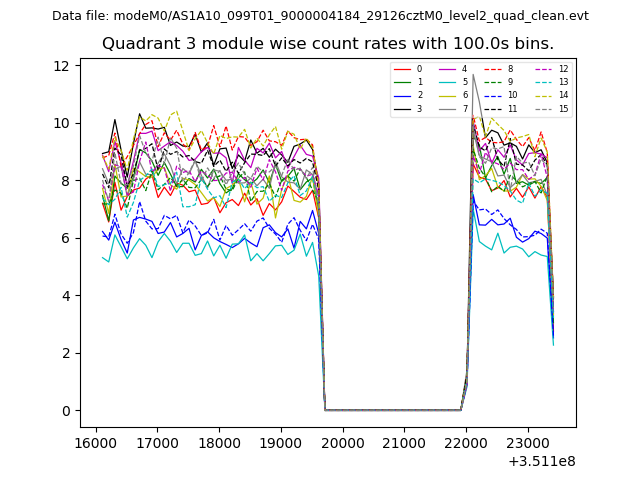
| Module-wise count rates for Quadrant A Data is divided into 100 sec bins |
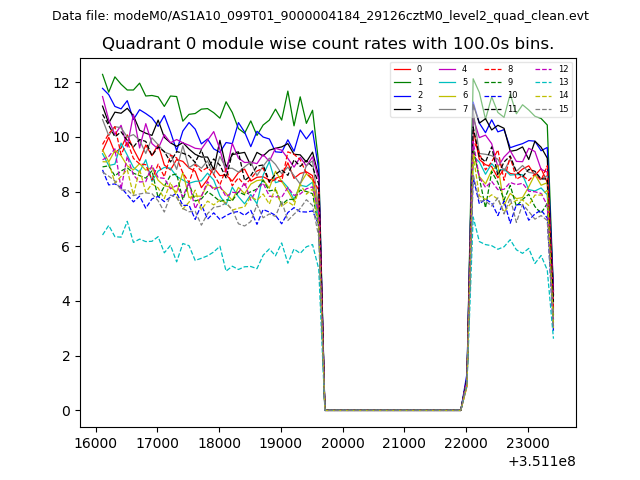 |
 |
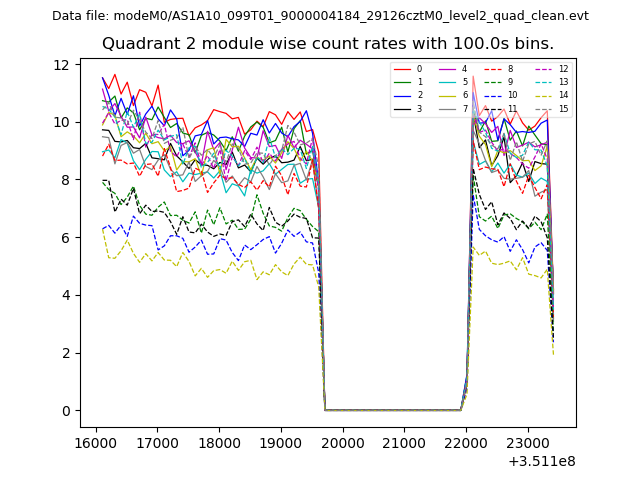
| Module-wise count rates for Quadrant B Data is divided into 100 sec bins |
 |
 |
| Module-wise count rates for Quadrant C Data is divided into 100 sec bins |
 |
 |
| Module-wise count rates for Quadrant D Data is divided into 100 sec bins |
 |
 |
| Parameter | Plot |
|---|---|
| CZT HV Monitor | 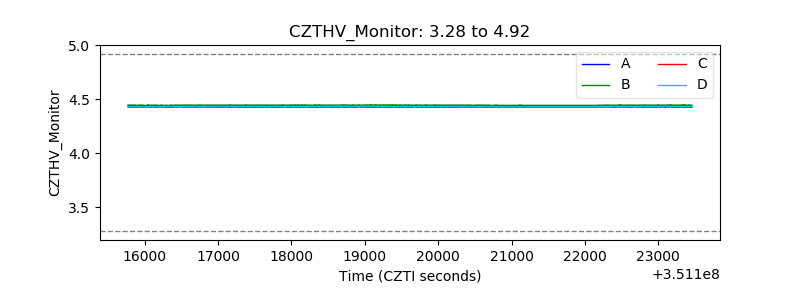 |
| D_VDD | 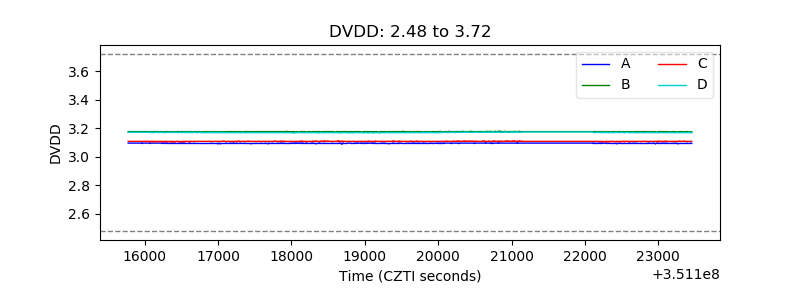 |
| Temperature 1 | 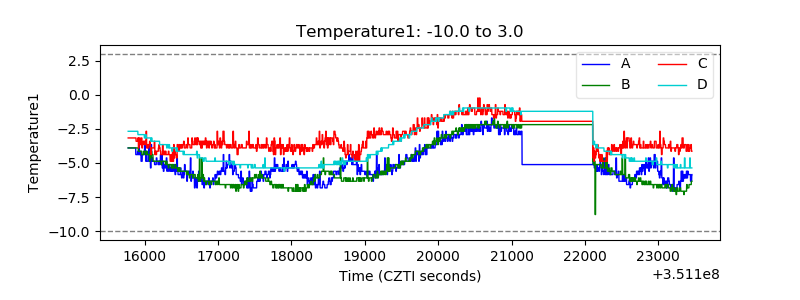 |
| Veto HV Monitor |  |
| Veto LLD | 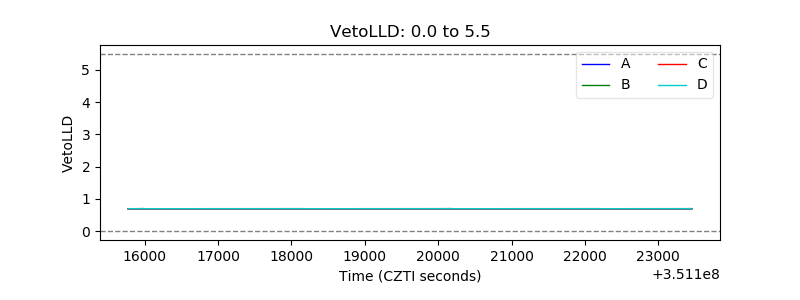 |
| Alpha Counter | 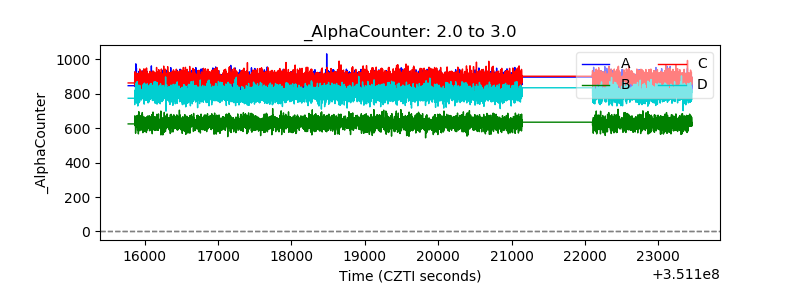 |
| _CPM_Rate | 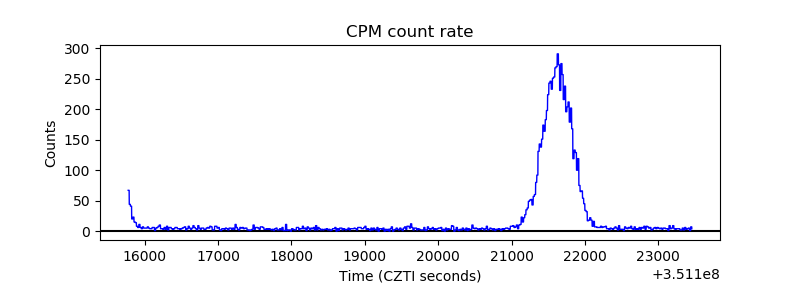 |
| CZT Counter |  |
| +2.5 Volts monitor |  |
| +5 Volts monitor |  |
| _ROLL_ROT | 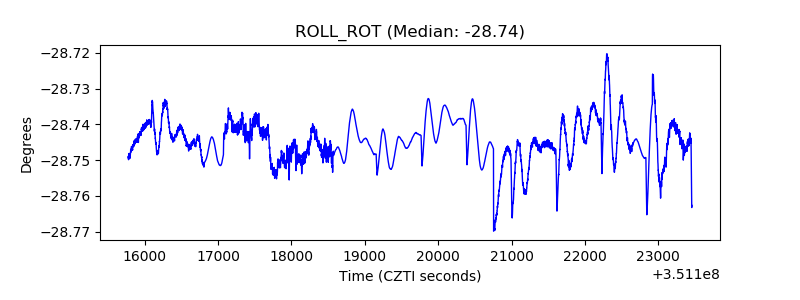 |
| _Roll_DEC | 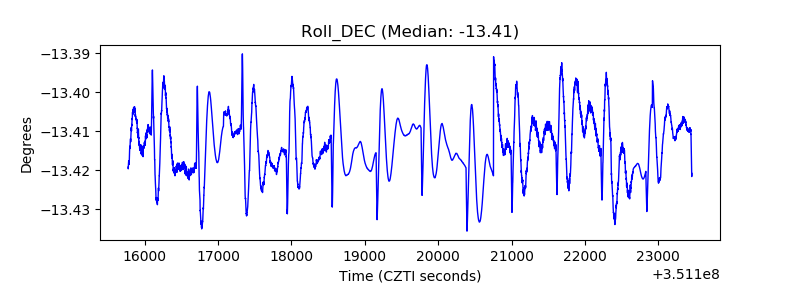 |
| _Roll_RA | 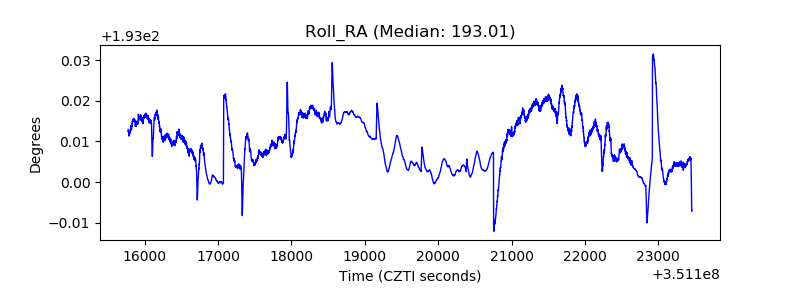 |
| Veto Counter | 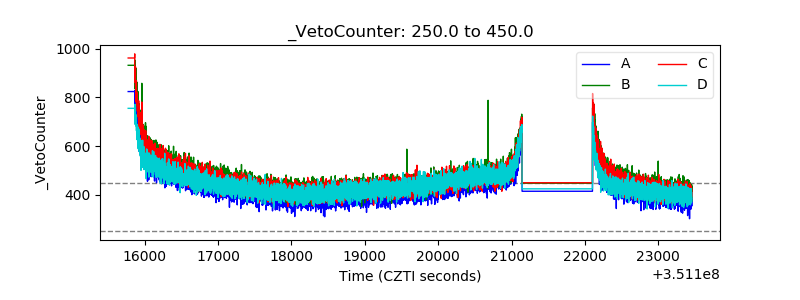 |