| Param | Original file | Final file |
|---|---|---|
| Filename | modeM0/AS1A10_099T01_9000004184_29127cztM0_level2.evt | modeM0/AS1A10_099T01_9000004184_29127cztM0_level2_quad_clean.evt |
| Size (bytes) | 532,509,120 | 106,488,000 |
| Size | 507.8 MB | 101.6 MB |
| Events in quadrant A | 3,598,193 | 689,575 |
| Events in quadrant B | 3,785,347 | 702,543 |
| Events in quadrant C | 3,705,096 | 668,387 |
| Events in quadrant D | 4,530,088 | 643,310 |
| Mode M9 | |||
|---|---|---|---|
| Quadrant | BADHDUFLAG | Total packets | Discarded packets |
| A | 0 | 7 | 0 |
| B | 0 | 8 | 0 |
| C | 0 | 8 | 0 |
| D | 0 | 8 | 0 |
| Mode SS | |||
|---|---|---|---|
| Quadrant | BADHDUFLAG | Total packets | Discarded packets |
| A | 0 | 152 | 0 |
| B | 0 | 152 | 0 |
| C | 0 | 152 | 0 |
| D | 0 | 152 | 0 |
| Mode M0 | |||
|---|---|---|---|
| Quadrant | BADHDUFLAG | Total packets | Discarded packets |
| A | 0 | 15591 | 3 |
| B | 0 | 16094 | 2 |
| C | 0 | 15602 | 2 |
| D | 0 | 18506 | 2 |
| Quadrant | Total seconds | Saturated seconds | Saturation percentage |
|---|---|---|---|
| A | 7489 | 34 | 0.453999% |
| B | 7489 | 65 | 0.867940% |
| C | 7489 | 68 | 0.907998% |
| D | 7489 | 215 | 2.870877% |
Noise dominated data is calculated using 1-second bins in cleaned event files. If a bin has >2000 counts, and if more than 50% of those come from <1% of pixels, then it is considered to be noise-dominated and hence unusable.
| Quadrant | # 1 sec bins | Bins with >0 counts | Bins with >2000 counts | High rate bins dominated by noise | Noise dominated (total time) | Noise dominated (detector-on time) | Marked lightcurve |
|---|---|---|---|---|---|---|---|
| A | 8029 | 7490 | 5 | 5 | 0.06% | 0.07% | 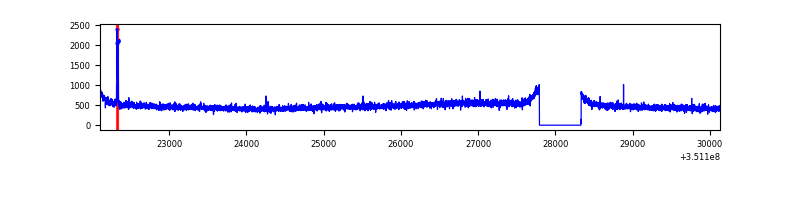 |
| B | 8029 | 7490 | 5 | 5 | 0.06% | 0.07% | 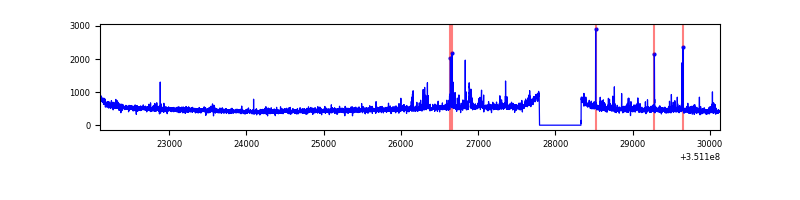 |
| C | 8029 | 7490 | 1 | 1 | 0.01% | 0.01% | 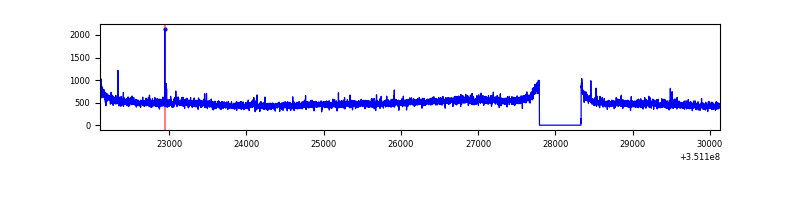 |
| D | 8029 | 7490 | 205 | 205 | 2.55% | 2.74% | 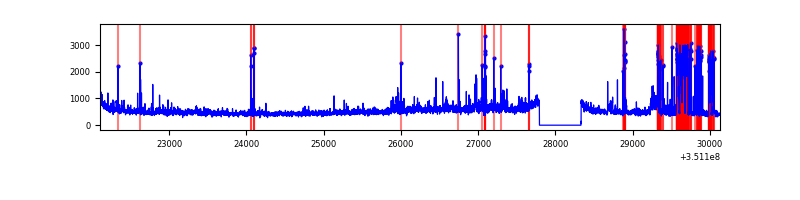 |
Top three noisy pixels from each quadrant. If the there are fewer than three noisy pixels in the level2.evt file, extra rows are filled as -1
| Pixel properties | Quadrant properties | ||||||
|---|---|---|---|---|---|---|---|
| Quadrant | DetID | PixID | Counts | Sigma | Mean | Median | Sigma |
| A | 15 | 174 | 31064 | 161.88 | 924 | 906 | 186.3 |
| A | 13 | 254 | 11708 | 57.98 | 924 | 906 | 186.3 |
| A | 3 | 137 | 9195 | 44.49 | 924 | 906 | 186.3 |
| B | 10 | 246 | 68030 | 376.2 | 922 | 899 | 178.4 |
| B | 10 | 245 | 44981 | 247.03 | 922 | 899 | 178.4 |
| B | 0 | 190 | 27319 | 148.06 | 922 | 899 | 178.4 |
| C | 14 | 238 | 146109 | 694.0 | 887 | 896 | 209.2 |
| C | 3 | 233 | 72615 | 342.76 | 887 | 896 | 209.2 |
| C | 2 | 114 | 17625 | 79.95 | 887 | 896 | 209.2 |
| D | 1 | 52 | 675200 | 3176.31 | 882 | 860 | 212.3 |
| D | 8 | 195 | 429004 | 2016.66 | 882 | 860 | 212.3 |
| D | 2 | 120 | 48513 | 224.46 | 882 | 860 | 212.3 |
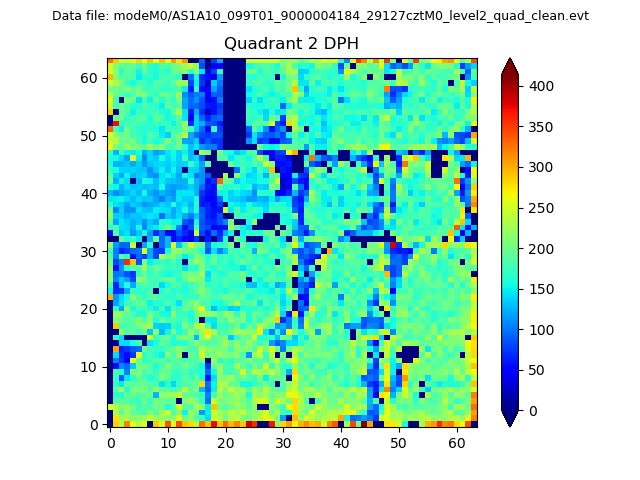
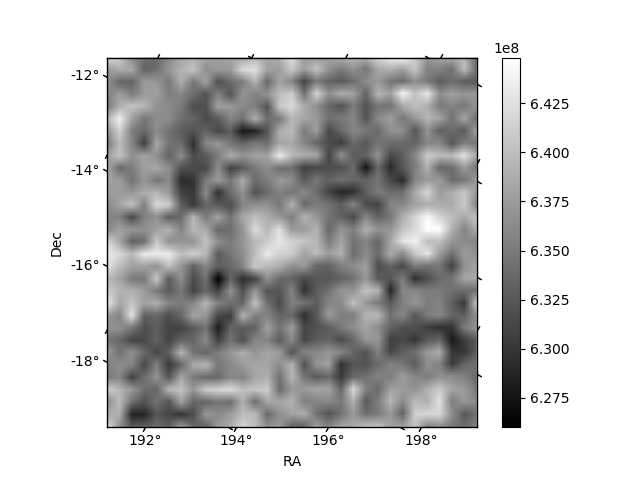
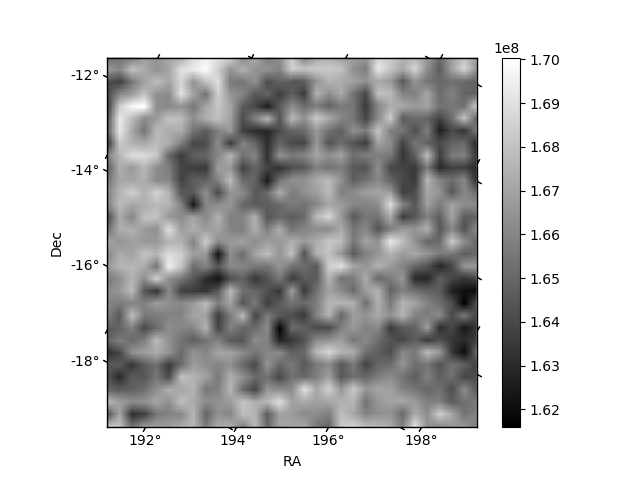
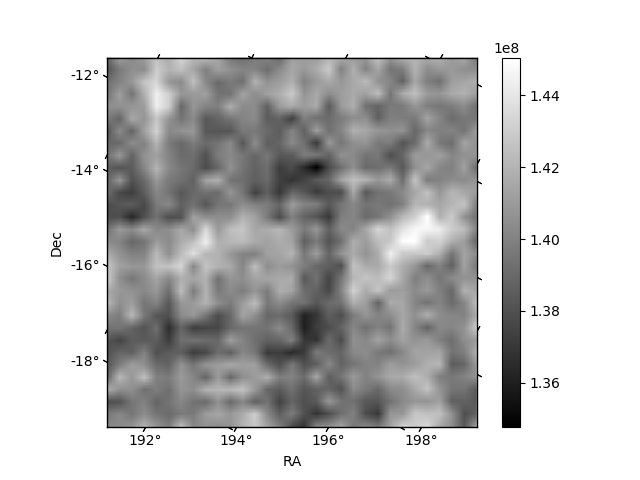
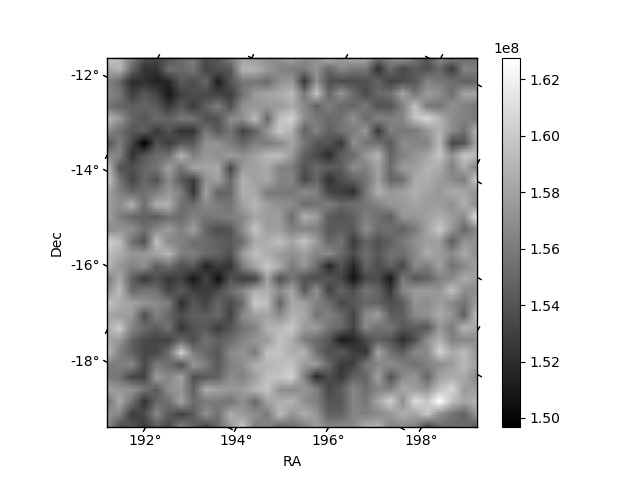
Histogram calculated using DETX and DETY for each event in the final _common_clean file
| Quadrant A | 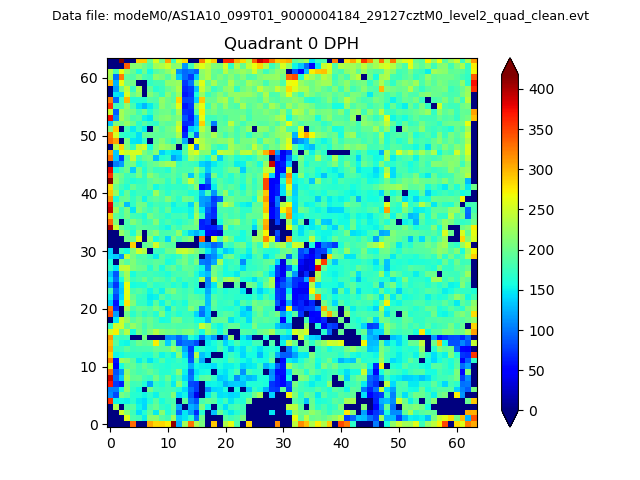 |
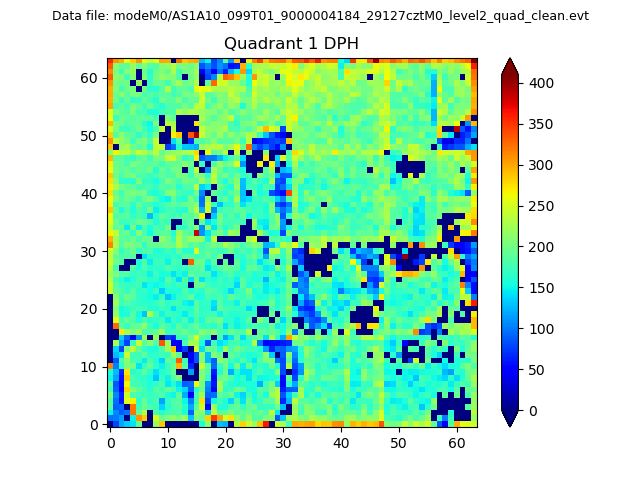 |
Quadrant B |
|---|---|---|---|
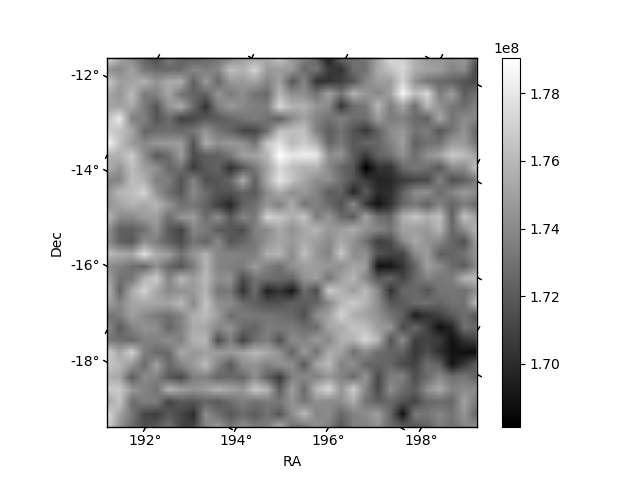
| Quadrant D | 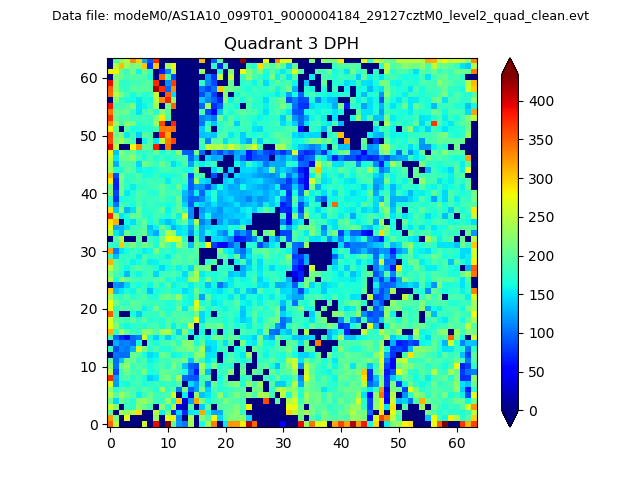 |
 |
Quadrant C |
| Plot type | Count rate plots | Images |
|---|---|---|
| Comparison with Poisson distribution Blue bars denote a histogram of data divided into 1 sec bins. Red curve is a Poisson curve with rate = median count rate of data. |
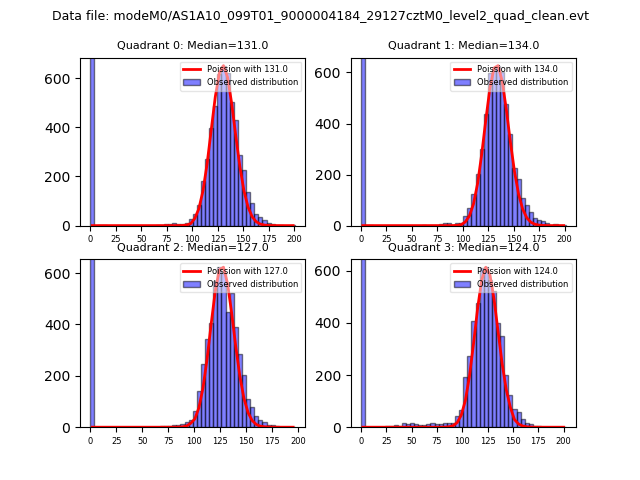 |
 |
| Quadrant-wise count rates Data is divided into 100 sec bins |
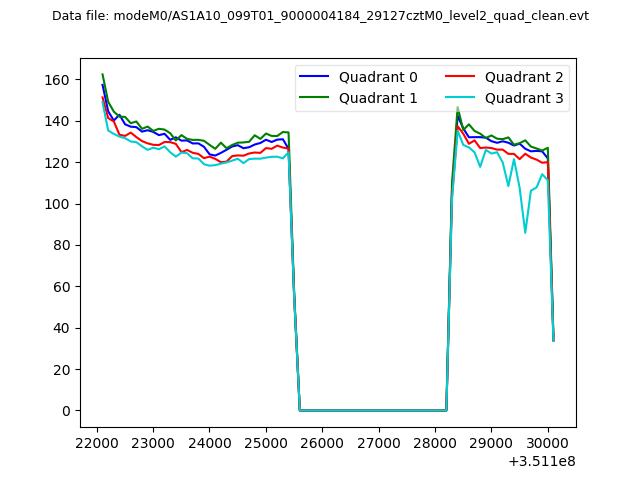 |
|
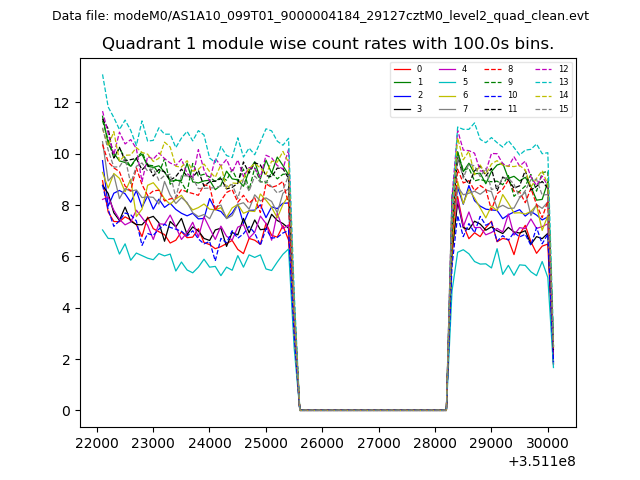
| Module-wise count rates for Quadrant A Data is divided into 100 sec bins |
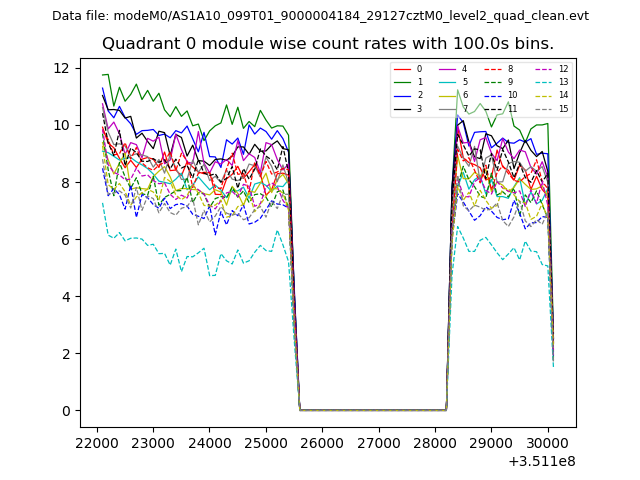 |
 |
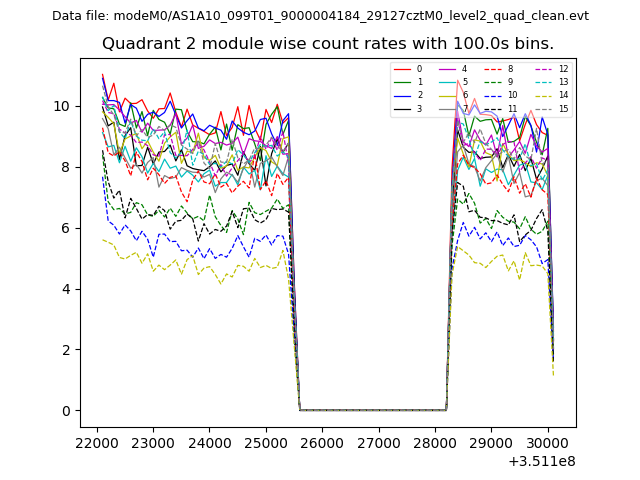
| Module-wise count rates for Quadrant B Data is divided into 100 sec bins |
 |
 |
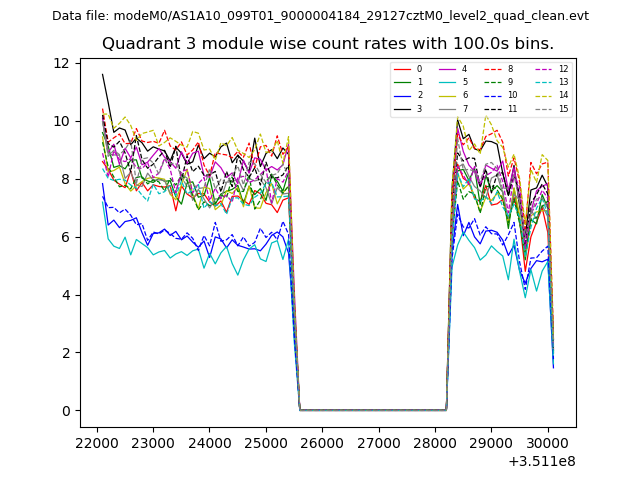
| Module-wise count rates for Quadrant C Data is divided into 100 sec bins |
 |
 |
| Module-wise count rates for Quadrant D Data is divided into 100 sec bins |
 |
 |
| Parameter | Plot |
|---|---|
| CZT HV Monitor | 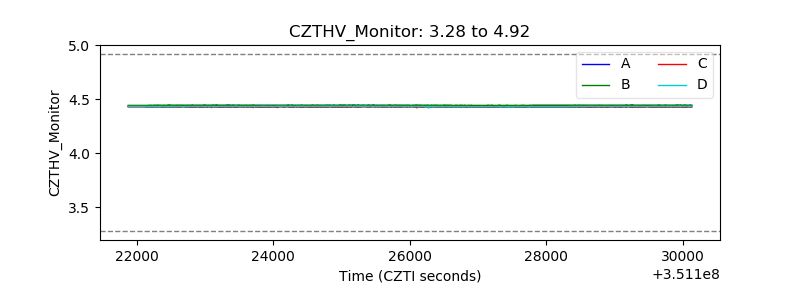 |
| D_VDD | 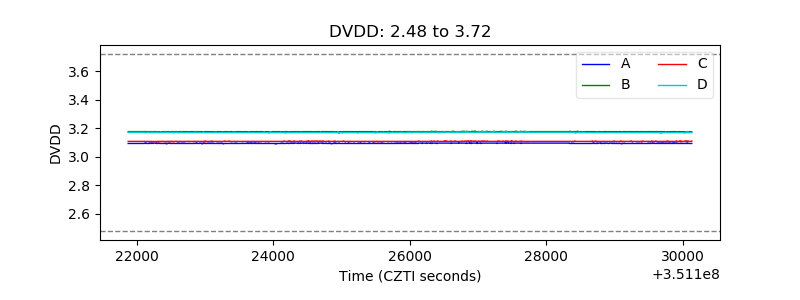 |
| Temperature 1 | 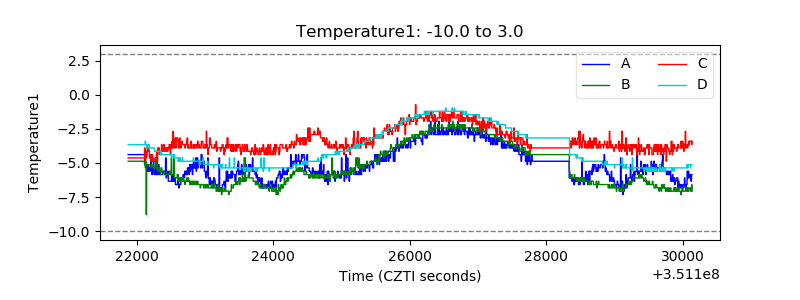 |
| Veto HV Monitor |  |
| Veto LLD | 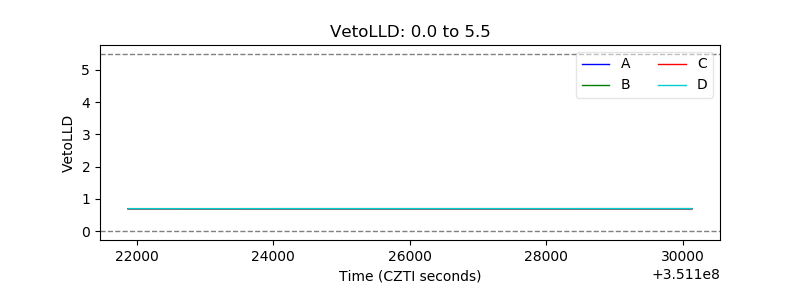 |
| Alpha Counter | 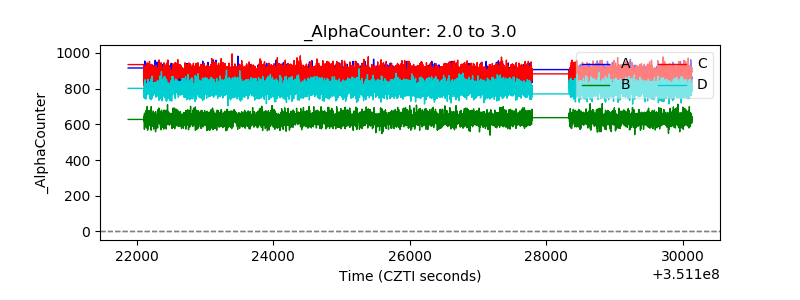 |
| _CPM_Rate | 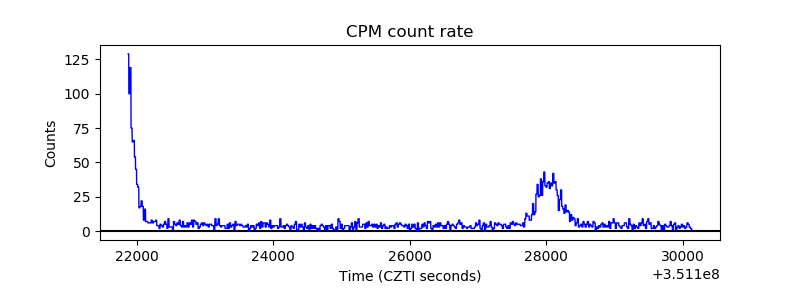 |
| CZT Counter | 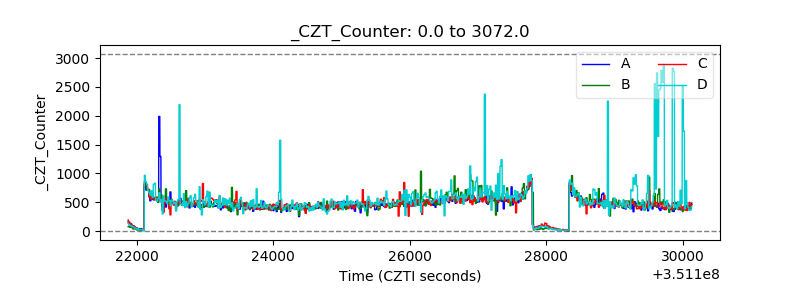 |
| +2.5 Volts monitor |  |
| +5 Volts monitor |  |
| _ROLL_ROT | 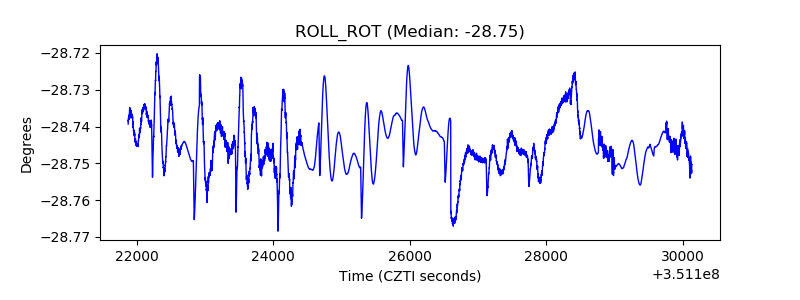 |
| _Roll_DEC | 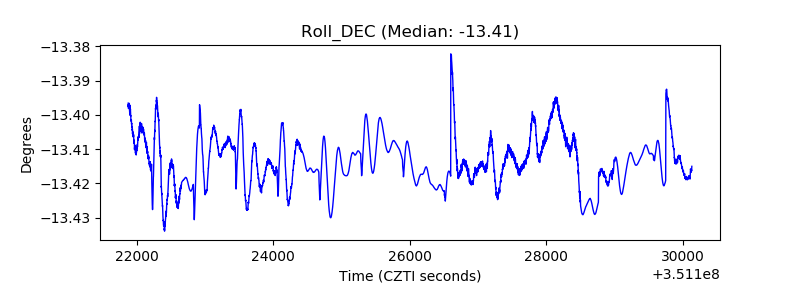 |
| _Roll_RA | 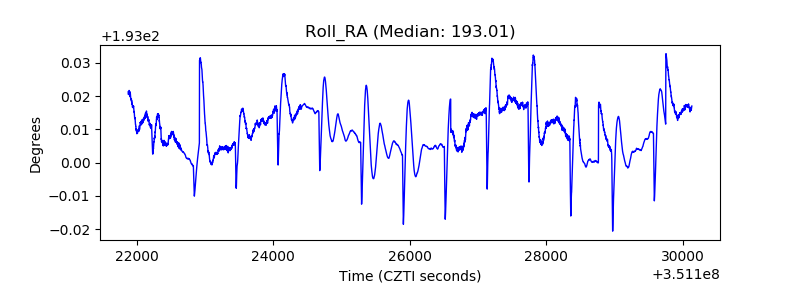 |
| Veto Counter | 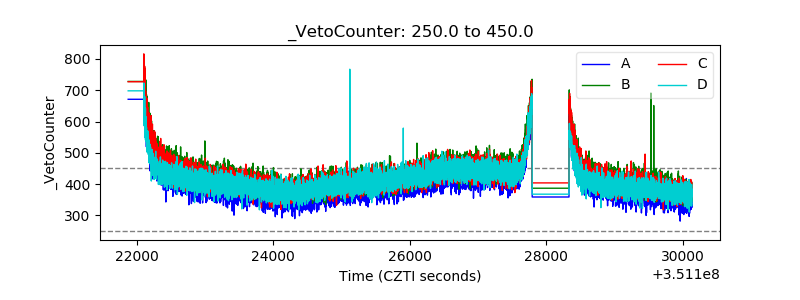 |