| Param | Original file | Final file |
|---|---|---|
| Filename | modeM0/AS1A10_099T01_9000004184_29128cztM0_level2.evt | modeM0/AS1A10_099T01_9000004184_29128cztM0_level2_quad_clean.evt |
| Size (bytes) | 655,856,640 | 113,656,320 |
| Size | 625.5 MB | 108.4 MB |
| Events in quadrant A | 3,984,303 | 745,895 |
| Events in quadrant B | 4,510,213 | 746,962 |
| Events in quadrant C | 3,962,054 | 724,884 |
| Events in quadrant D | 6,863,988 | 667,925 |
| Mode M9 | |||
|---|---|---|---|
| Quadrant | BADHDUFLAG | Total packets | Discarded packets |
| A | 0 | 1 | 0 |
| B | 0 | 2 | 0 |
| C | 0 | 2 | 0 |
| D | 0 | 2 | 0 |
| Mode SS | |||
|---|---|---|---|
| Quadrant | BADHDUFLAG | Total packets | Discarded packets |
| A | 0 | 160 | 0 |
| B | 0 | 160 | 0 |
| C | 0 | 160 | 0 |
| D | 0 | 160 | 0 |
| Mode M0 | |||
|---|---|---|---|
| Quadrant | BADHDUFLAG | Total packets | Discarded packets |
| A | 0 | 17141 | 3 |
| B | 0 | 18555 | 3 |
| C | 0 | 16768 | 3 |
| D | 0 | 25795 | 3 |
| Quadrant | Total seconds | Saturated seconds | Saturation percentage |
|---|---|---|---|
| A | 8000 | 129 | 1.612500% |
| B | 8000 | 343 | 4.287500% |
| C | 8000 | 183 | 2.287500% |
| D | 8000 | 960 | 12.000000% |
Noise dominated data is calculated using 1-second bins in cleaned event files. If a bin has >2000 counts, and if more than 50% of those come from <1% of pixels, then it is considered to be noise-dominated and hence unusable.
| Quadrant | # 1 sec bins | Bins with >0 counts | Bins with >2000 counts | High rate bins dominated by noise | Noise dominated (total time) | Noise dominated (detector-on time) | Marked lightcurve |
|---|---|---|---|---|---|---|---|
| A | 8035 | 8002 | 16 | 16 | 0.20% | 0.20% | 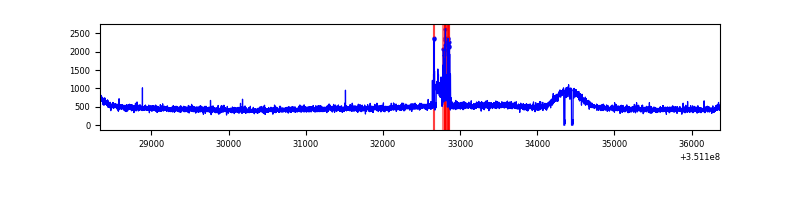 |
| B | 8035 | 8002 | 129 | 129 | 1.61% | 1.61% | 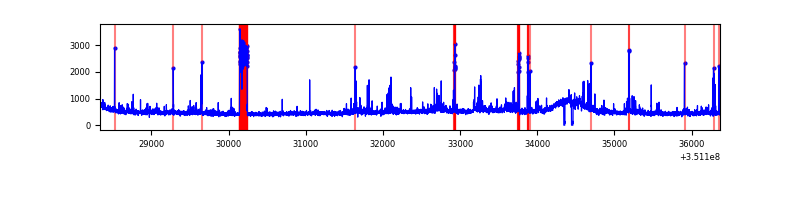 |
| C | 8035 | 8002 | 0 | 0 | 0.00% | 0.00% | 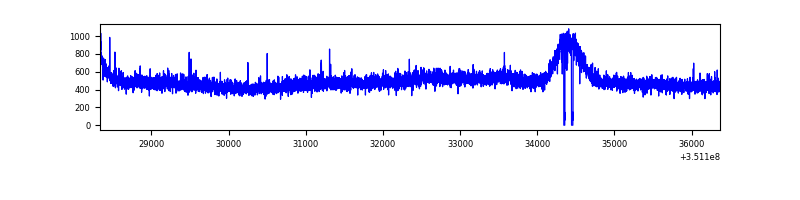 |
| D | 8035 | 8002 | 856 | 856 | 10.65% | 10.70% | 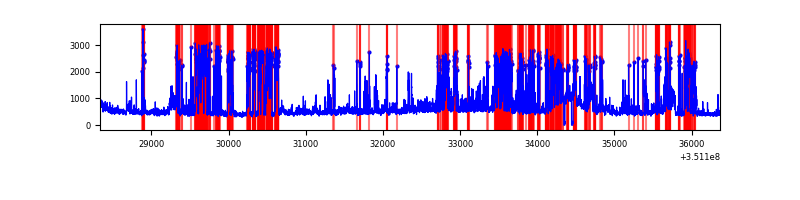 |
Top three noisy pixels from each quadrant. If the there are fewer than three noisy pixels in the level2.evt file, extra rows are filled as -1
| Pixel properties | Quadrant properties | ||||||
|---|---|---|---|---|---|---|---|
| Quadrant | DetID | PixID | Counts | Sigma | Mean | Median | Sigma |
| A | 15 | 174 | 141109 | 699.95 | 996 | 975 | 200.2 |
| A | 13 | 254 | 13109 | 60.61 | 996 | 975 | 200.2 |
| A | 3 | 137 | 10163 | 45.89 | 996 | 975 | 200.2 |
| B | 10 | 245 | 332066 | 1737.26 | 980 | 954 | 190.6 |
| B | 10 | 246 | 246505 | 1288.34 | 980 | 954 | 190.6 |
| B | 5 | 172 | 45909 | 235.87 | 980 | 954 | 190.6 |
| C | 14 | 238 | 157206 | 681.01 | 962 | 969 | 229.4 |
| C | 3 | 233 | 22142 | 92.29 | 962 | 969 | 229.4 |
| C | 2 | 114 | 19381 | 80.25 | 962 | 969 | 229.4 |
| D | 1 | 52 | 2881050 | 12989.51 | 926 | 901 | 221.7 |
| D | 8 | 195 | 393688 | 1771.47 | 926 | 901 | 221.7 |
| D | 2 | 120 | 43538 | 192.29 | 926 | 901 | 221.7 |
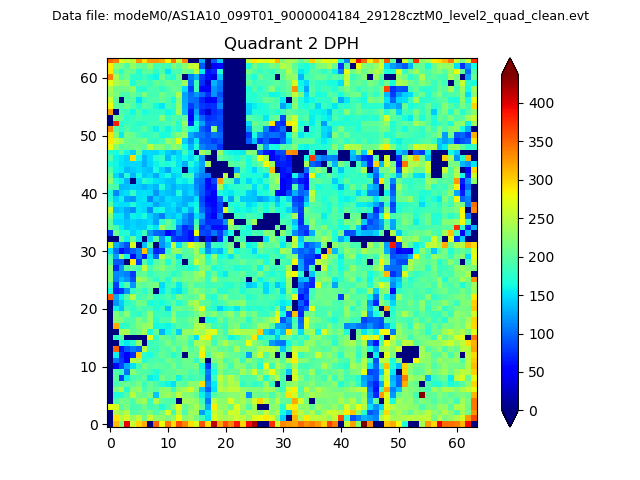
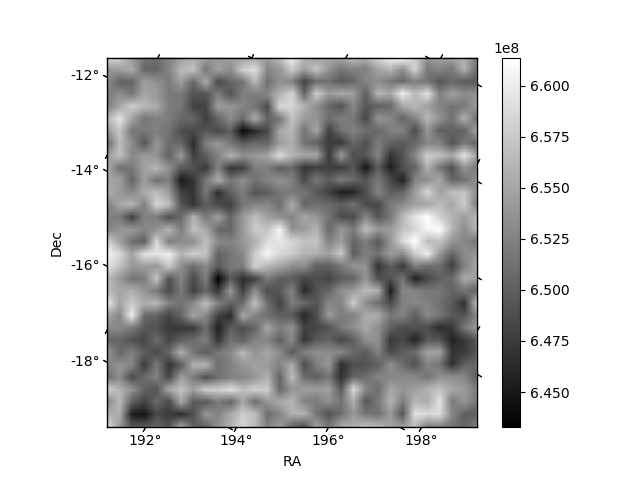
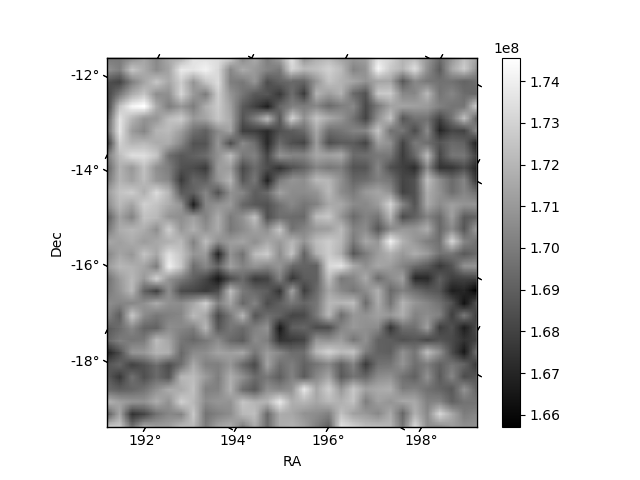
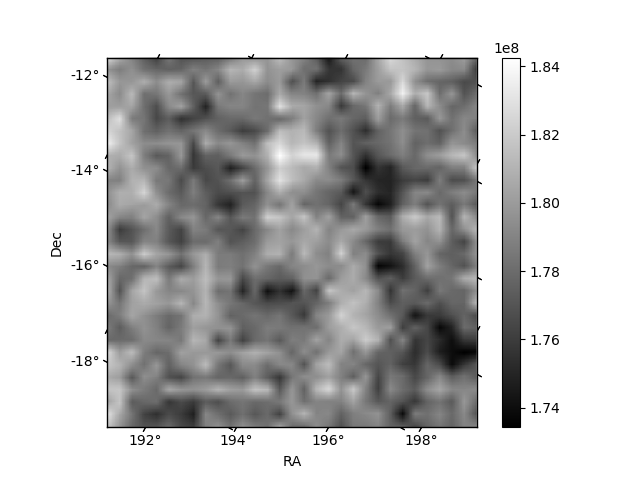
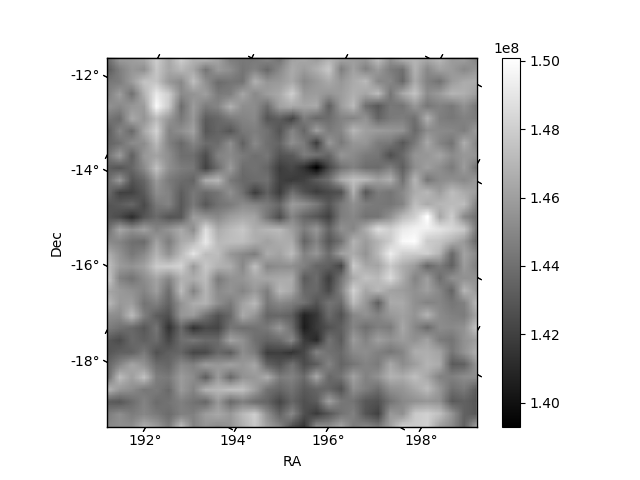
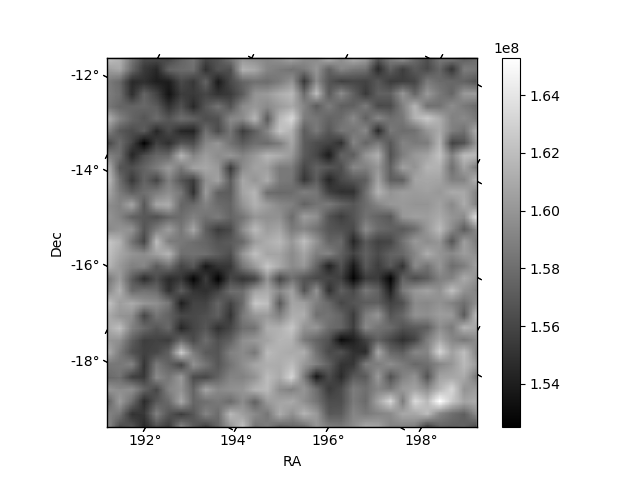
Histogram calculated using DETX and DETY for each event in the final _common_clean file
| Quadrant A | 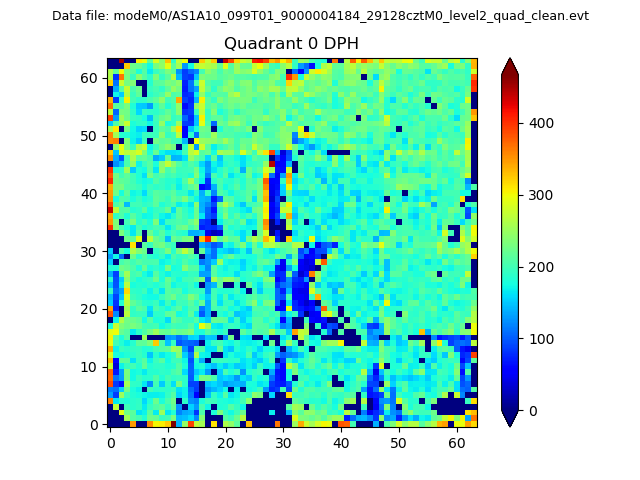 |
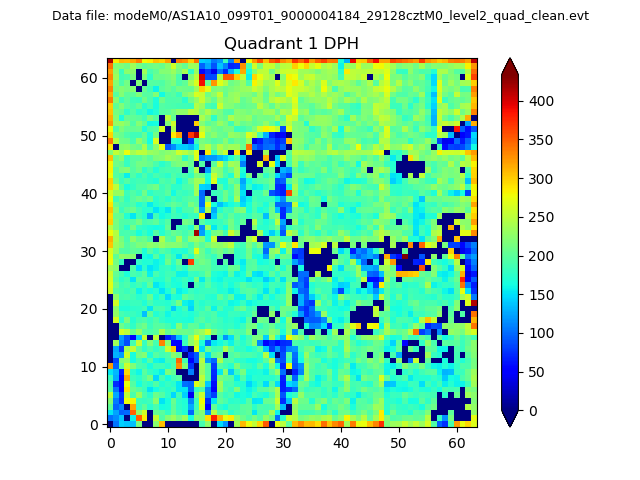 |
Quadrant B |
|---|---|---|---|
| Quadrant D | 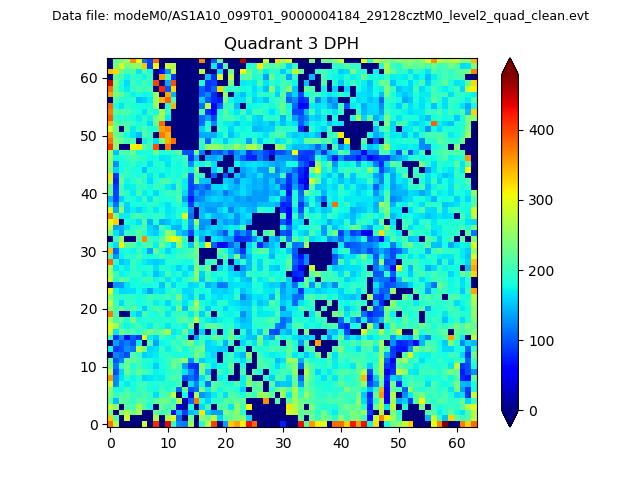 |
 |
Quadrant C |
| Plot type | Count rate plots | Images |
|---|---|---|
| Comparison with Poisson distribution Blue bars denote a histogram of data divided into 1 sec bins. Red curve is a Poisson curve with rate = median count rate of data. |
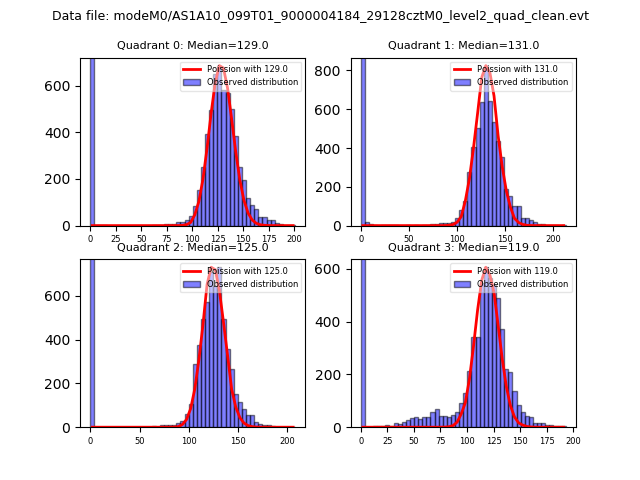 |
 |
| Quadrant-wise count rates Data is divided into 100 sec bins |
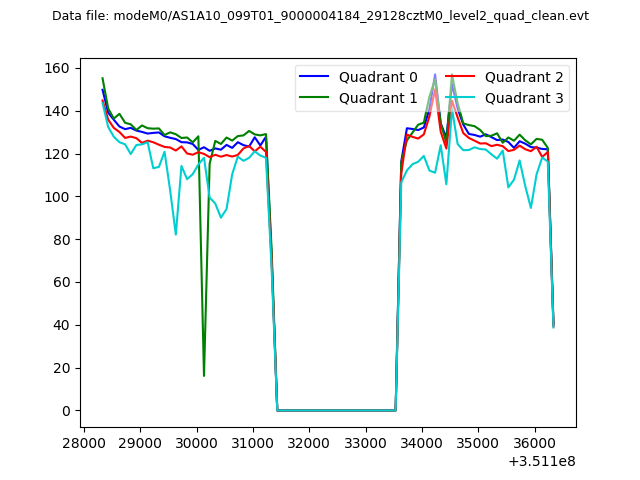 |
|
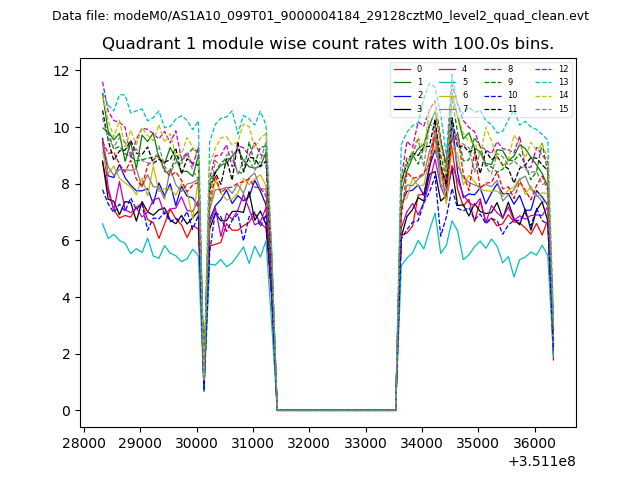
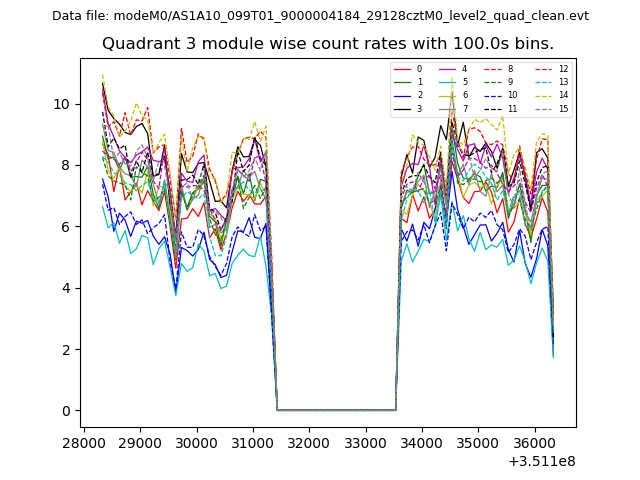
| Module-wise count rates for Quadrant A Data is divided into 100 sec bins |
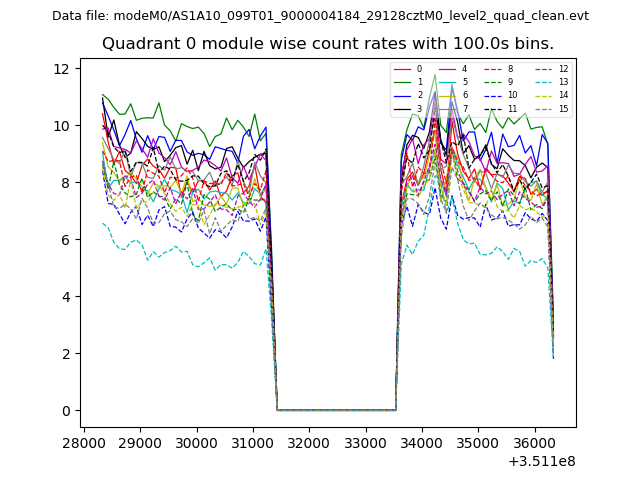 |
 |
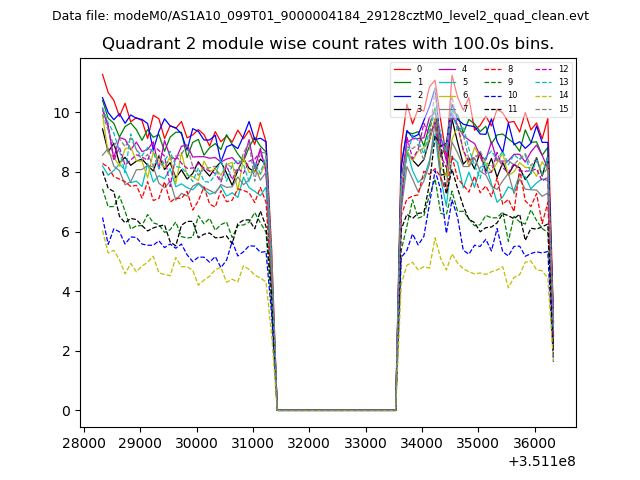
| Module-wise count rates for Quadrant B Data is divided into 100 sec bins |
 |
 |
| Module-wise count rates for Quadrant C Data is divided into 100 sec bins |
 |
 |
| Module-wise count rates for Quadrant D Data is divided into 100 sec bins |
 |
 |
| Parameter | Plot |
|---|---|
| CZT HV Monitor | 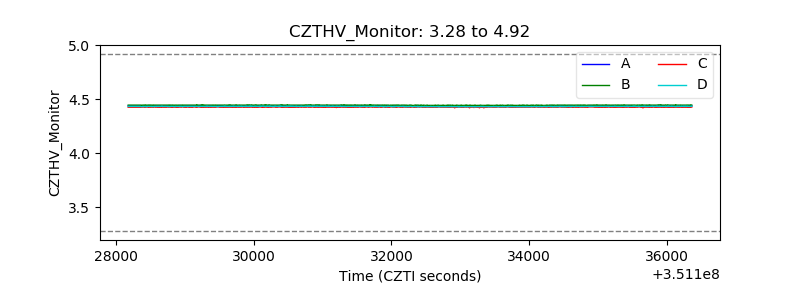 |
| D_VDD | 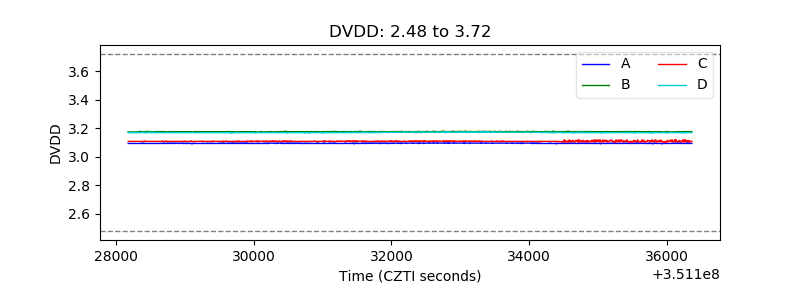 |
| Temperature 1 | 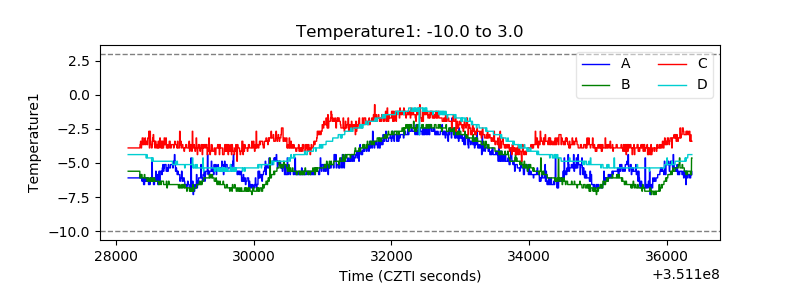 |
| Veto HV Monitor | 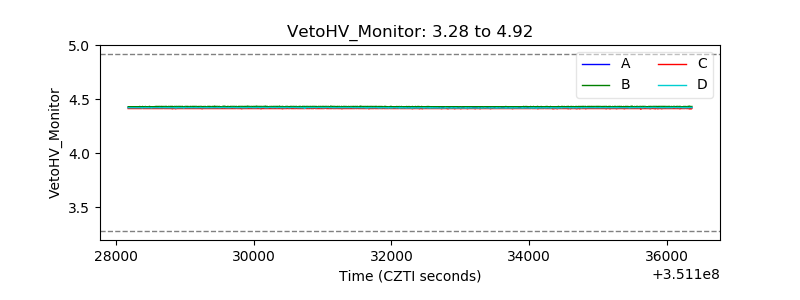 |
| Veto LLD | 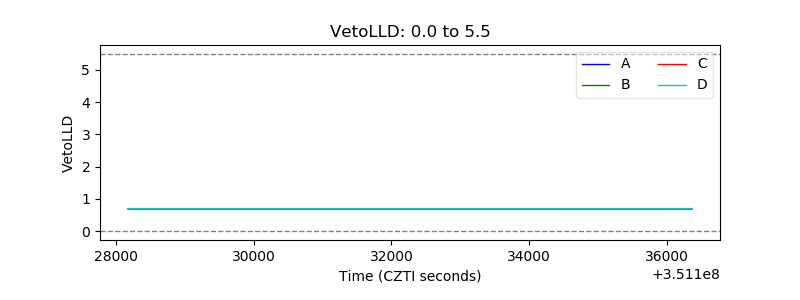 |
| Alpha Counter | 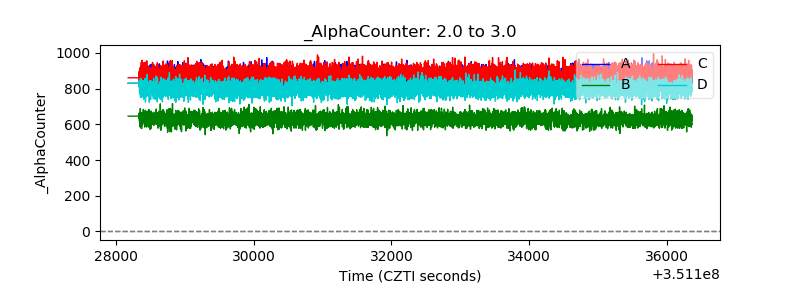 |
| _CPM_Rate |  |
| CZT Counter | 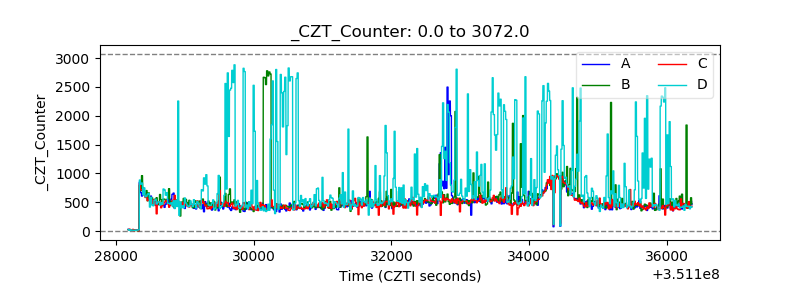 |
| +2.5 Volts monitor |  |
| +5 Volts monitor |  |
| _ROLL_ROT | 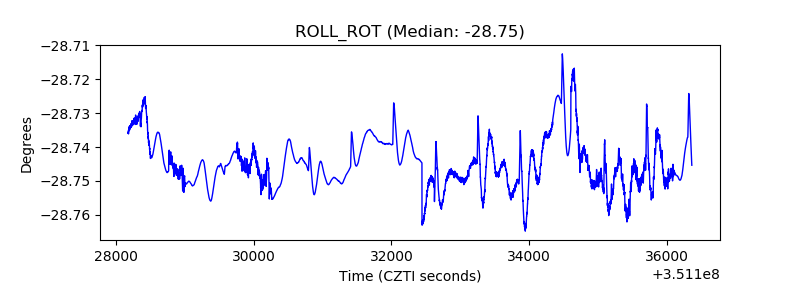 |
| _Roll_DEC | 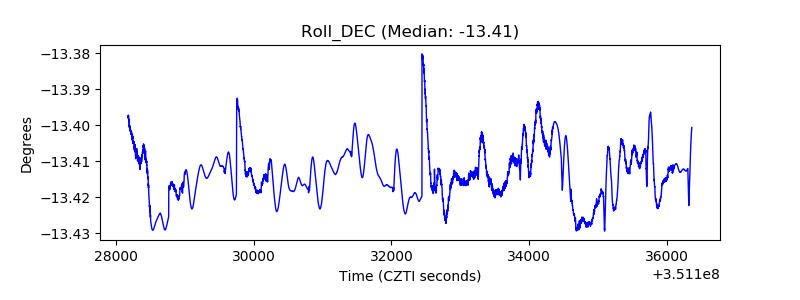 |
| _Roll_RA | 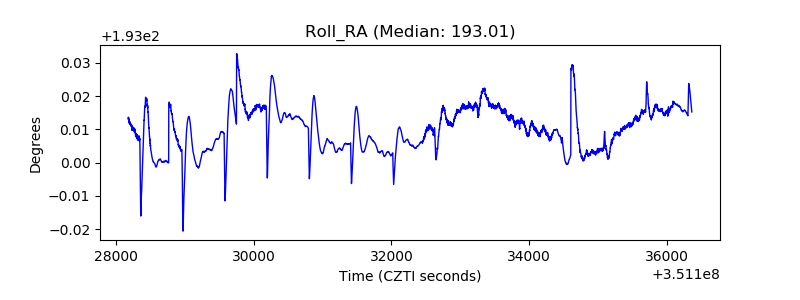 |
| Veto Counter | 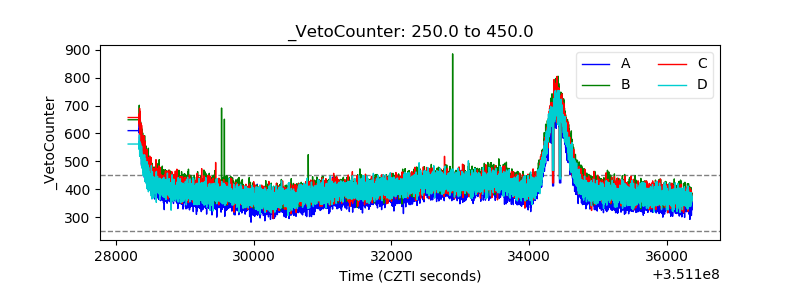 |