| Param | Original file | Final file |
|---|---|---|
| Filename | modeM0/AS1A10_099T01_9000004184_29129cztM0_level2.evt | modeM0/AS1A10_099T01_9000004184_29129cztM0_level2_quad_clean.evt |
| Size (bytes) | 609,281,280 | 118,105,920 |
| Size | 581.1 MB | 112.6 MB |
| Events in quadrant A | 3,980,913 | 765,369 |
| Events in quadrant B | 4,428,114 | 780,565 |
| Events in quadrant C | 4,116,386 | 747,389 |
| Events in quadrant D | 5,371,324 | 714,267 |
| Mode M9 | |||
|---|---|---|---|
| Quadrant | BADHDUFLAG | Total packets | Discarded packets |
| A | 0 | 1 | 0 |
| B | 0 | 1 | 0 |
| C | 0 | 1 | 0 |
| D | 0 | 1 | 0 |
| Mode SS | |||
|---|---|---|---|
| Quadrant | BADHDUFLAG | Total packets | Discarded packets |
| A | 0 | 168 | 0 |
| B | 0 | 168 | 0 |
| C | 0 | 168 | 0 |
| D | 0 | 168 | 0 |
| Mode M0 | |||
|---|---|---|---|
| Quadrant | BADHDUFLAG | Total packets | Discarded packets |
| A | 0 | 17182 | 3 |
| B | 0 | 18410 | 3 |
| C | 0 | 17353 | 3 |
| D | 0 | 21525 | 3 |
| Quadrant | Total seconds | Saturated seconds | Saturation percentage |
|---|---|---|---|
| A | 8179 | 210 | 2.567551% |
| B | 8179 | 377 | 4.609365% |
| C | 8179 | 335 | 4.095855% |
| D | 8180 | 458 | 5.599022% |
Noise dominated data is calculated using 1-second bins in cleaned event files. If a bin has >2000 counts, and if more than 50% of those come from <1% of pixels, then it is considered to be noise-dominated and hence unusable.
| Quadrant | # 1 sec bins | Bins with >0 counts | Bins with >2000 counts | High rate bins dominated by noise | Noise dominated (total time) | Noise dominated (detector-on time) | Marked lightcurve |
|---|---|---|---|---|---|---|---|
| A | 8339 | 8182 | 0 | 0 | 0.00% | 0.00% | 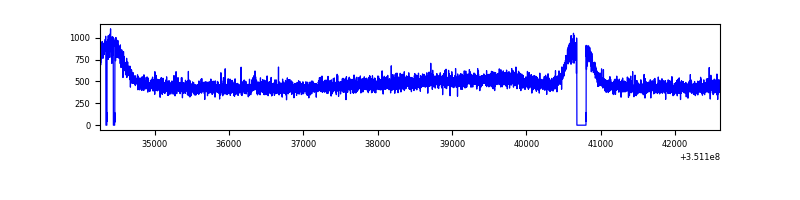 |
| B | 8339 | 8182 | 12 | 12 | 0.14% | 0.15% | 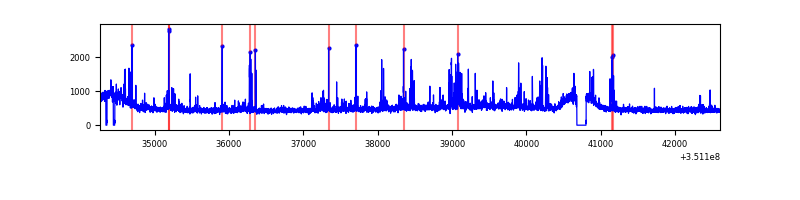 |
| C | 8339 | 8182 | 0 | 0 | 0.00% | 0.00% | 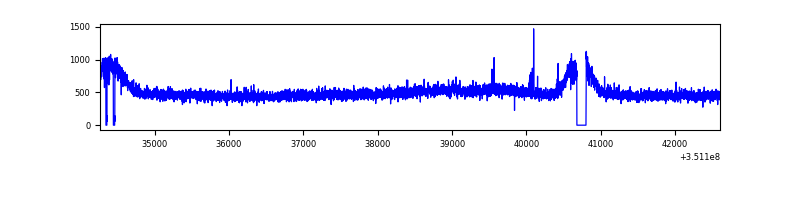 |
| D | 8340 | 8183 | 236 | 236 | 2.83% | 2.88% | 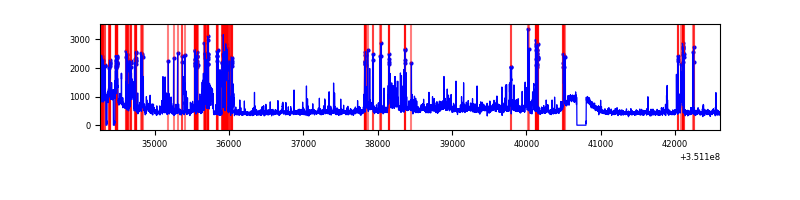 |
Top three noisy pixels from each quadrant. If the there are fewer than three noisy pixels in the level2.evt file, extra rows are filled as -1
| Pixel properties | Quadrant properties | ||||||
|---|---|---|---|---|---|---|---|
| Quadrant | DetID | PixID | Counts | Sigma | Mean | Median | Sigma |
| A | 15 | 174 | 13741 | 60.84 | 1028 | 1005 | 209.3 |
| A | 13 | 254 | 13170 | 58.11 | 1028 | 1005 | 209.3 |
| A | 3 | 137 | 10662 | 46.13 | 1028 | 1005 | 209.3 |
| B | 10 | 246 | 261585 | 1318.93 | 1018 | 990 | 197.6 |
| B | 10 | 245 | 123735 | 621.24 | 1018 | 990 | 197.6 |
| B | 12 | 111 | 25531 | 124.21 | 1018 | 990 | 197.6 |
| C | 14 | 238 | 158161 | 664.09 | 993 | 999 | 236.7 |
| C | 3 | 233 | 38992 | 160.54 | 993 | 999 | 236.7 |
| C | 2 | 114 | 19867 | 79.73 | 993 | 999 | 236.7 |
| D | 1 | 52 | 1295794 | 5498.94 | 984 | 958 | 235.5 |
| D | 8 | 195 | 277702 | 1175.28 | 984 | 958 | 235.5 |
| D | 2 | 120 | 36928 | 152.76 | 984 | 958 | 235.5 |
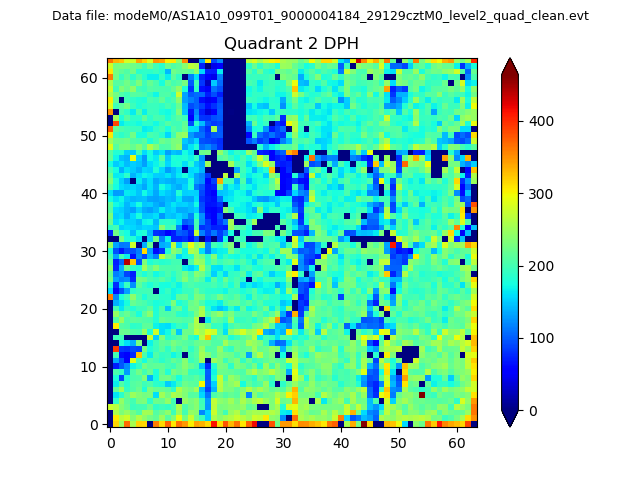
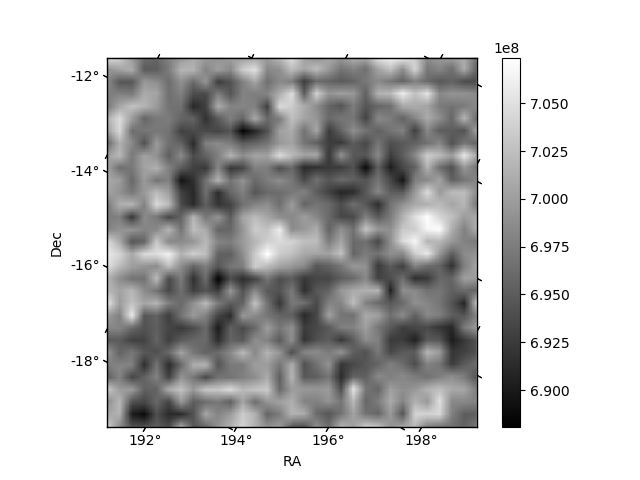
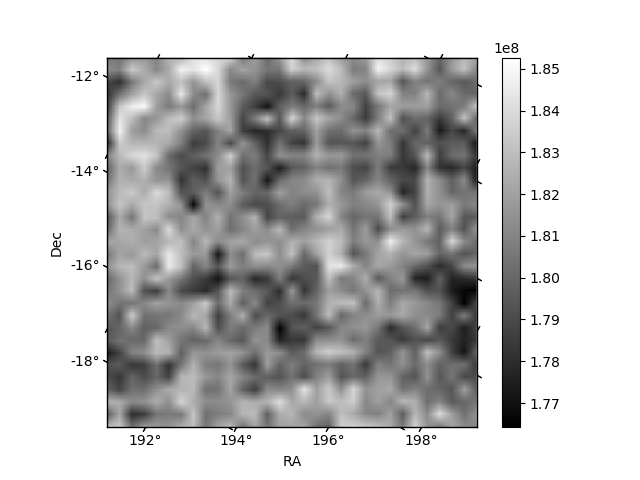
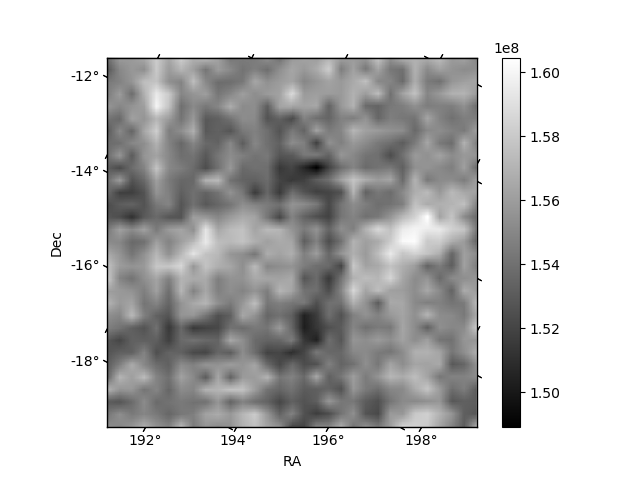
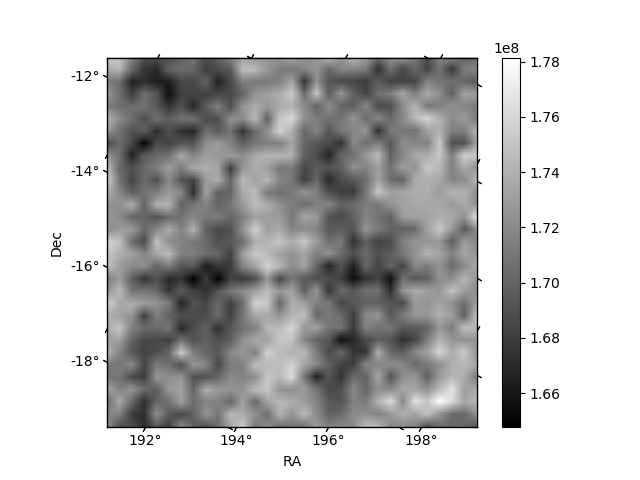
Histogram calculated using DETX and DETY for each event in the final _common_clean file
| Quadrant A | 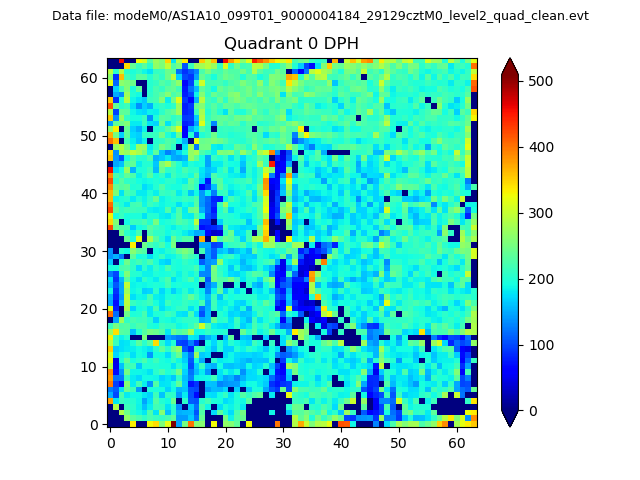 |
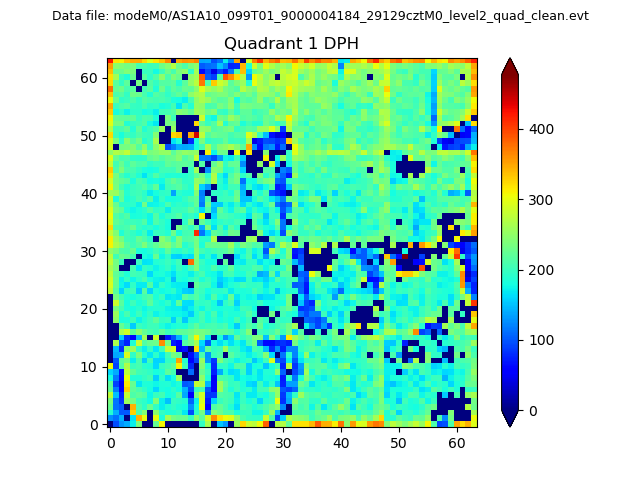 |
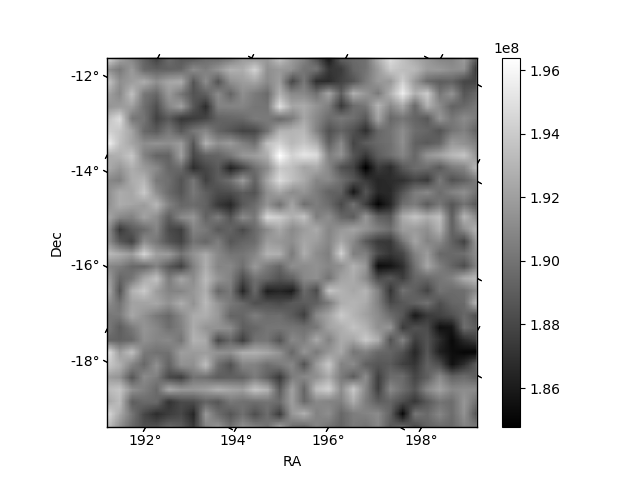
Quadrant B |
|---|---|---|---|
| Quadrant D | 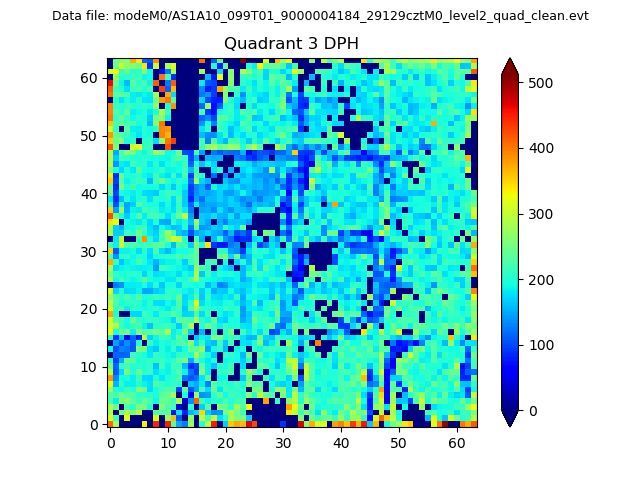 |
 |
Quadrant C |
| Plot type | Count rate plots | Images |
|---|---|---|
| Comparison with Poisson distribution Blue bars denote a histogram of data divided into 1 sec bins. Red curve is a Poisson curve with rate = median count rate of data. |
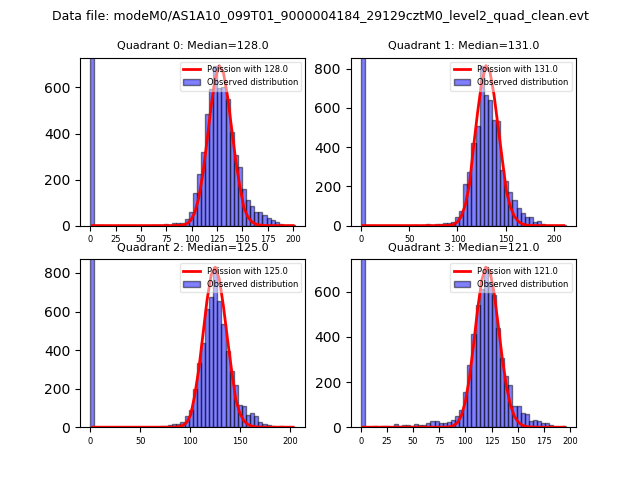 |
 |
| Quadrant-wise count rates Data is divided into 100 sec bins |
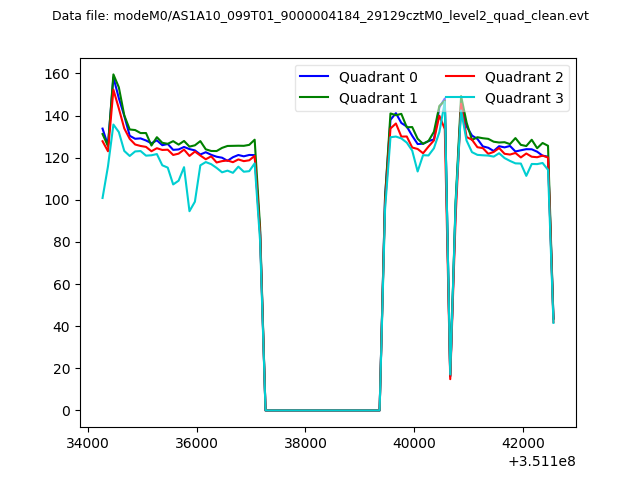 |
|
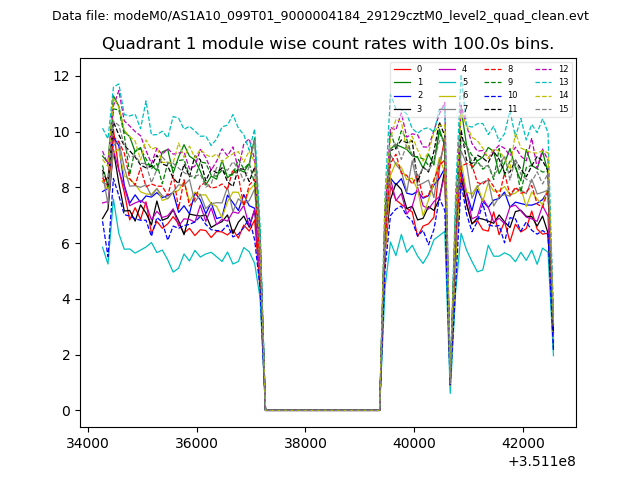
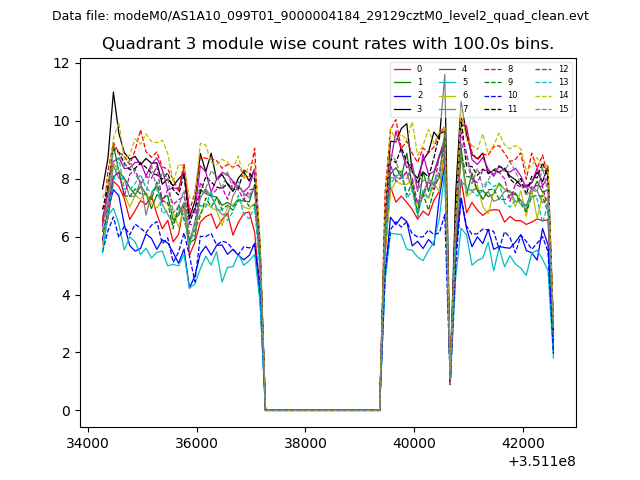
| Module-wise count rates for Quadrant A Data is divided into 100 sec bins |
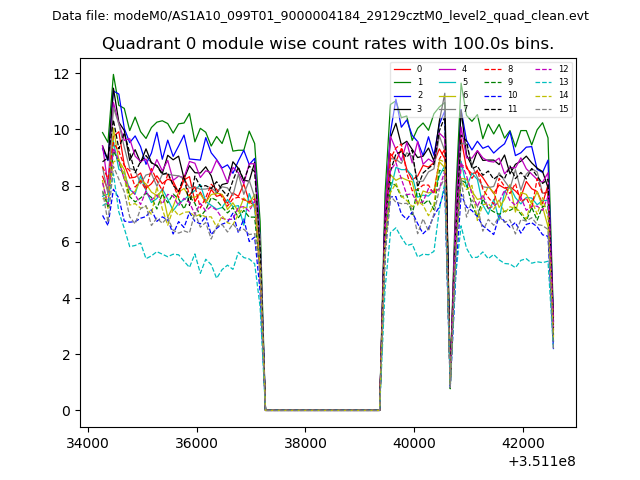 |
 |
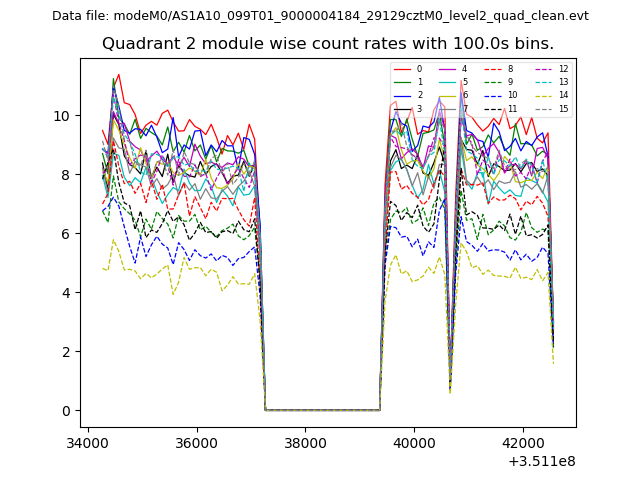
| Module-wise count rates for Quadrant B Data is divided into 100 sec bins |
 |
 |
| Module-wise count rates for Quadrant C Data is divided into 100 sec bins |
 |
 |
| Module-wise count rates for Quadrant D Data is divided into 100 sec bins |
 |
 |
| Parameter | Plot |
|---|---|
| CZT HV Monitor | 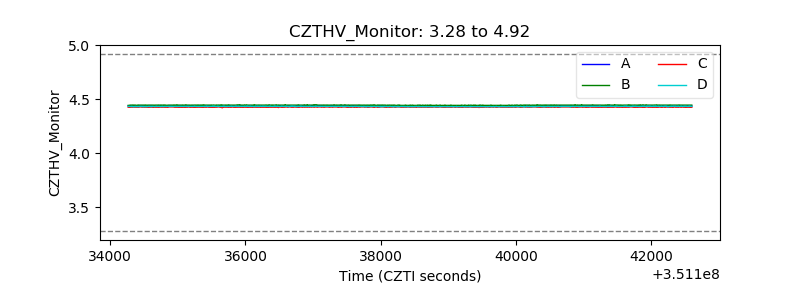 |
| D_VDD | 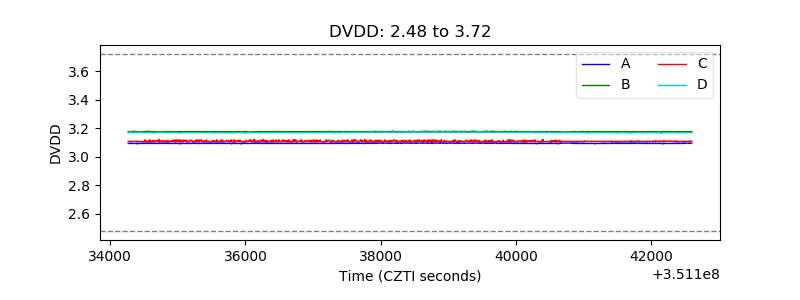 |
| Temperature 1 | 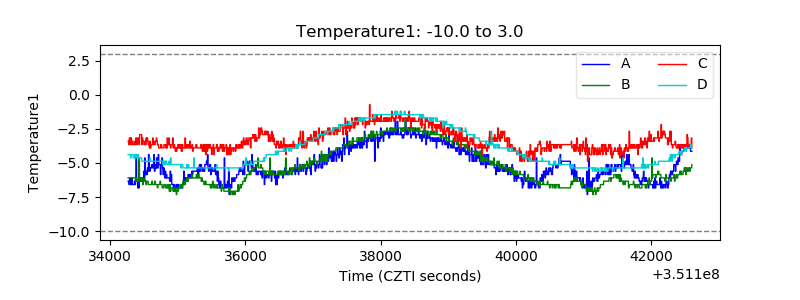 |
| Veto HV Monitor |  |
| Veto LLD | 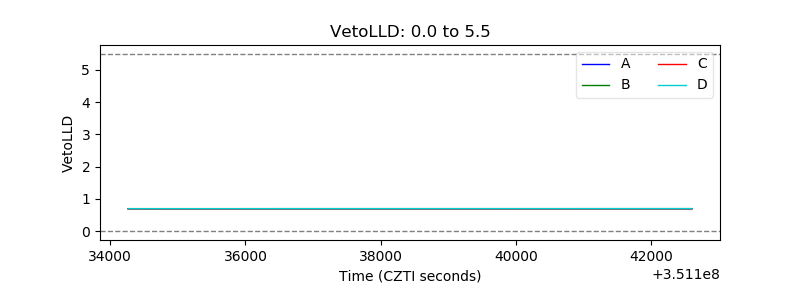 |
| Alpha Counter | 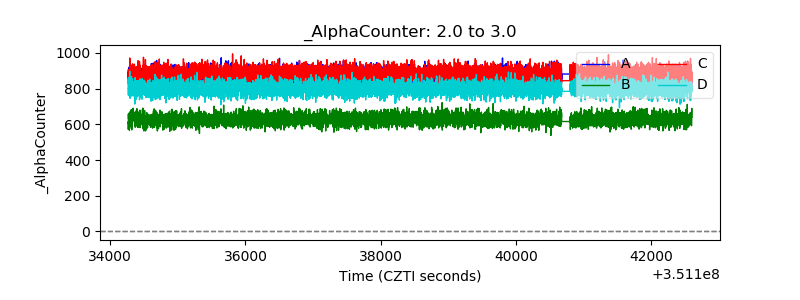 |
| _CPM_Rate |  |
| CZT Counter | 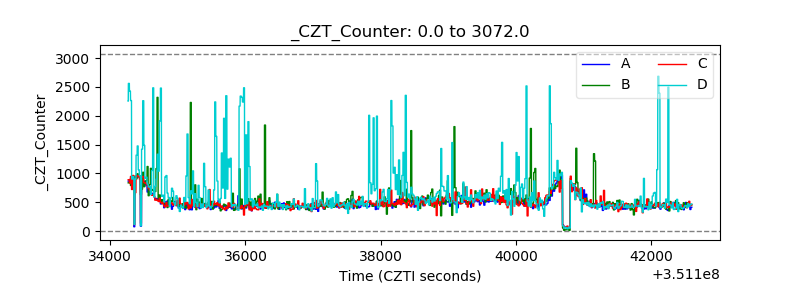 |
| +2.5 Volts monitor | 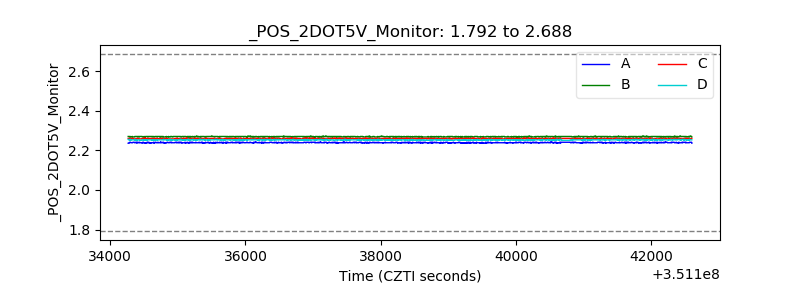 |
| +5 Volts monitor |  |
| _ROLL_ROT | 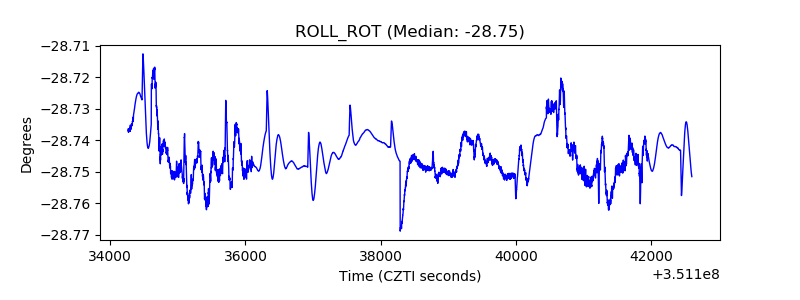 |
| _Roll_DEC | 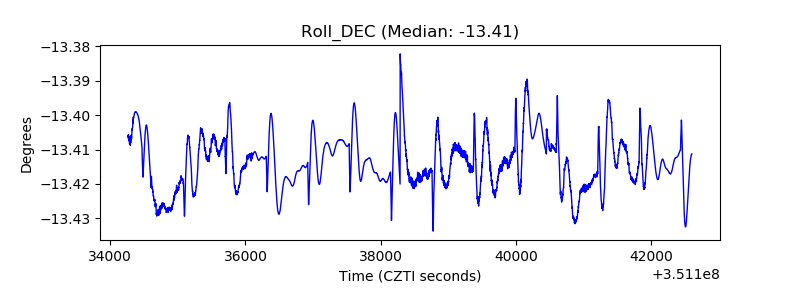 |
| _Roll_RA | 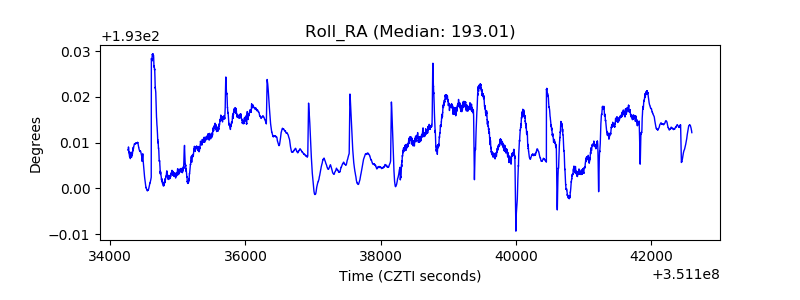 |
| Veto Counter | 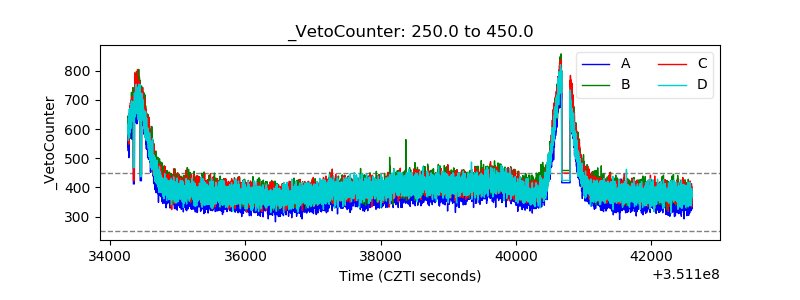 |