| Param | Original file | Final file |
|---|---|---|
| Filename | modeM0/AS1A10_099T01_9000004184_29135cztM0_level2.evt | modeM0/AS1A10_099T01_9000004184_29135cztM0_level2_quad_clean.evt |
| Size (bytes) | 512,542,080 | 66,844,800 |
| Size | 488.8 MB | 63.7 MB |
| Events in quadrant A | 3,462,594 | 394,080 |
| Events in quadrant B | 3,700,301 | 399,359 |
| Events in quadrant C | 3,625,500 | 383,889 |
| Events in quadrant D | 4,274,716 | 374,683 |
| Mode M9 | |||
|---|---|---|---|
| Quadrant | BADHDUFLAG | Total packets | Discarded packets |
| A | 0 | 16 | 0 |
| B | 0 | 17 | 0 |
| C | 0 | 17 | 0 |
| D | 0 | 17 | 0 |
| Mode SS | |||
|---|---|---|---|
| Quadrant | BADHDUFLAG | Total packets | Discarded packets |
| A | 0 | 138 | 0 |
| B | 0 | 138 | 0 |
| C | 0 | 138 | 0 |
| D | 0 | 138 | 0 |
| Mode M0 | |||
|---|---|---|---|
| Quadrant | BADHDUFLAG | Total packets | Discarded packets |
| A | 0 | 14610 | 2 |
| B | 0 | 15182 | 2 |
| C | 0 | 14969 | 2 |
| D | 0 | 17308 | 2 |
| Quadrant | Total seconds | Saturated seconds | Saturation percentage |
|---|---|---|---|
| A | 6768 | 40 | 0.591017% |
| B | 6768 | 67 | 0.989953% |
| C | 6768 | 108 | 1.595745% |
| D | 6768 | 147 | 2.171986% |
Noise dominated data is calculated using 1-second bins in cleaned event files. If a bin has >2000 counts, and if more than 50% of those come from <1% of pixels, then it is considered to be noise-dominated and hence unusable.
| Quadrant | # 1 sec bins | Bins with >0 counts | Bins with >2000 counts | High rate bins dominated by noise | Noise dominated (total time) | Noise dominated (detector-on time) | Marked lightcurve |
|---|---|---|---|---|---|---|---|
| A | 7893 | 6769 | 0 | 0 | 0.00% | 0.00% | 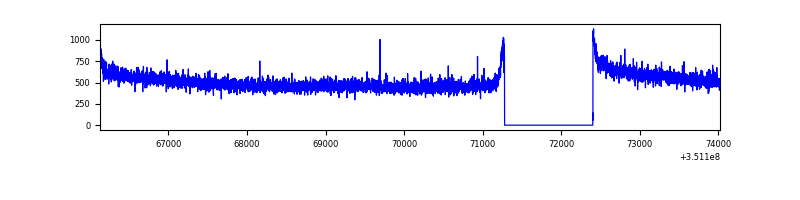 |
| B | 7893 | 6769 | 8 | 8 | 0.10% | 0.12% | 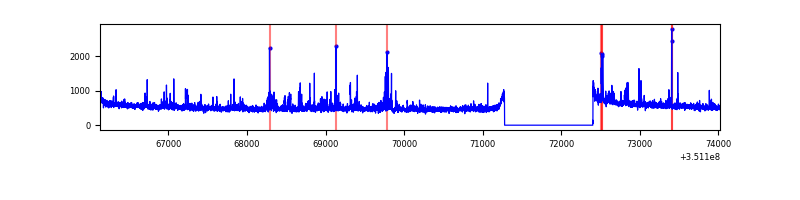 |
| C | 7893 | 6769 | 0 | 0 | 0.00% | 0.00% |  |
| D | 7893 | 6769 | 86 | 86 | 1.09% | 1.27% | 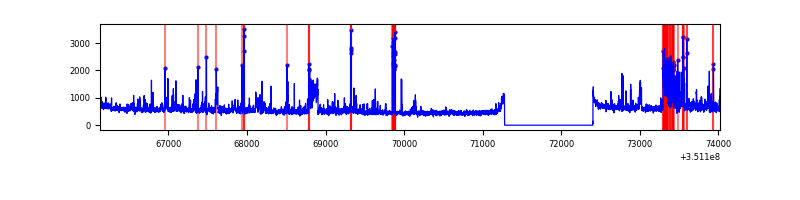 |
Top three noisy pixels from each quadrant. If the there are fewer than three noisy pixels in the level2.evt file, extra rows are filled as -1
| Pixel properties | Quadrant properties | ||||||
|---|---|---|---|---|---|---|---|
| Quadrant | DetID | PixID | Counts | Sigma | Mean | Median | Sigma |
| A | 13 | 254 | 11194 | 57.71 | 895 | 878 | 178.7 |
| A | 3 | 137 | 8532 | 42.82 | 895 | 878 | 178.7 |
| A | 15 | 174 | 8027 | 40.0 | 895 | 878 | 178.7 |
| B | 10 | 246 | 151130 | 907.0 | 882 | 861 | 165.7 |
| B | 0 | 190 | 45237 | 267.85 | 882 | 861 | 165.7 |
| B | 10 | 245 | 26475 | 154.6 | 882 | 861 | 165.7 |
| C | 14 | 238 | 140545 | 698.34 | 858 | 864 | 200.0 |
| C | 3 | 233 | 113818 | 564.72 | 858 | 864 | 200.0 |
| C | 2 | 114 | 15803 | 74.69 | 858 | 864 | 200.0 |
| D | 1 | 52 | 475795 | 2342.33 | 863 | 841 | 202.8 |
| D | 8 | 195 | 322667 | 1587.15 | 863 | 841 | 202.8 |
| D | 12 | 233 | 101069 | 494.29 | 863 | 841 | 202.8 |
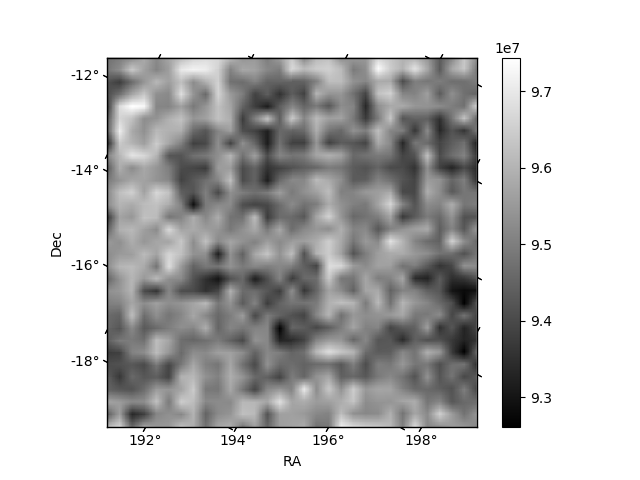
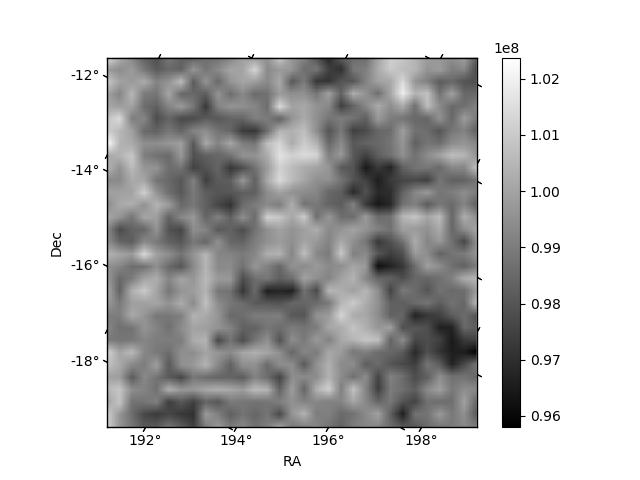
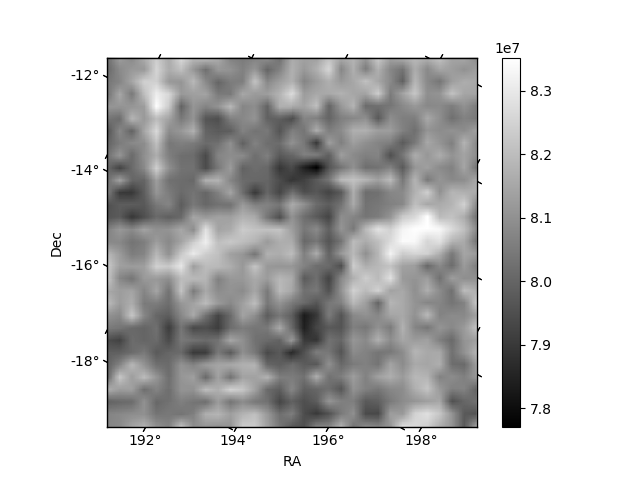
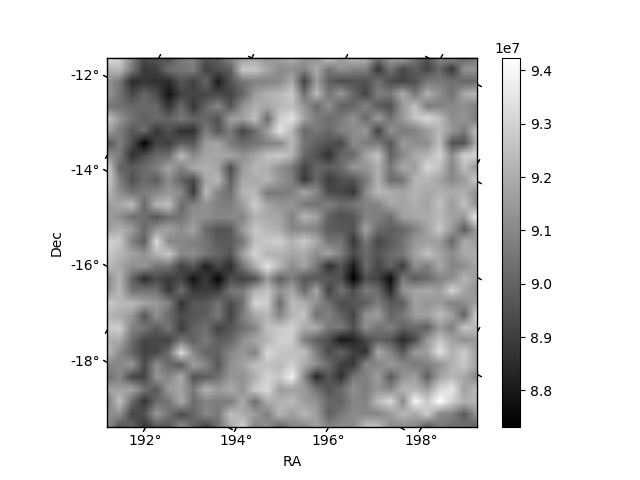
Histogram calculated using DETX and DETY for each event in the final _common_clean file
| Quadrant A |  |
 |
Quadrant B |
|---|---|---|---|
| Quadrant D | 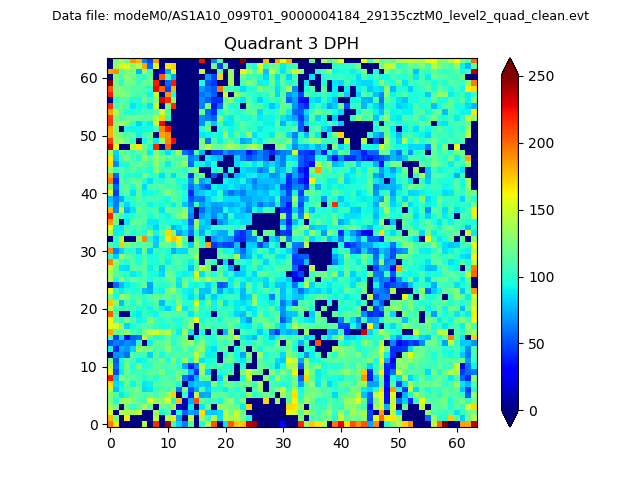 |
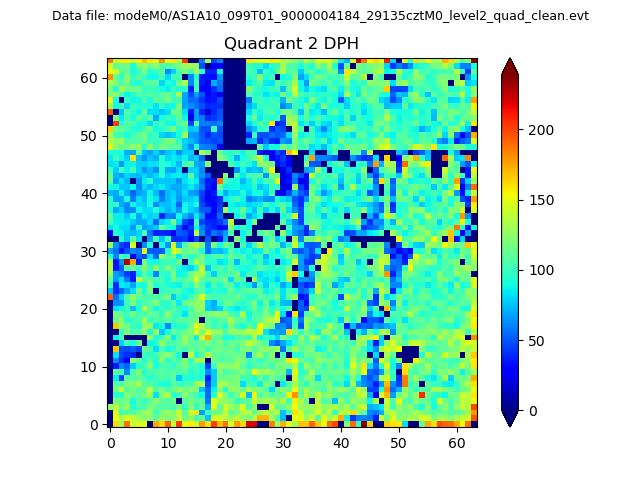 |
Quadrant C |
| Plot type | Count rate plots | Images |
|---|---|---|
| Comparison with Poisson distribution Blue bars denote a histogram of data divided into 1 sec bins. Red curve is a Poisson curve with rate = median count rate of data. |
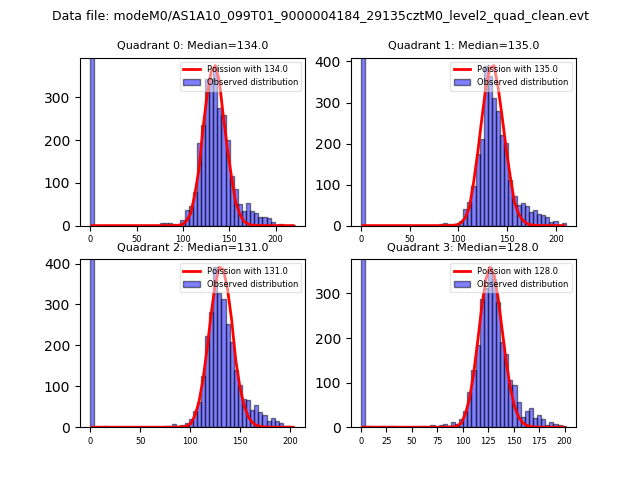 |
 |
| Quadrant-wise count rates Data is divided into 100 sec bins |
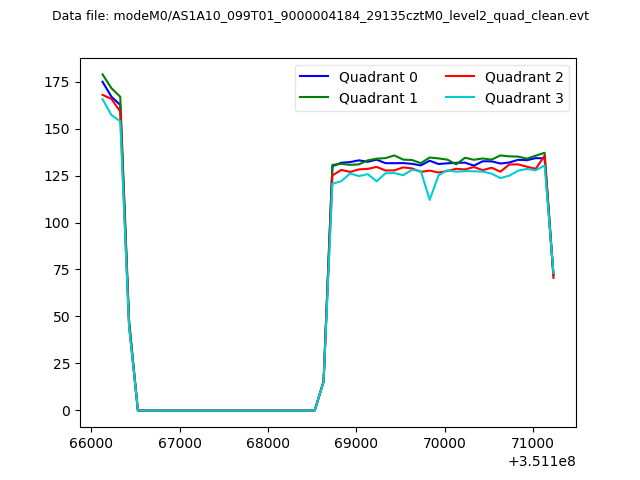 |
|
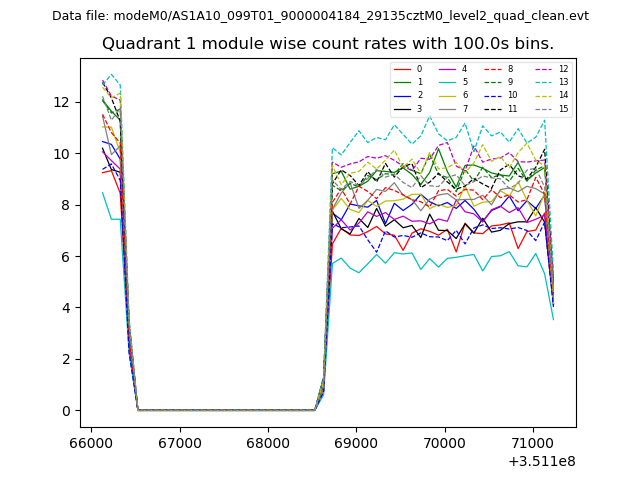
| Module-wise count rates for Quadrant A Data is divided into 100 sec bins |
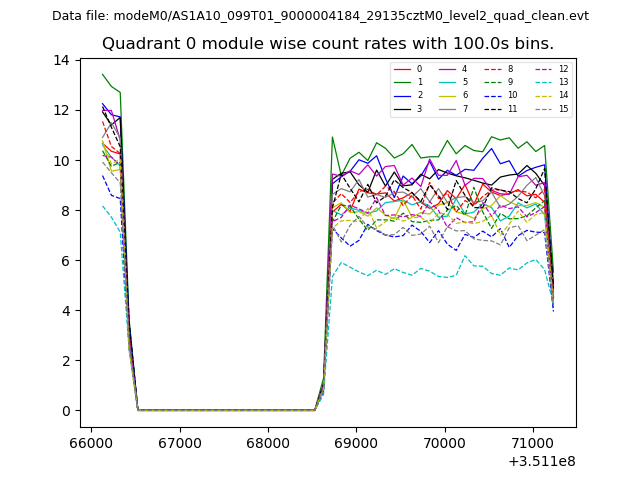 |
 |
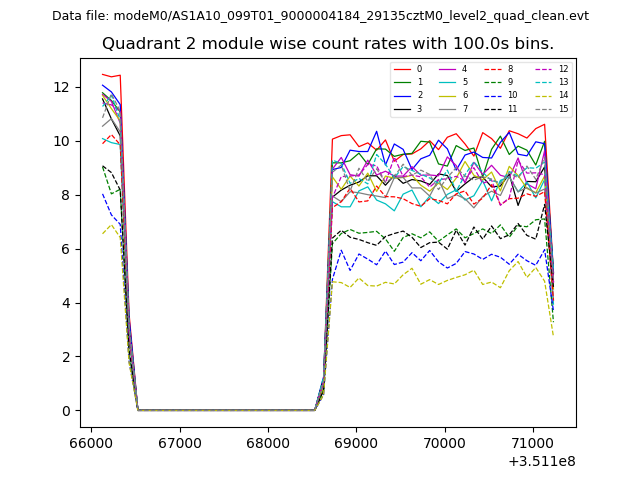
| Module-wise count rates for Quadrant B Data is divided into 100 sec bins |
 |
 |
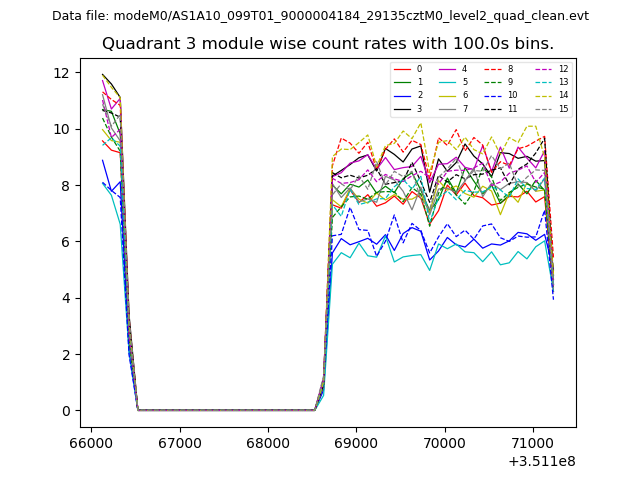
| Module-wise count rates for Quadrant C Data is divided into 100 sec bins |
 |
 |
| Module-wise count rates for Quadrant D Data is divided into 100 sec bins |
 |
 |
| Parameter | Plot |
|---|---|
| CZT HV Monitor | 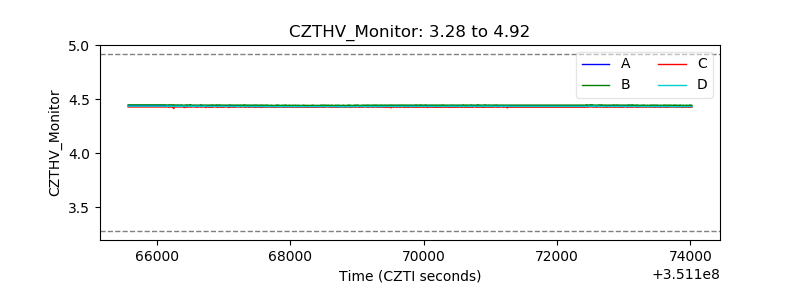 |
| D_VDD | 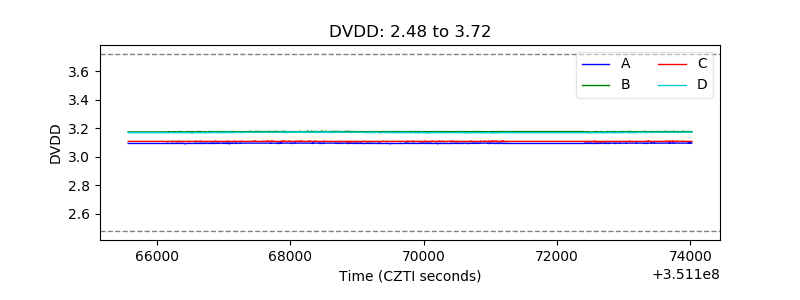 |
| Temperature 1 | 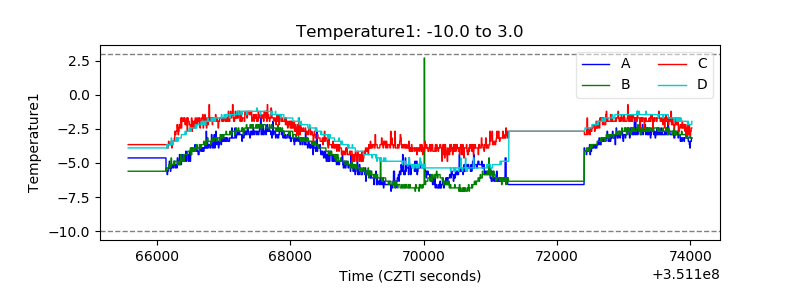 |
| Veto HV Monitor | 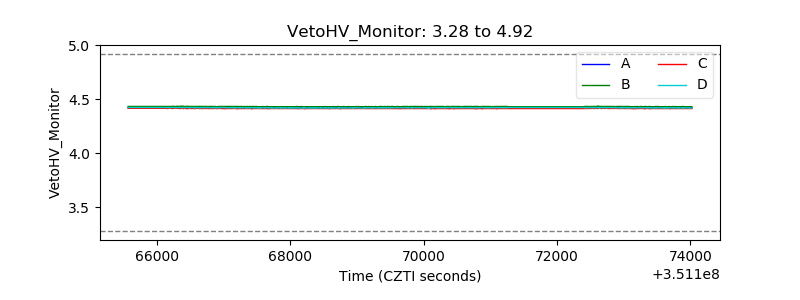 |
| Veto LLD | 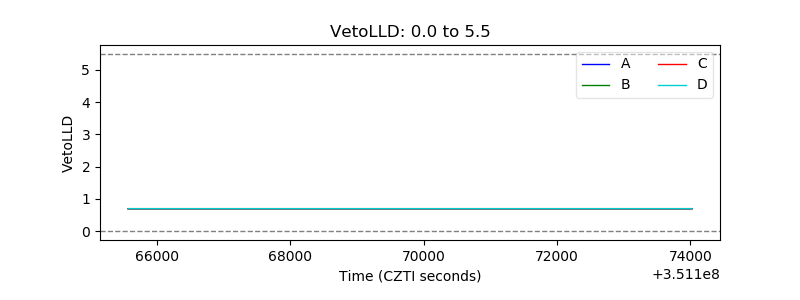 |
| Alpha Counter | 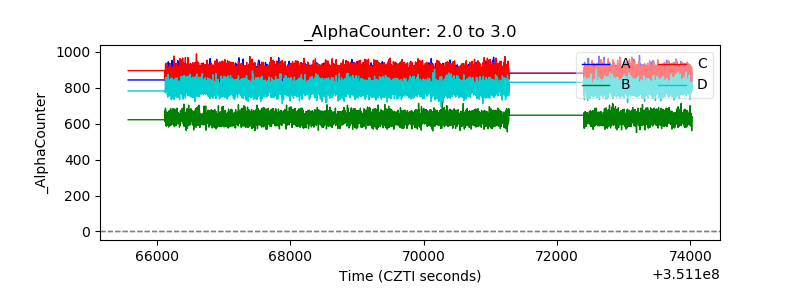 |
| _CPM_Rate | 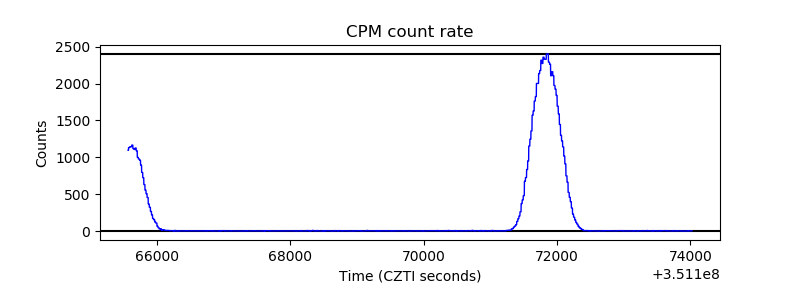 |
| CZT Counter | 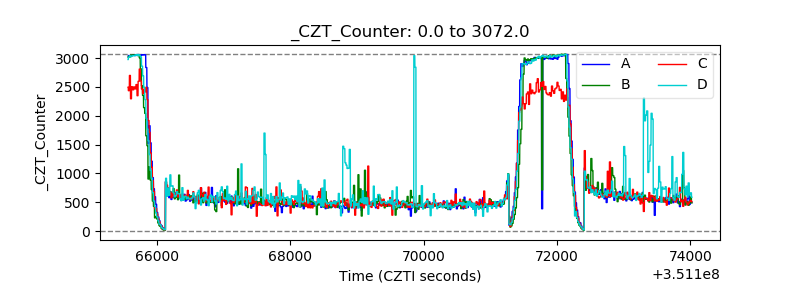 |
| +2.5 Volts monitor |  |
| +5 Volts monitor |  |
| _ROLL_ROT | 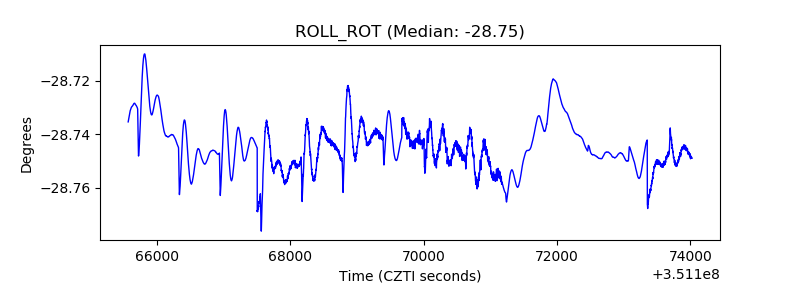 |
| _Roll_DEC | 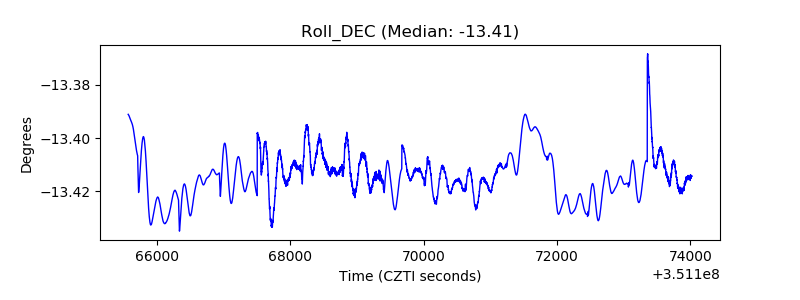 |
| _Roll_RA |  |
| Veto Counter | 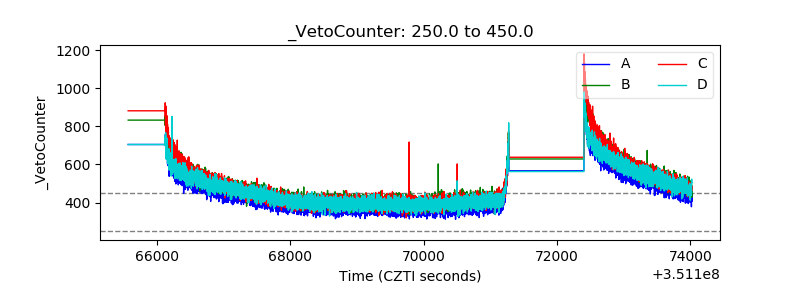 |