| Param | Original file | Final file |
|---|---|---|
| Filename | modeM0/AS1A10_099T01_9000004184_29136cztM0_level2.evt | modeM0/AS1A10_099T01_9000004184_29136cztM0_level2_quad_clean.evt |
| Size (bytes) | 547,801,920 | 67,273,920 |
| Size | 522.4 MB | 64.2 MB |
| Events in quadrant A | 3,573,086 | 403,092 |
| Events in quadrant B | 3,801,627 | 406,780 |
| Events in quadrant C | 3,652,883 | 389,482 |
| Events in quadrant D | 5,115,148 | 377,038 |
| Mode M9 | |||
|---|---|---|---|
| Quadrant | BADHDUFLAG | Total packets | Discarded packets |
| A | 0 | 19 | 0 |
| B | 0 | 20 | 0 |
| C | 0 | 20 | 0 |
| D | 0 | 20 | 0 |
| Mode SS | |||
|---|---|---|---|
| Quadrant | BADHDUFLAG | Total packets | Discarded packets |
| A | 0 | 132 | 0 |
| B | 0 | 132 | 0 |
| C | 0 | 132 | 0 |
| D | 0 | 132 | 0 |
| Mode M0 | |||
|---|---|---|---|
| Quadrant | BADHDUFLAG | Total packets | Discarded packets |
| A | 0 | 14993 | 3 |
| B | 0 | 15519 | 2 |
| C | 0 | 15107 | 2 |
| D | 0 | 19813 | 2 |
| Quadrant | Total seconds | Saturated seconds | Saturation percentage |
|---|---|---|---|
| A | 6610 | 74 | 1.119516% |
| B | 6610 | 102 | 1.543116% |
| C | 6610 | 127 | 1.921331% |
| D | 6610 | 412 | 6.232980% |
Noise dominated data is calculated using 1-second bins in cleaned event files. If a bin has >2000 counts, and if more than 50% of those come from <1% of pixels, then it is considered to be noise-dominated and hence unusable.
| Quadrant | # 1 sec bins | Bins with >0 counts | Bins with >2000 counts | High rate bins dominated by noise | Noise dominated (total time) | Noise dominated (detector-on time) | Marked lightcurve |
|---|---|---|---|---|---|---|---|
| A | 7850 | 6611 | 0 | 0 | 0.00% | 0.00% | 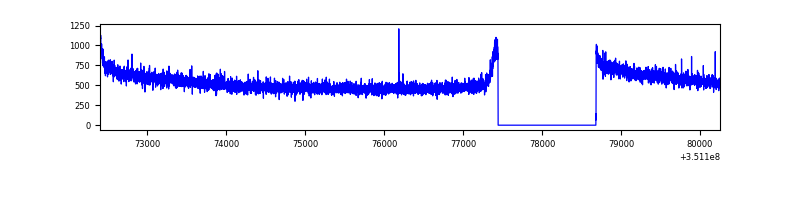 |
| B | 7850 | 6611 | 13 | 13 | 0.17% | 0.20% | 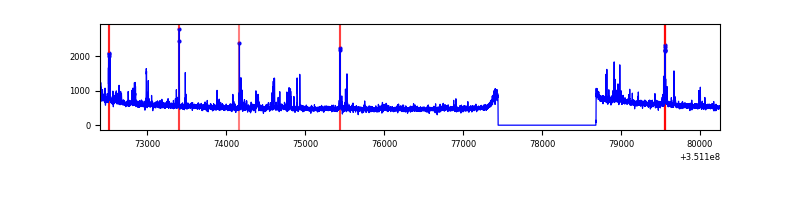 |
| C | 7850 | 6611 | 0 | 0 | 0.00% | 0.00% | 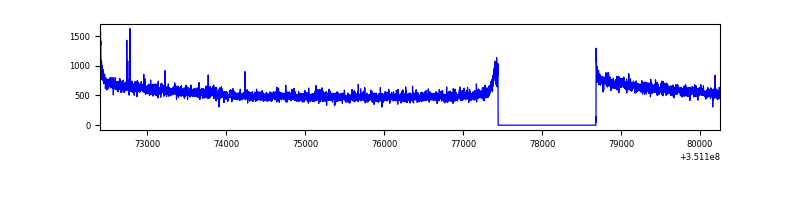 |
| D | 7850 | 6611 | 279 | 279 | 3.55% | 4.22% | 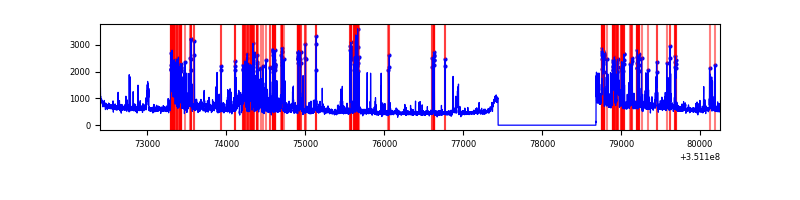 |
Top three noisy pixels from each quadrant. If the there are fewer than three noisy pixels in the level2.evt file, extra rows are filled as -1
| Pixel properties | Quadrant properties | ||||||
|---|---|---|---|---|---|---|---|
| Quadrant | DetID | PixID | Counts | Sigma | Mean | Median | Sigma |
| A | 13 | 254 | 10641 | 53.48 | 925 | 909 | 182.0 |
| A | 3 | 137 | 8443 | 41.4 | 925 | 909 | 182.0 |
| A | 0 | 226 | 7997 | 38.95 | 925 | 909 | 182.0 |
| B | 10 | 246 | 148808 | 870.92 | 911 | 892 | 169.8 |
| B | 10 | 245 | 44569 | 257.17 | 911 | 892 | 169.8 |
| B | 0 | 190 | 22744 | 128.66 | 911 | 892 | 169.8 |
| C | 14 | 238 | 144468 | 708.72 | 880 | 892 | 202.6 |
| C | 3 | 233 | 51256 | 248.61 | 880 | 892 | 202.6 |
| C | 2 | 114 | 15814 | 73.66 | 880 | 892 | 202.6 |
| D | 1 | 52 | 1115223 | 5455.38 | 872 | 852 | 204.3 |
| D | 8 | 195 | 280501 | 1369.02 | 872 | 852 | 204.3 |
| D | 12 | 233 | 268009 | 1307.86 | 872 | 852 | 204.3 |
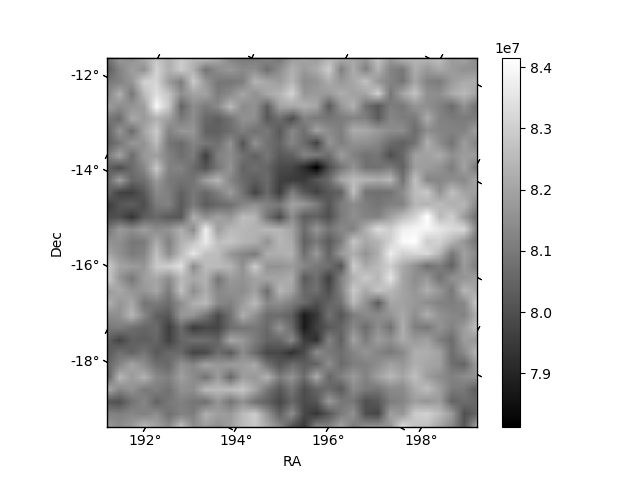
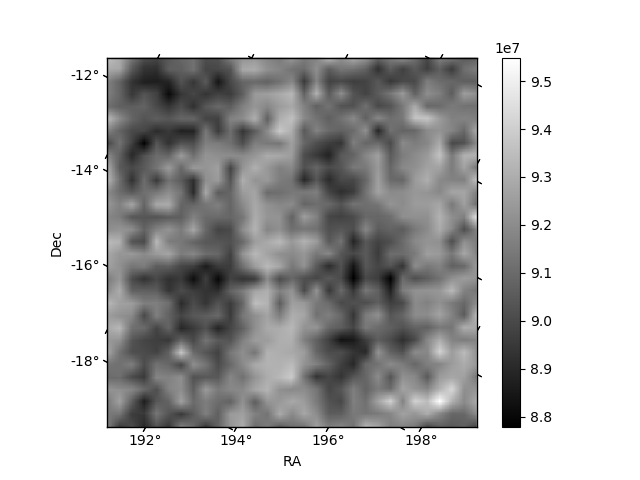
Histogram calculated using DETX and DETY for each event in the final _common_clean file
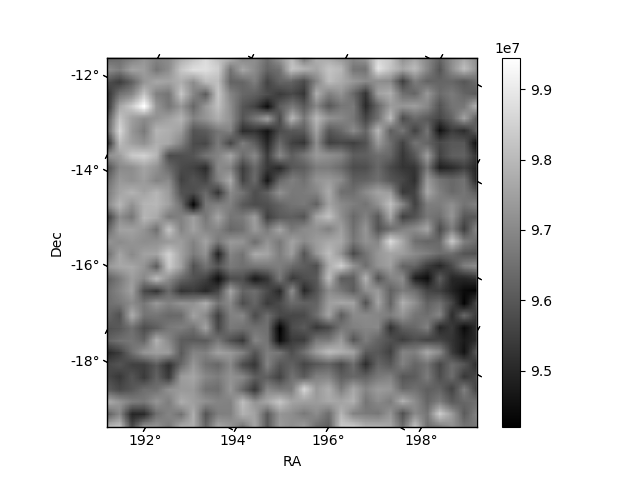
| Quadrant A | 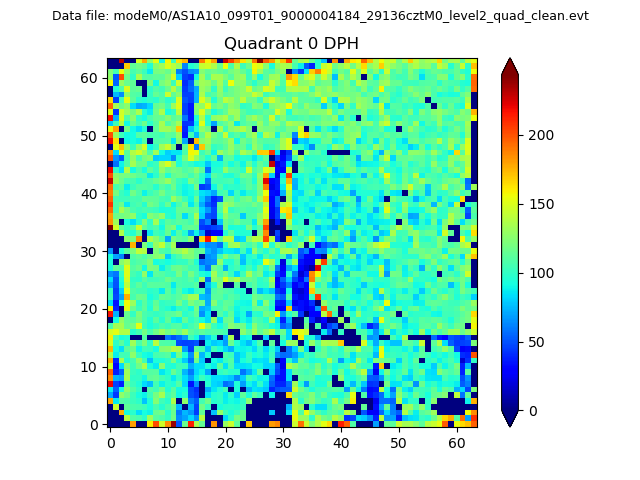 |
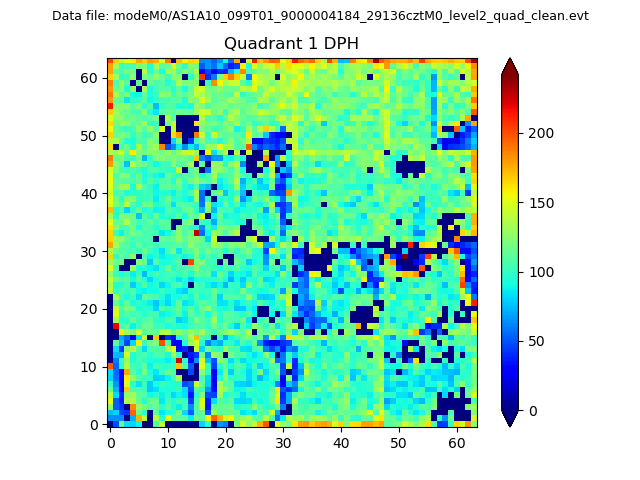 |
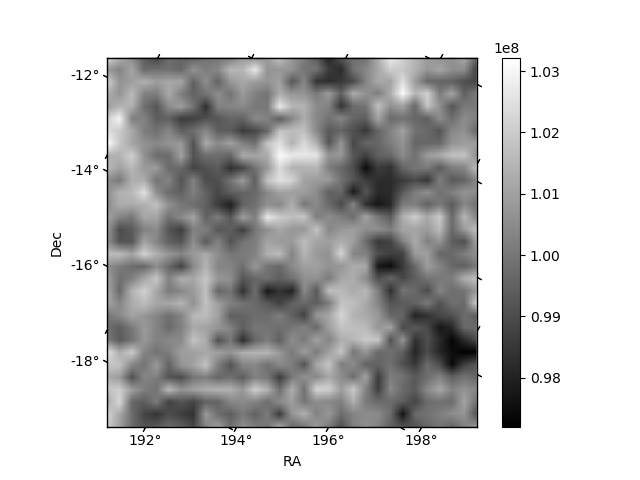
Quadrant B |
|---|---|---|---|
| Quadrant D | 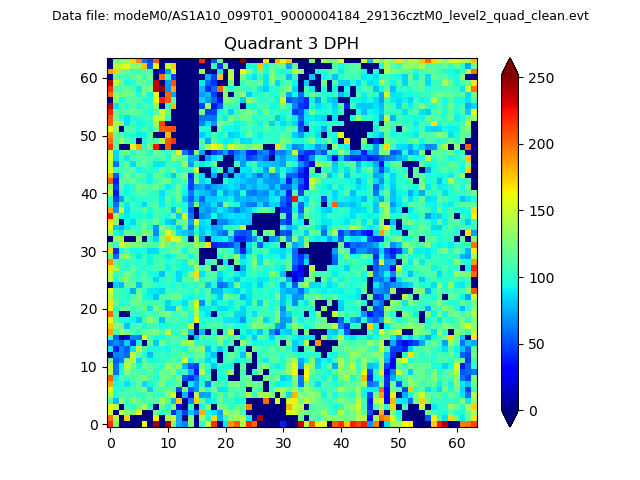 |
 |
Quadrant C |
| Plot type | Count rate plots | Images |
|---|---|---|
| Comparison with Poisson distribution Blue bars denote a histogram of data divided into 1 sec bins. Red curve is a Poisson curve with rate = median count rate of data. |
 |
 |
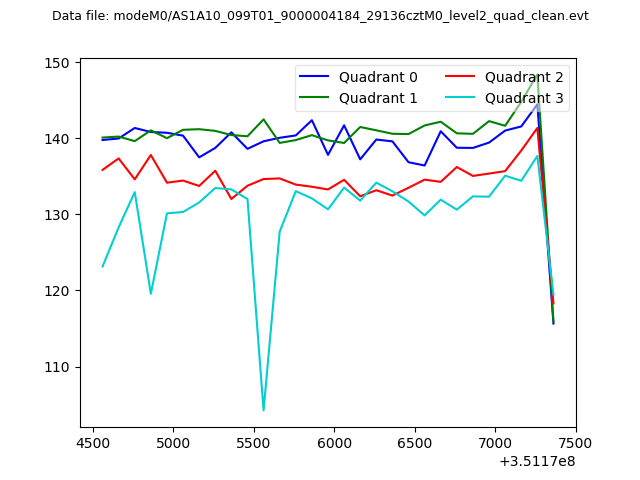
| Quadrant-wise count rates Data is divided into 100 sec bins |
 |
|
| Module-wise count rates for Quadrant A Data is divided into 100 sec bins |
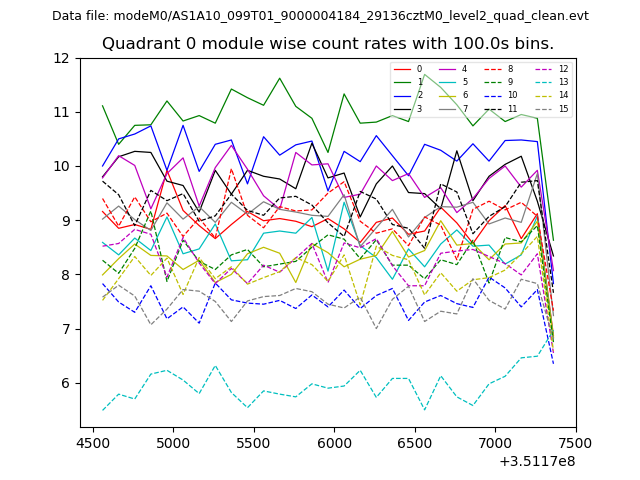 |
 |
| Module-wise count rates for Quadrant B Data is divided into 100 sec bins |
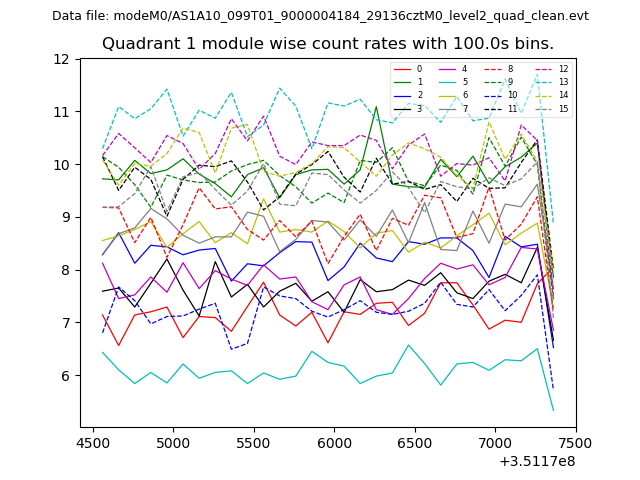 |
 |
| Module-wise count rates for Quadrant C Data is divided into 100 sec bins |
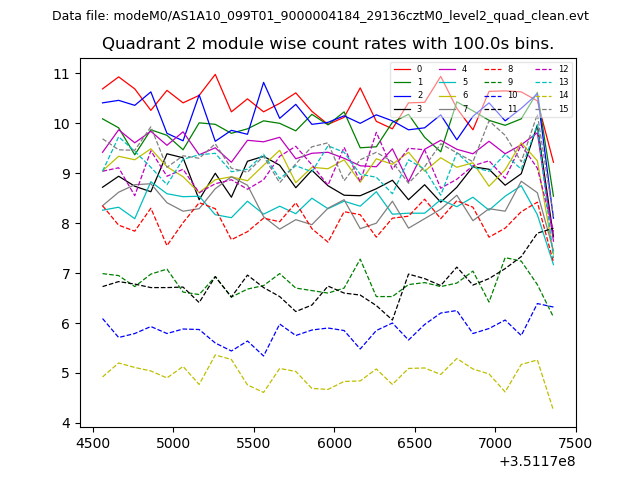 |
 |
| Module-wise count rates for Quadrant D Data is divided into 100 sec bins |
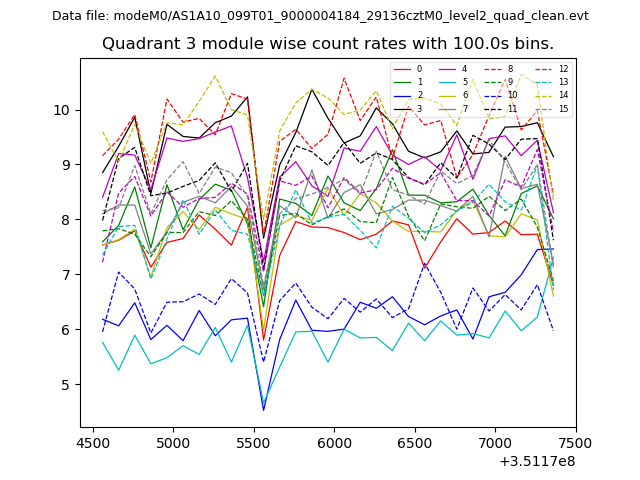 |
 |
| Parameter | Plot |
|---|---|
| CZT HV Monitor | 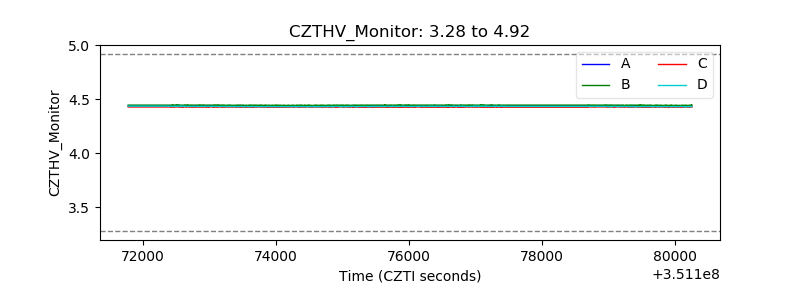 |
| D_VDD | 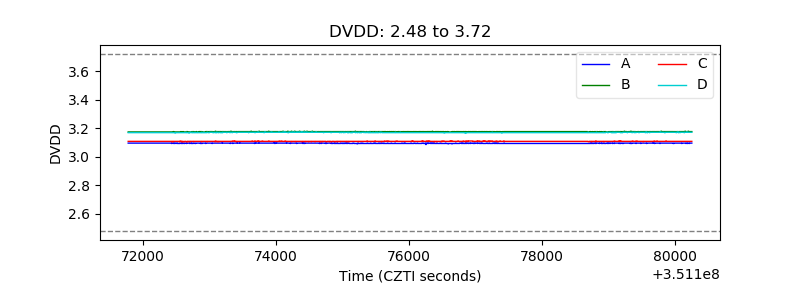 |
| Temperature 1 | 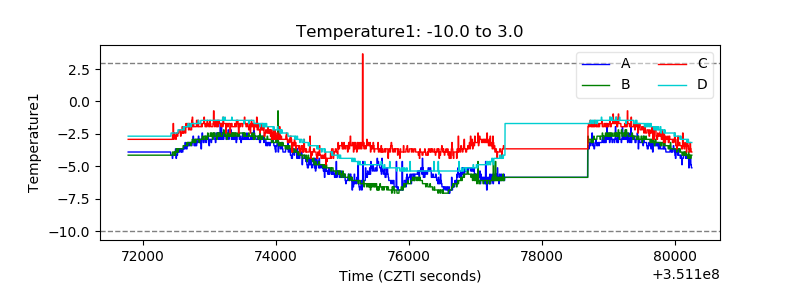 |
| Veto HV Monitor | 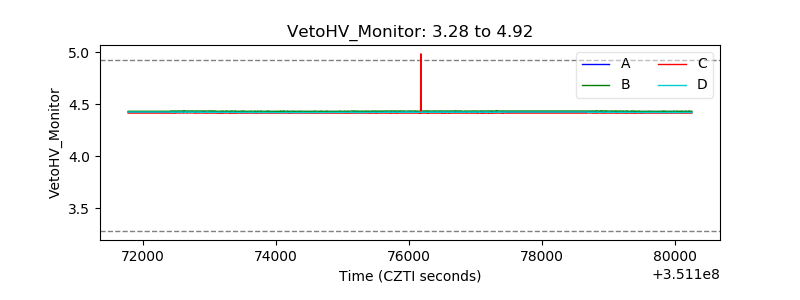 |
| Veto LLD | 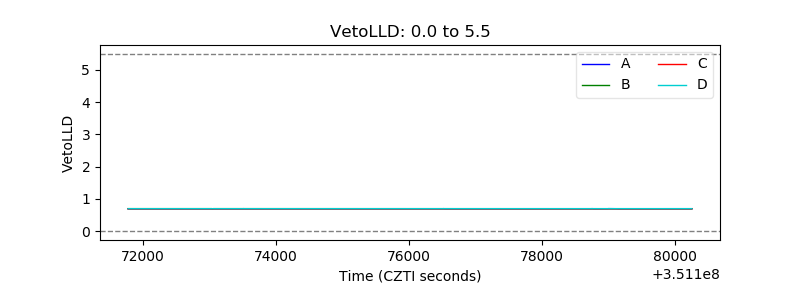 |
| Alpha Counter | 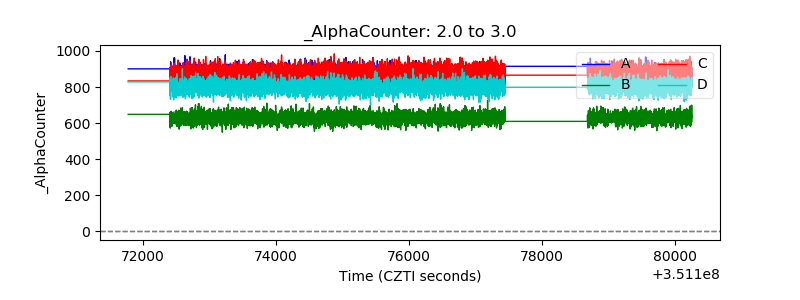 |
| _CPM_Rate | 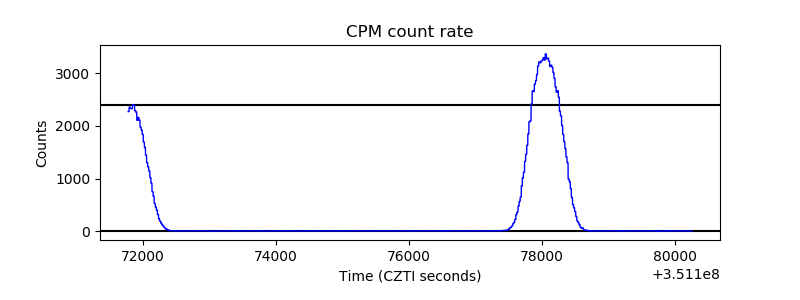 |
| CZT Counter |  |
| +2.5 Volts monitor |  |
| +5 Volts monitor |  |
| _ROLL_ROT | 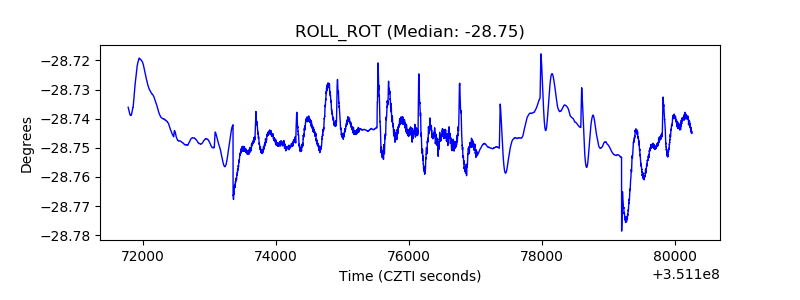 |
| _Roll_DEC | 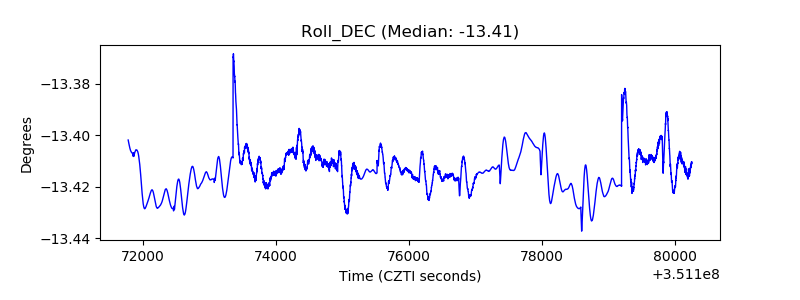 |
| _Roll_RA | 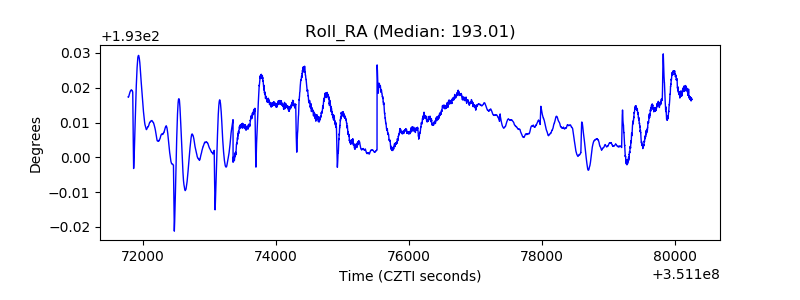 |
| Veto Counter | 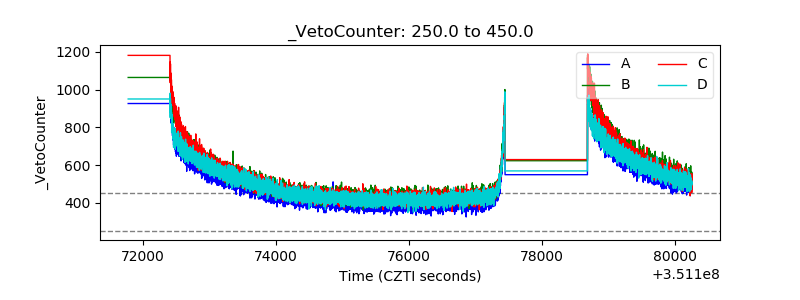 |