| Param | Original file | Final file |
|---|---|---|
| Filename | modeM0/AS1A10_099T01_9000004184_29137cztM0_level2.evt | modeM0/AS1A10_099T01_9000004184_29137cztM0_level2_quad_clean.evt |
| Size (bytes) | 537,998,400 | 76,487,040 |
| Size | 513.1 MB | 72.9 MB |
| Events in quadrant A | 3,541,058 | 481,044 |
| Events in quadrant B | 3,693,559 | 487,776 |
| Events in quadrant C | 3,603,394 | 462,146 |
| Events in quadrant D | 5,028,524 | 445,385 |
| Mode M9 | |||
|---|---|---|---|
| Quadrant | BADHDUFLAG | Total packets | Discarded packets |
| A | 0 | 17 | 0 |
| B | 0 | 18 | 0 |
| C | 0 | 18 | 0 |
| D | 0 | 18 | 0 |
| Mode SS | |||
|---|---|---|---|
| Quadrant | BADHDUFLAG | Total packets | Discarded packets |
| A | 0 | 128 | 0 |
| B | 0 | 128 | 0 |
| C | 0 | 128 | 0 |
| D | 0 | 128 | 0 |
| Mode M0 | |||
|---|---|---|---|
| Quadrant | BADHDUFLAG | Total packets | Discarded packets |
| A | 0 | 14720 | 2 |
| B | 0 | 15038 | 2 |
| C | 0 | 14761 | 2 |
| D | 0 | 19223 | 2 |
| Quadrant | Total seconds | Saturated seconds | Saturation percentage |
|---|---|---|---|
| A | 6300 | 84 | 1.333333% |
| B | 6300 | 107 | 1.698413% |
| C | 6299 | 138 | 2.190824% |
| D | 6299 | 343 | 5.445309% |
Noise dominated data is calculated using 1-second bins in cleaned event files. If a bin has >2000 counts, and if more than 50% of those come from <1% of pixels, then it is considered to be noise-dominated and hence unusable.
| Quadrant | # 1 sec bins | Bins with >0 counts | Bins with >2000 counts | High rate bins dominated by noise | Noise dominated (total time) | Noise dominated (detector-on time) | Marked lightcurve |
|---|---|---|---|---|---|---|---|
| A | 7610 | 6301 | 0 | 0 | 0.00% | 0.00% | 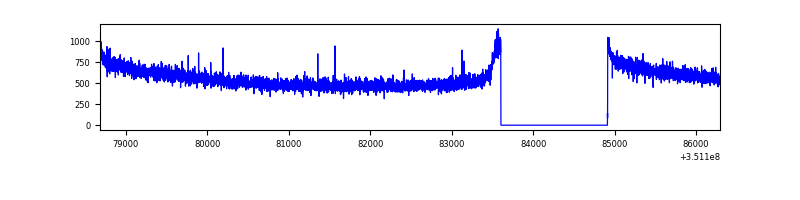 |
| B | 7610 | 6301 | 6 | 6 | 0.08% | 0.10% | 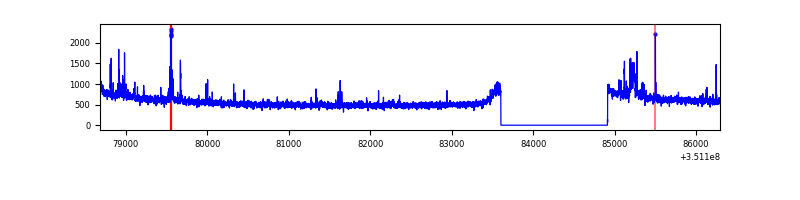 |
| C | 7609 | 6300 | 0 | 0 | 0.00% | 0.00% | 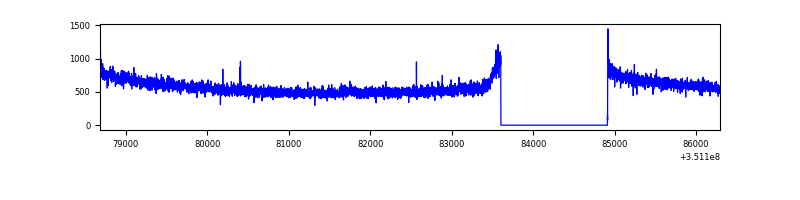 |
| D | 7609 | 6300 | 225 | 225 | 2.96% | 3.57% | 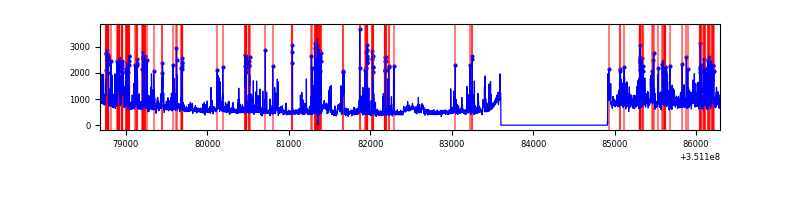 |
Top three noisy pixels from each quadrant. If the there are fewer than three noisy pixels in the level2.evt file, extra rows are filled as -1
| Pixel properties | Quadrant properties | ||||||
|---|---|---|---|---|---|---|---|
| Quadrant | DetID | PixID | Counts | Sigma | Mean | Median | Sigma |
| A | 13 | 254 | 10486 | 53.26 | 918 | 905 | 179.9 |
| A | 3 | 137 | 8215 | 40.64 | 918 | 905 | 179.9 |
| A | 0 | 226 | 7719 | 37.88 | 918 | 905 | 179.9 |
| B | 10 | 245 | 59881 | 350.8 | 905 | 887 | 168.2 |
| B | 0 | 190 | 50589 | 295.55 | 905 | 887 | 168.2 |
| B | 10 | 246 | 30438 | 175.72 | 905 | 887 | 168.2 |
| C | 14 | 238 | 142283 | 714.69 | 865 | 875 | 197.9 |
| C | 3 | 233 | 70344 | 351.11 | 865 | 875 | 197.9 |
| C | 2 | 114 | 15020 | 71.49 | 865 | 875 | 197.9 |
| D | 1 | 52 | 1122728 | 5576.55 | 858 | 841 | 201.2 |
| D | 8 | 195 | 435144 | 2158.78 | 858 | 841 | 201.2 |
| D | 12 | 233 | 129804 | 641.03 | 858 | 841 | 201.2 |
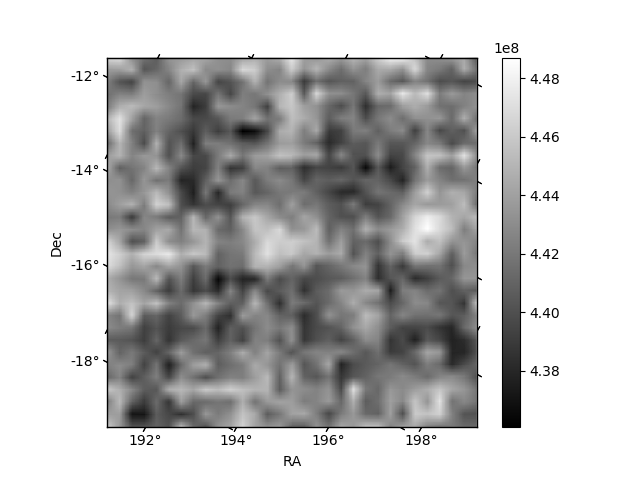
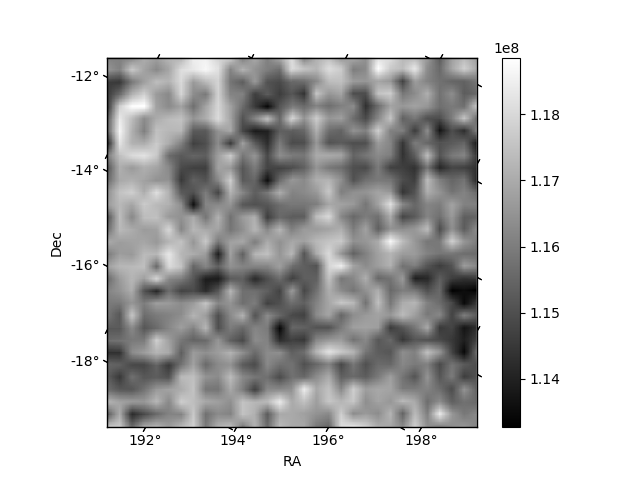
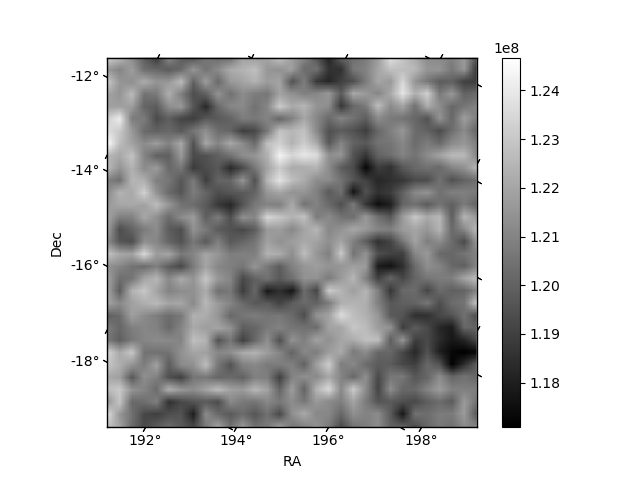
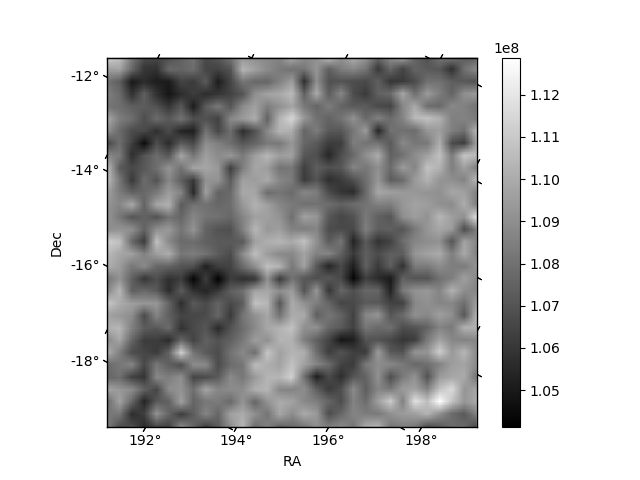
Histogram calculated using DETX and DETY for each event in the final _common_clean file
| Quadrant A | 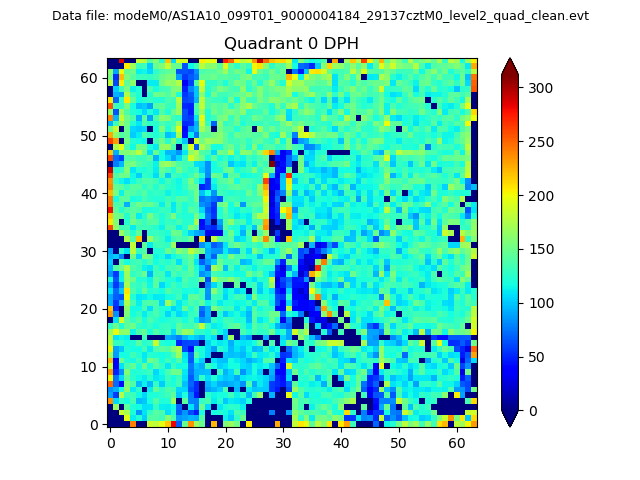 |
 |
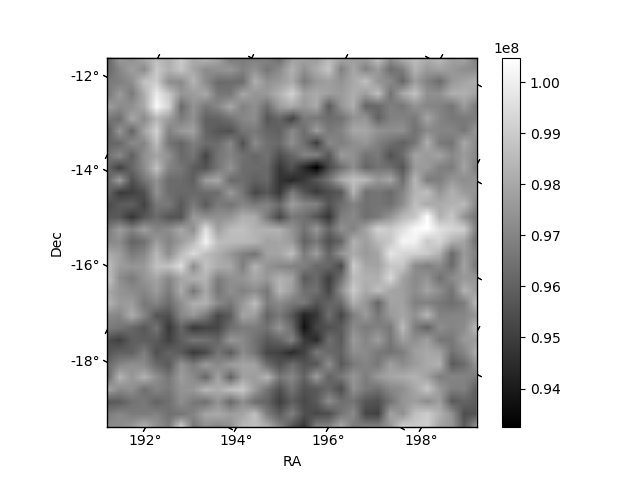
Quadrant B |
|---|---|---|---|
| Quadrant D | 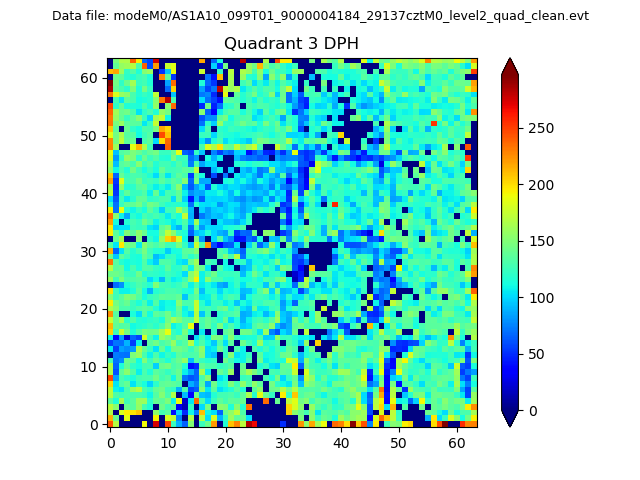 |
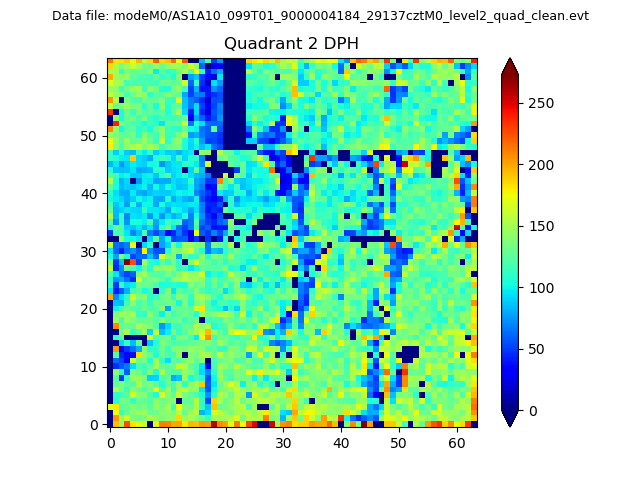 |
Quadrant C |
| Plot type | Count rate plots | Images |
|---|---|---|
| Comparison with Poisson distribution Blue bars denote a histogram of data divided into 1 sec bins. Red curve is a Poisson curve with rate = median count rate of data. |
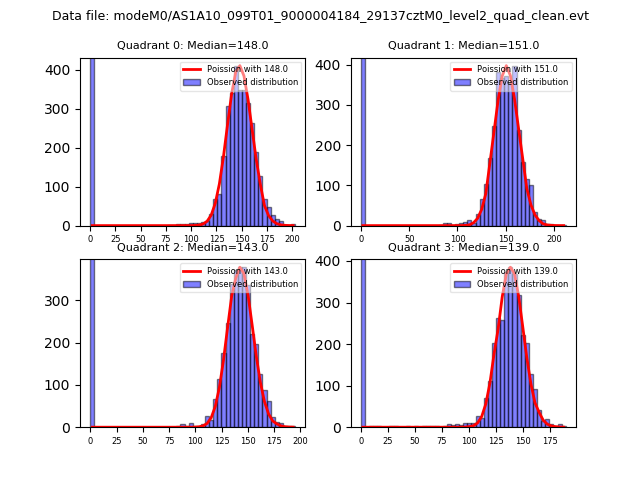 |
 |
| Quadrant-wise count rates Data is divided into 100 sec bins |
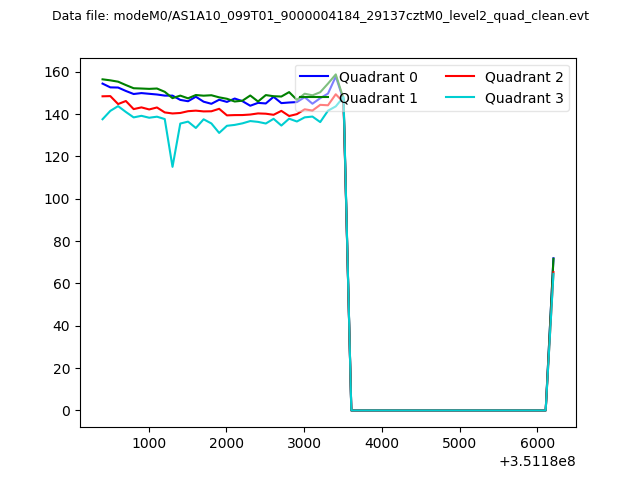 |
|
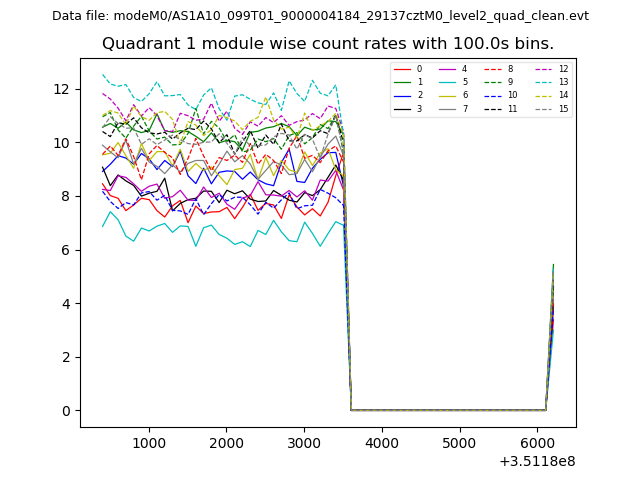
| Module-wise count rates for Quadrant A Data is divided into 100 sec bins |
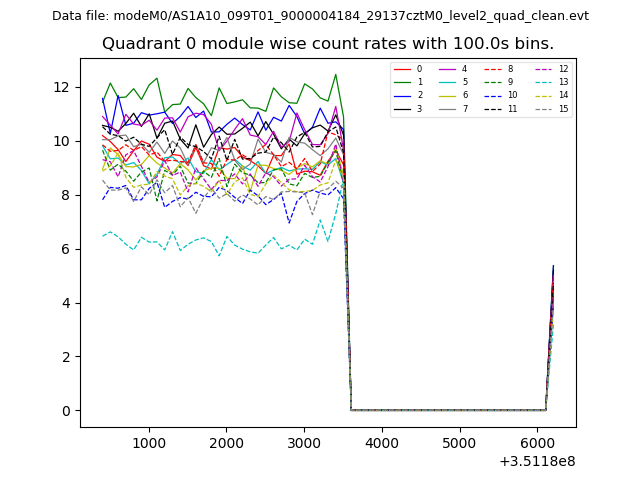 |
 |
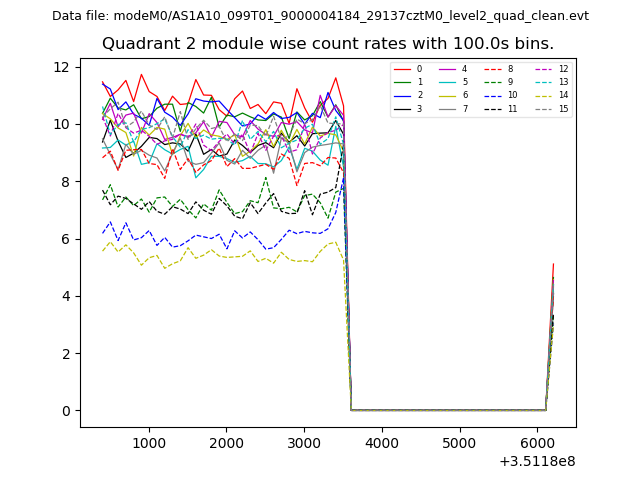
| Module-wise count rates for Quadrant B Data is divided into 100 sec bins |
 |
 |
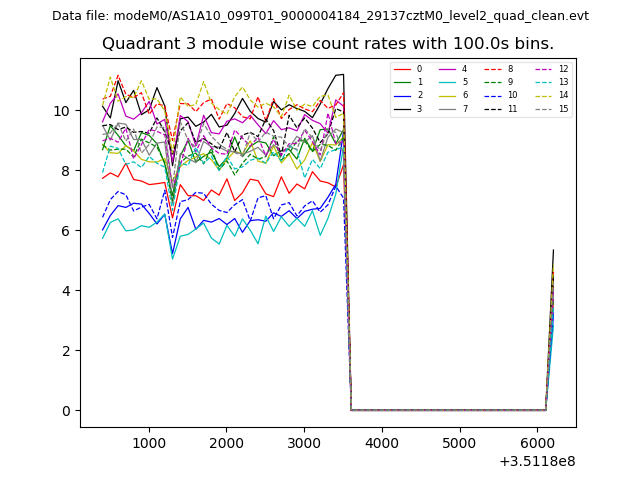
| Module-wise count rates for Quadrant C Data is divided into 100 sec bins |
 |
 |
| Module-wise count rates for Quadrant D Data is divided into 100 sec bins |
 |
 |
| Parameter | Plot |
|---|---|
| CZT HV Monitor | 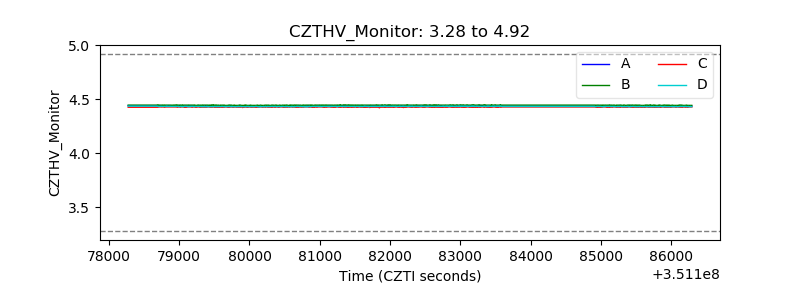 |
| D_VDD | 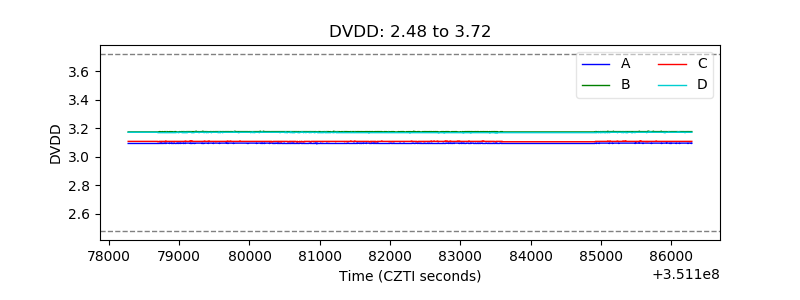 |
| Temperature 1 | 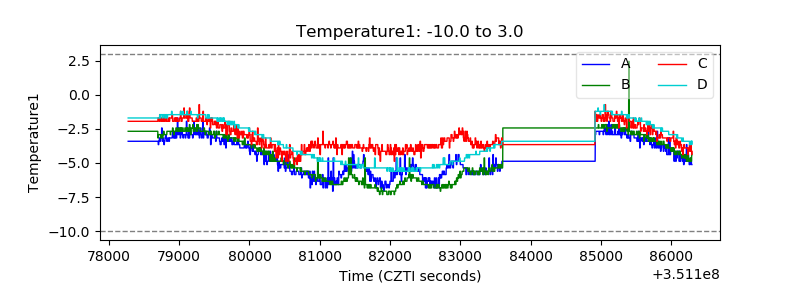 |
| Veto HV Monitor | 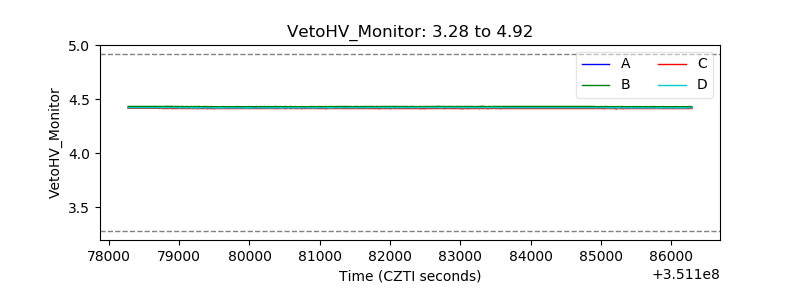 |
| Veto LLD | 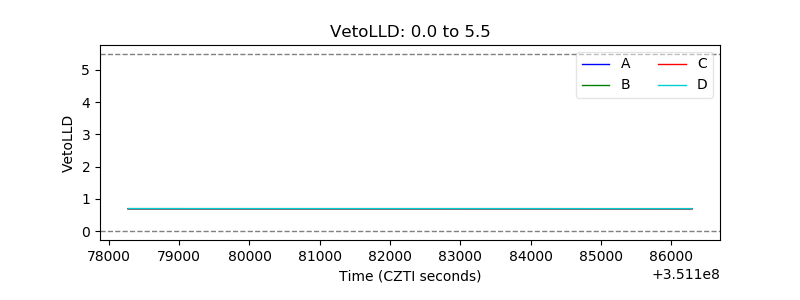 |
| Alpha Counter | 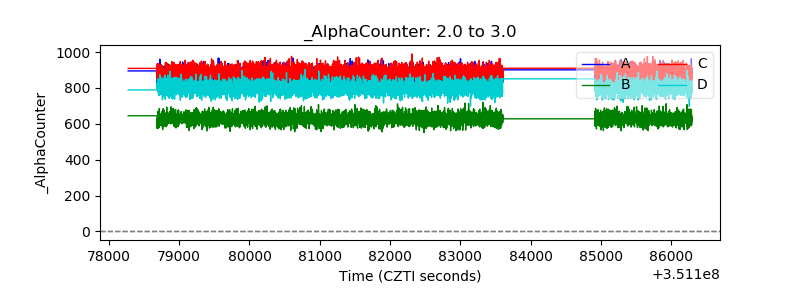 |
| _CPM_Rate | 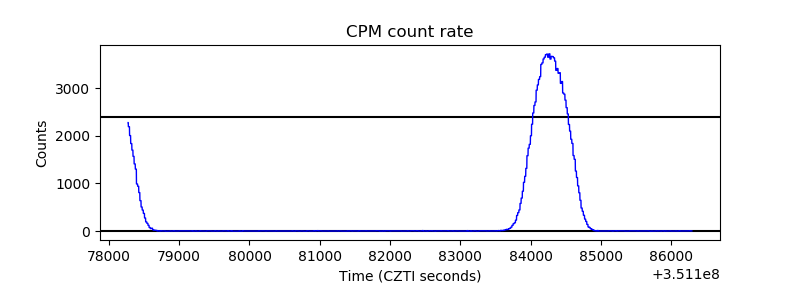 |
| CZT Counter | 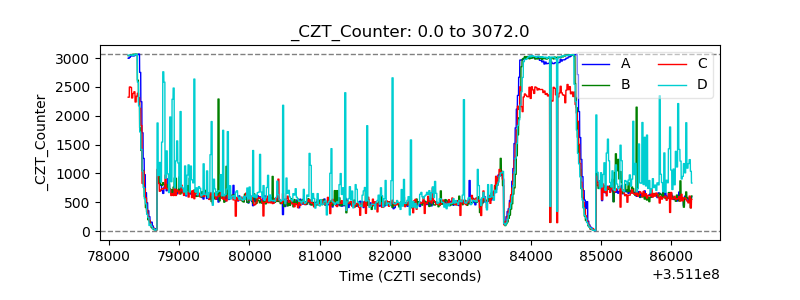 |
| +2.5 Volts monitor | 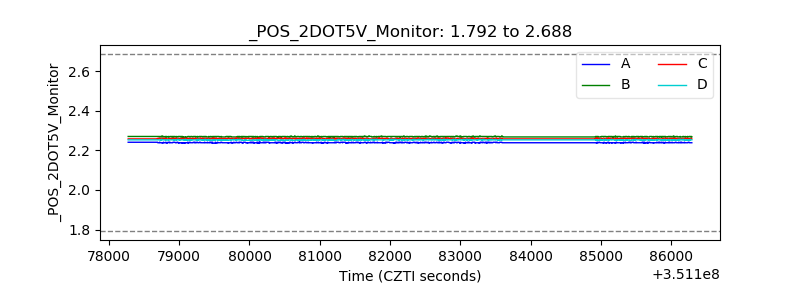 |
| +5 Volts monitor | 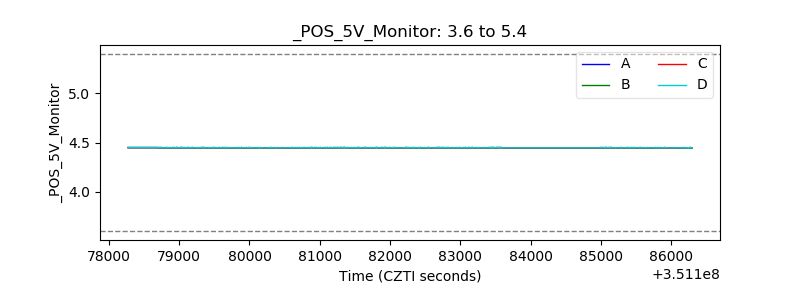 |
| _ROLL_ROT | 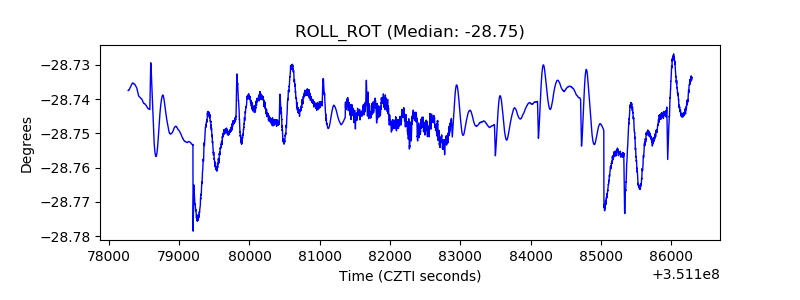 |
| _Roll_DEC | 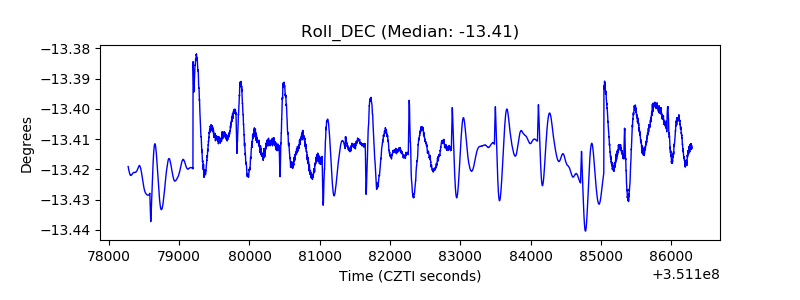 |
| _Roll_RA | 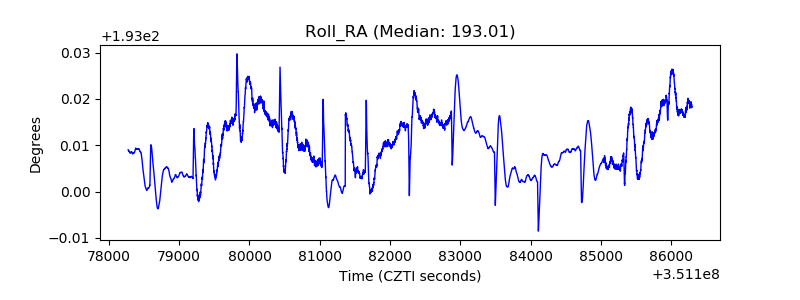 |
| Veto Counter | 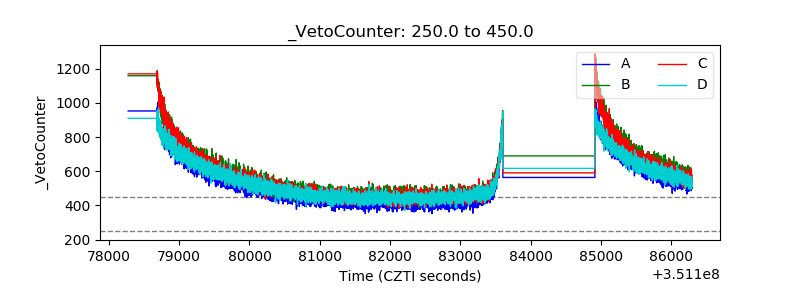 |