| Param | Original file | Final file |
|---|---|---|
| Filename | modeM0/AS1A10_099T01_9000004184_29138cztM0_level2.evt | modeM0/AS1A10_099T01_9000004184_29138cztM0_level2_quad_clean.evt |
| Size (bytes) | 531,506,880 | 90,610,560 |
| Size | 506.9 MB | 86.4 MB |
| Events in quadrant A | 3,455,516 | 595,745 |
| Events in quadrant B | 3,573,167 | 605,684 |
| Events in quadrant C | 3,475,704 | 569,500 |
| Events in quadrant D | 5,177,222 | 545,151 |
| Mode M9 | |||
|---|---|---|---|
| Quadrant | BADHDUFLAG | Total packets | Discarded packets |
| A | 0 | 26 | 0 |
| B | 0 | 26 | 0 |
| C | 0 | 26 | 0 |
| D | 0 | 26 | 0 |
| Mode SS | |||
|---|---|---|---|
| Quadrant | BADHDUFLAG | Total packets | Discarded packets |
| A | 0 | 128 | 0 |
| B | 0 | 128 | 0 |
| C | 0 | 128 | 0 |
| D | 0 | 128 | 0 |
| Mode M0 | |||
|---|---|---|---|
| Quadrant | BADHDUFLAG | Total packets | Discarded packets |
| A | 0 | 14306 | 2 |
| B | 0 | 14581 | 2 |
| C | 0 | 14282 | 2 |
| D | 0 | 19710 | 3 |
| Quadrant | Total seconds | Saturated seconds | Saturation percentage |
|---|---|---|---|
| A | 6124 | 115 | 1.877858% |
| B | 6125 | 134 | 2.187755% |
| C | 6125 | 170 | 2.775510% |
| D | 6124 | 295 | 4.817113% |
Noise dominated data is calculated using 1-second bins in cleaned event files. If a bin has >2000 counts, and if more than 50% of those come from <1% of pixels, then it is considered to be noise-dominated and hence unusable.
| Quadrant | # 1 sec bins | Bins with >0 counts | Bins with >2000 counts | High rate bins dominated by noise | Noise dominated (total time) | Noise dominated (detector-on time) | Marked lightcurve |
|---|---|---|---|---|---|---|---|
| A | 8804 | 6126 | 0 | 0 | 0.00% | 0.00% | 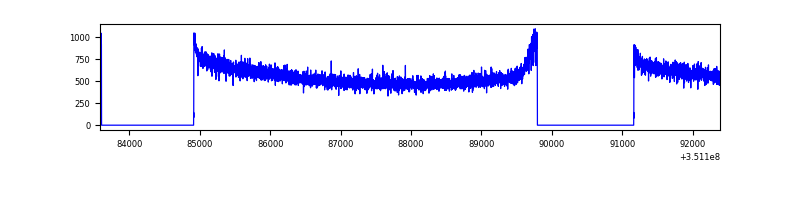 |
| B | 8805 | 6127 | 5 | 5 | 0.06% | 0.08% | 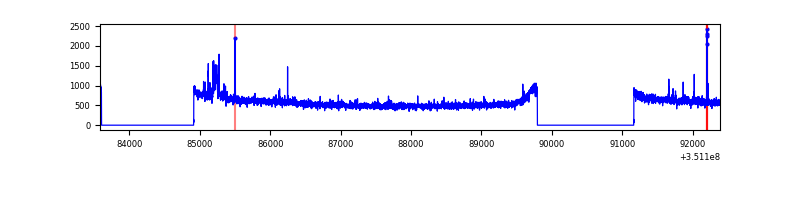 |
| C | 8805 | 6127 | 0 | 0 | 0.00% | 0.00% | 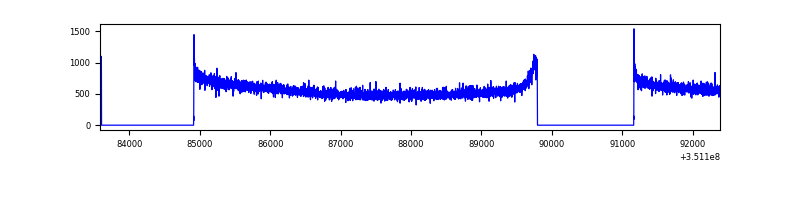 |
| D | 8804 | 6126 | 138 | 138 | 1.57% | 2.25% | 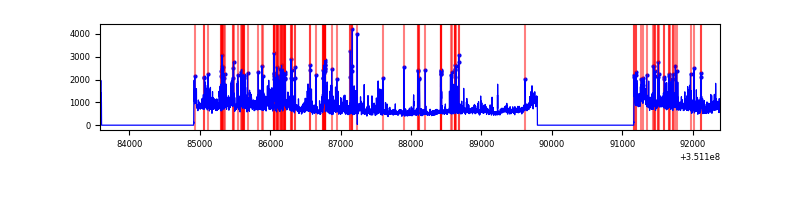 |
Top three noisy pixels from each quadrant. If the there are fewer than three noisy pixels in the level2.evt file, extra rows are filled as -1
| Pixel properties | Quadrant properties | ||||||
|---|---|---|---|---|---|---|---|
| Quadrant | DetID | PixID | Counts | Sigma | Mean | Median | Sigma |
| A | 13 | 254 | 10835 | 56.17 | 895 | 881 | 177.2 |
| A | 3 | 137 | 8143 | 40.98 | 895 | 881 | 177.2 |
| A | 0 | 226 | 7606 | 37.95 | 895 | 881 | 177.2 |
| B | 0 | 190 | 48370 | 287.68 | 887 | 869 | 165.1 |
| B | 12 | 111 | 19547 | 113.12 | 887 | 869 | 165.1 |
| B | 11 | 111 | 17621 | 101.46 | 887 | 869 | 165.1 |
| C | 14 | 238 | 138142 | 705.18 | 844 | 856 | 194.7 |
| C | 3 | 233 | 26218 | 130.27 | 844 | 856 | 194.7 |
| C | 2 | 114 | 14654 | 70.87 | 844 | 856 | 194.7 |
| D | 1 | 52 | 1187579 | 6145.15 | 834 | 815 | 193.1 |
| D | 8 | 195 | 700021 | 3620.54 | 834 | 815 | 193.1 |
| D | 12 | 233 | 69296 | 354.6 | 834 | 815 | 193.1 |
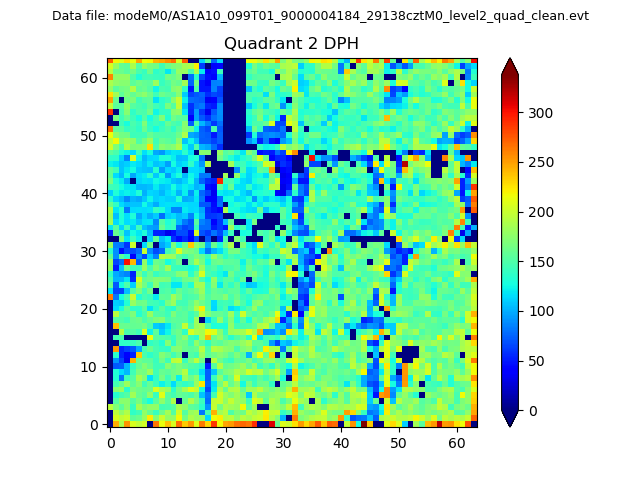
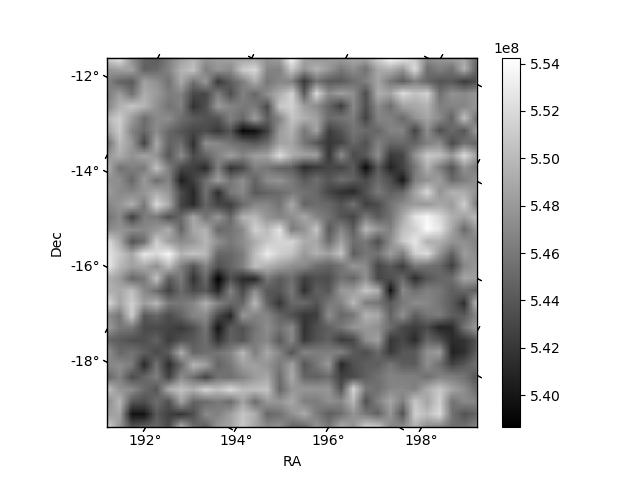
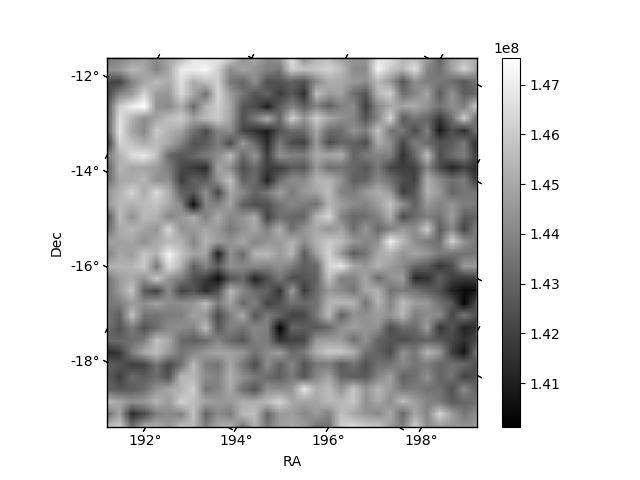
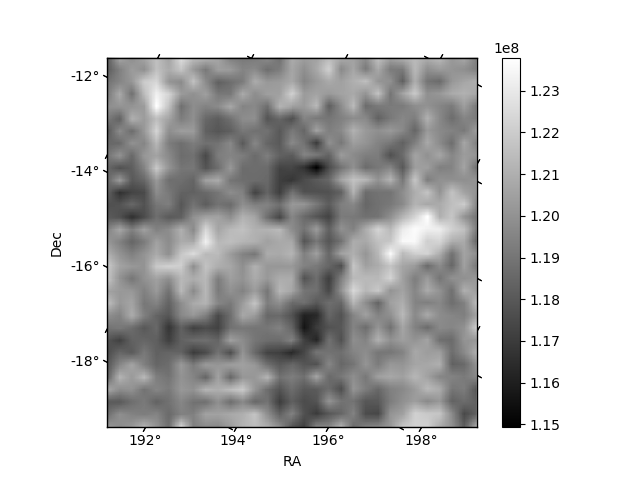
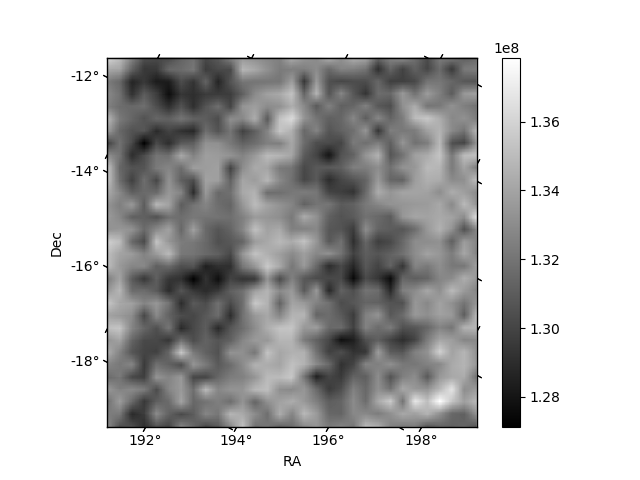
Histogram calculated using DETX and DETY for each event in the final _common_clean file
| Quadrant A | 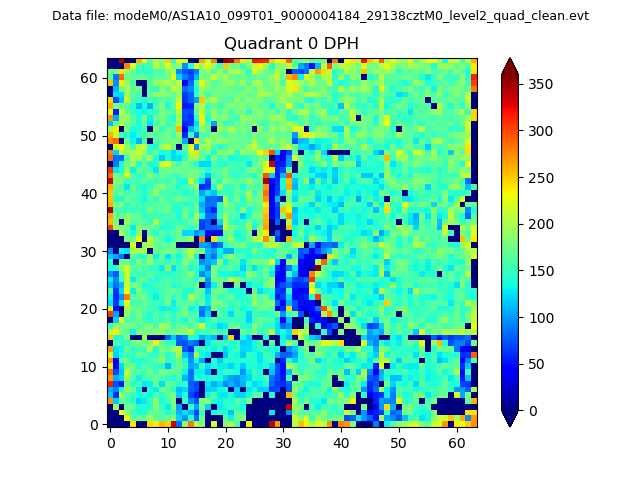 |
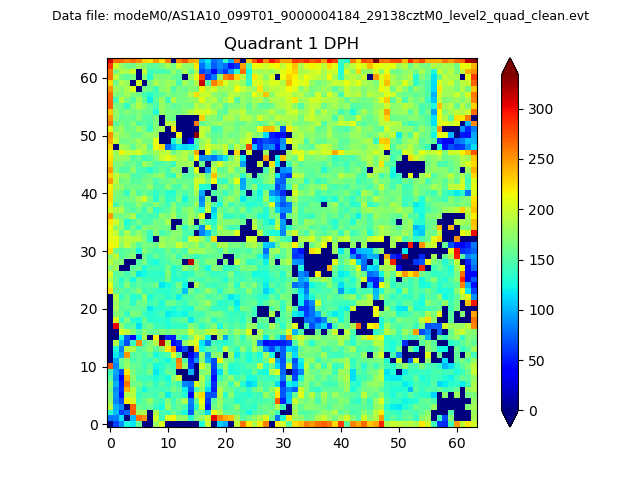 |
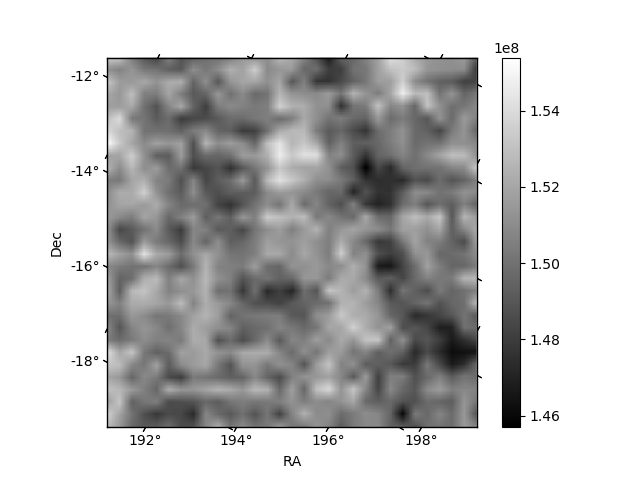
Quadrant B |
|---|---|---|---|
| Quadrant D | 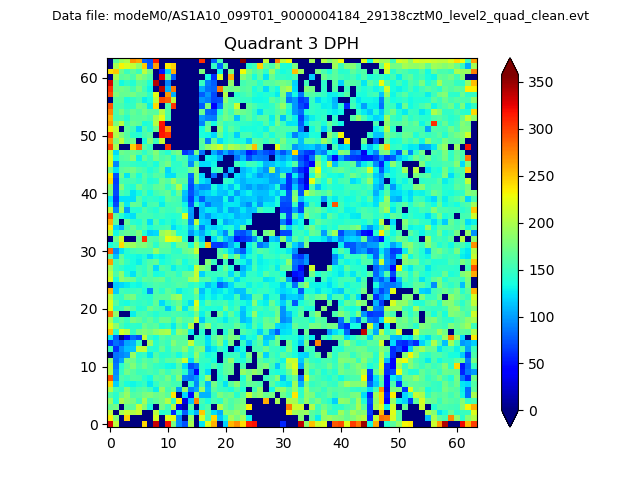 |
 |
Quadrant C |
| Plot type | Count rate plots | Images |
|---|---|---|
| Comparison with Poisson distribution Blue bars denote a histogram of data divided into 1 sec bins. Red curve is a Poisson curve with rate = median count rate of data. |
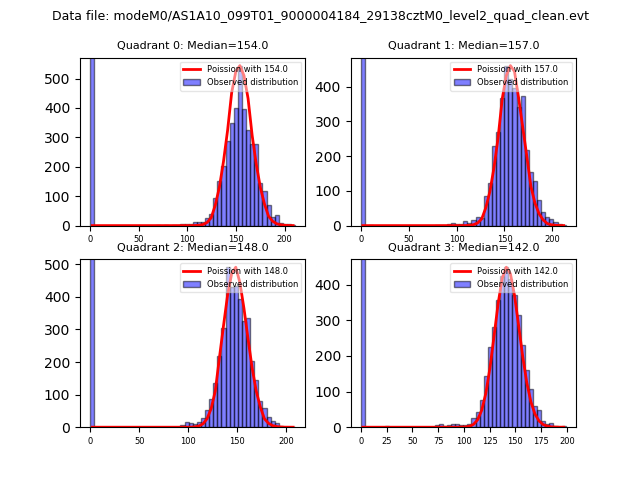 |
 |
| Quadrant-wise count rates Data is divided into 100 sec bins |
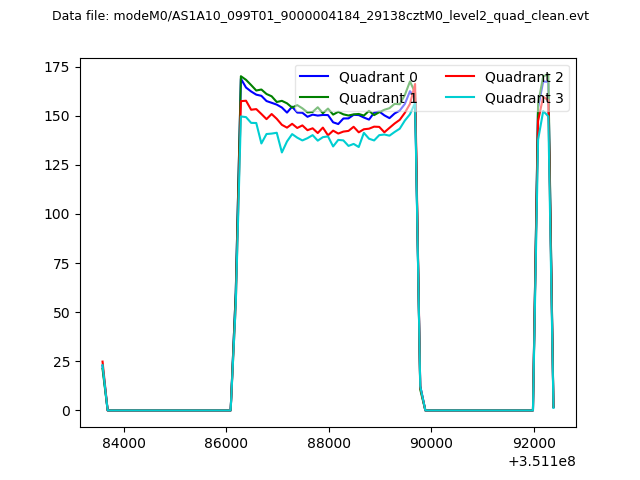 |
|
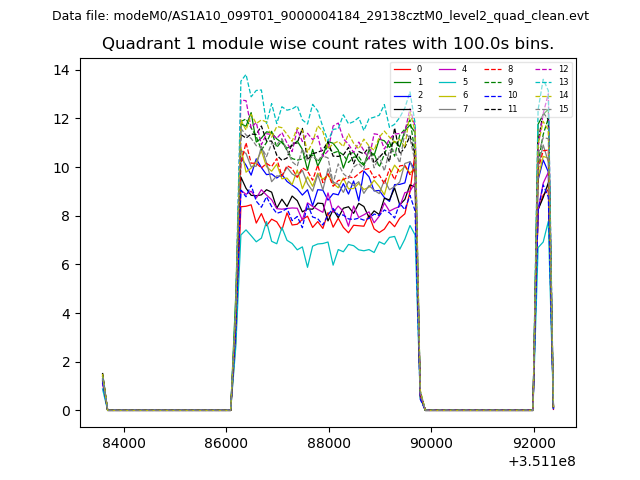
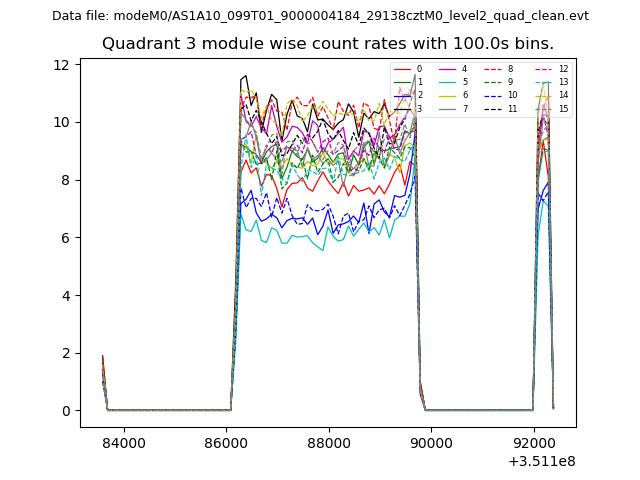
| Module-wise count rates for Quadrant A Data is divided into 100 sec bins |
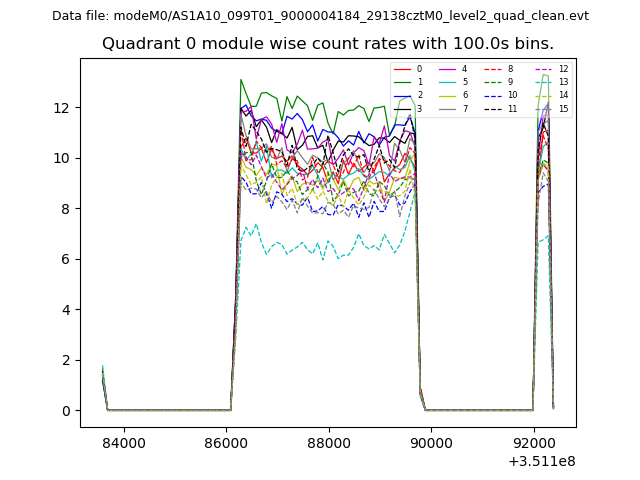 |
 |
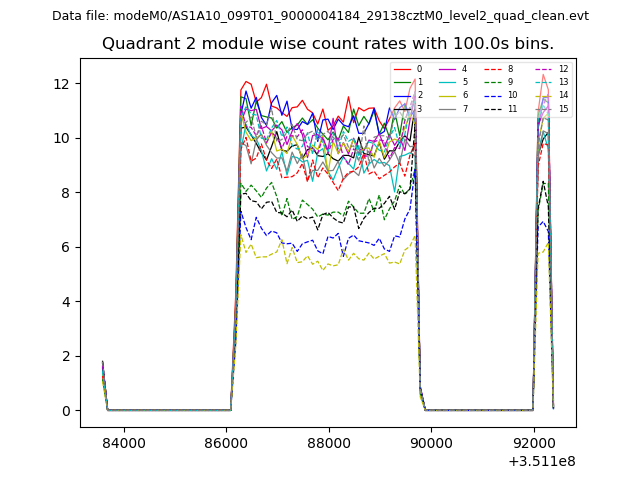
| Module-wise count rates for Quadrant B Data is divided into 100 sec bins |
 |
 |
| Module-wise count rates for Quadrant C Data is divided into 100 sec bins |
 |
 |
| Module-wise count rates for Quadrant D Data is divided into 100 sec bins |
 |
 |
| Parameter | Plot |
|---|---|
| CZT HV Monitor | 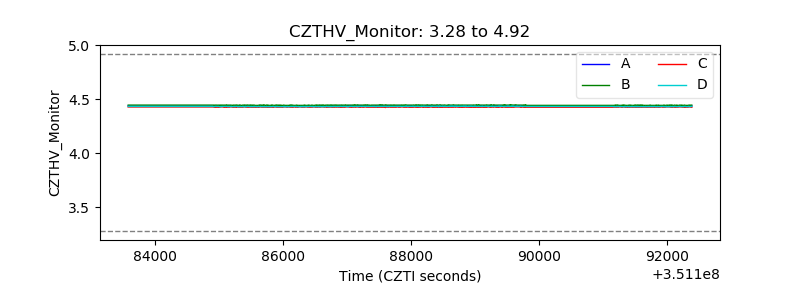 |
| D_VDD | 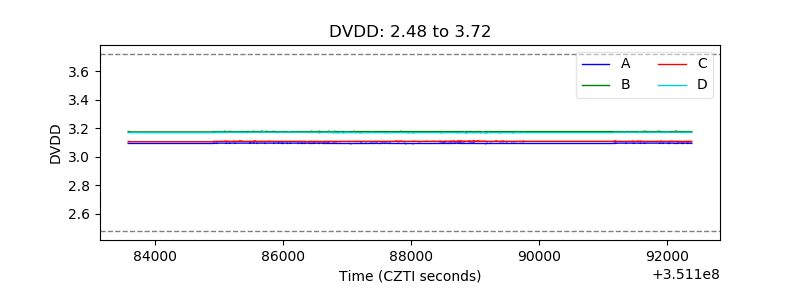 |
| Temperature 1 | 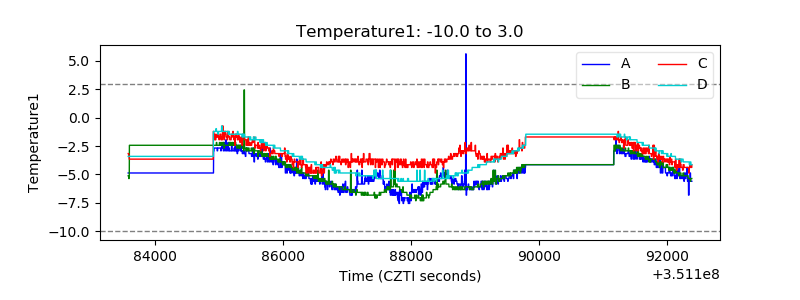 |
| Veto HV Monitor | 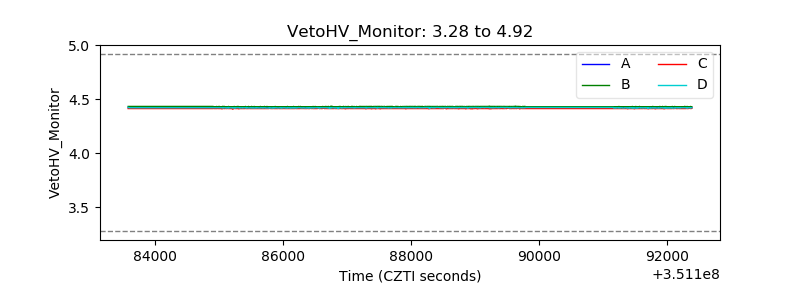 |
| Veto LLD | 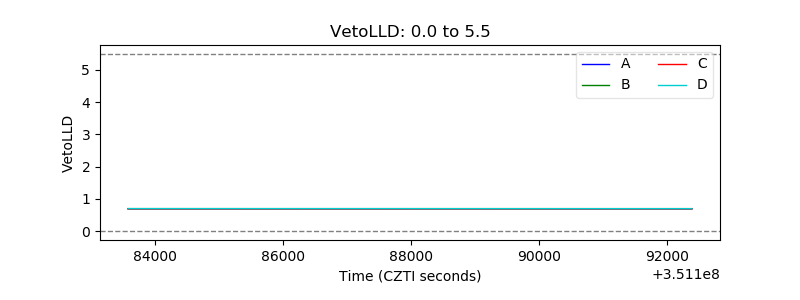 |
| Alpha Counter | 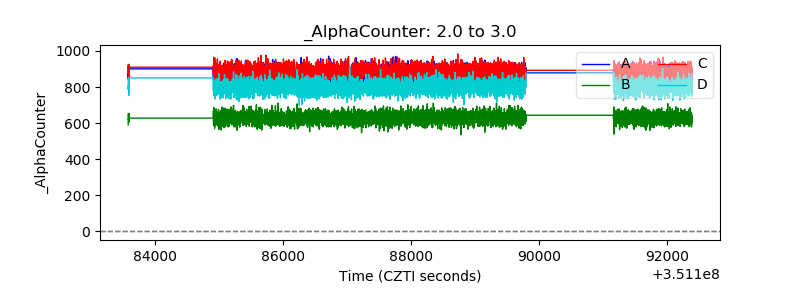 |
| _CPM_Rate | 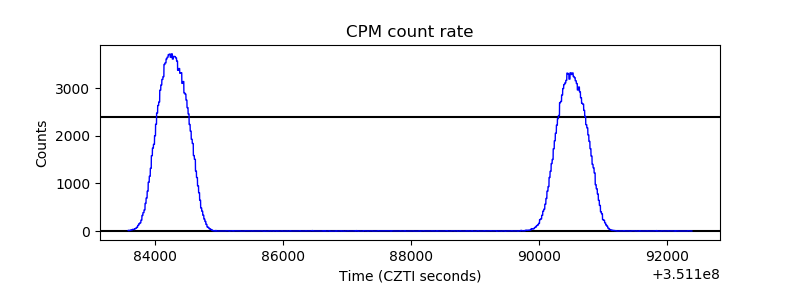 |
| CZT Counter | 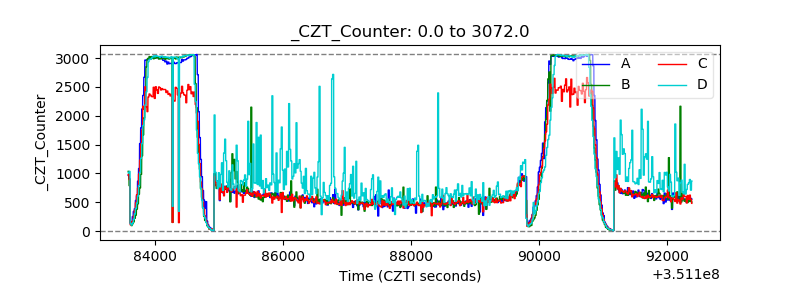 |
| +2.5 Volts monitor |  |
| +5 Volts monitor | 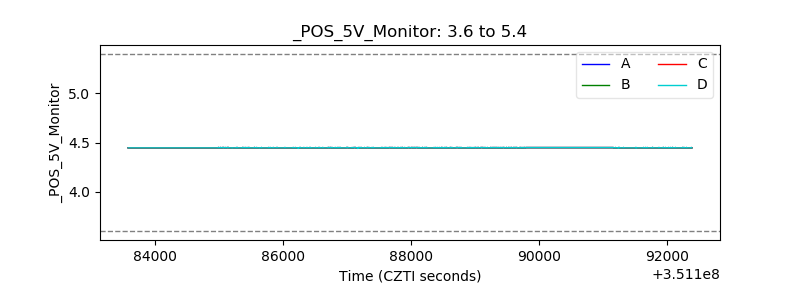 |
| _ROLL_ROT | 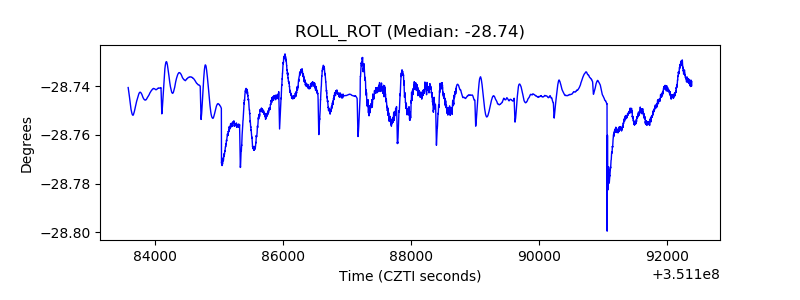 |
| _Roll_DEC | 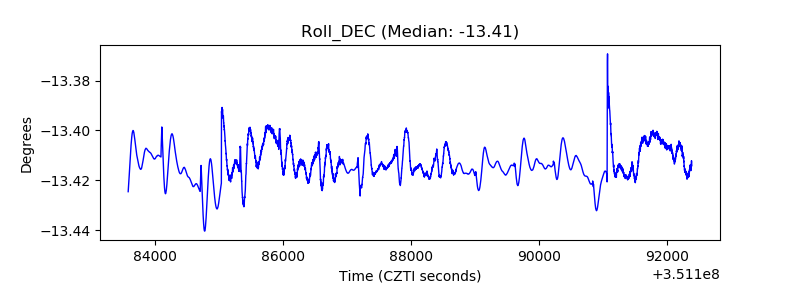 |
| _Roll_RA | 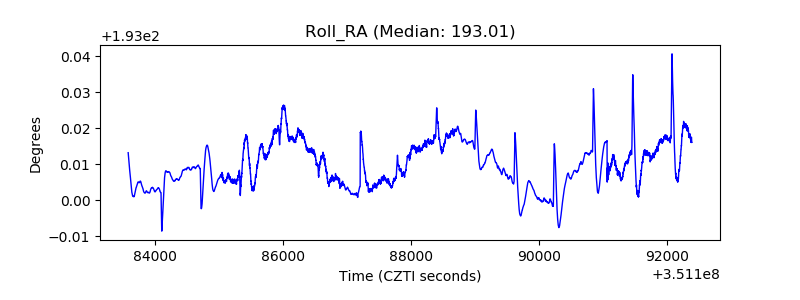 |
| Veto Counter | 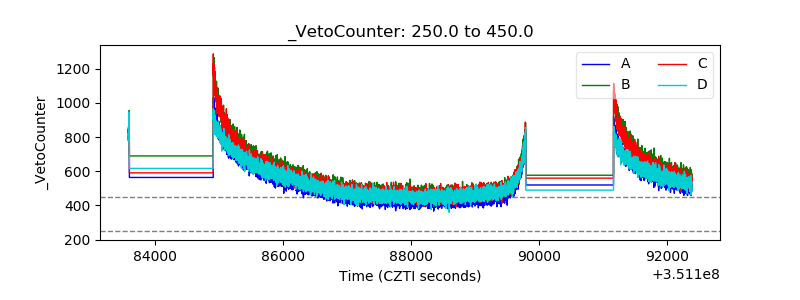 |