| Param | Original file | Final file |
|---|---|---|
| Filename | modeM0/AS1A10_099T01_9000004184_29139cztM0_level2.evt | modeM0/AS1A10_099T01_9000004184_29139cztM0_level2_quad_clean.evt |
| Size (bytes) | 510,690,240 | 97,755,840 |
| Size | 487.0 MB | 93.2 MB |
| Events in quadrant A | 3,321,429 | 651,790 |
| Events in quadrant B | 3,448,785 | 665,408 |
| Events in quadrant C | 3,364,295 | 620,876 |
| Events in quadrant D | 4,914,087 | 592,446 |
| Mode M9 | |||
|---|---|---|---|
| Quadrant | BADHDUFLAG | Total packets | Discarded packets |
| A | 0 | 24 | 0 |
| B | 0 | 25 | 0 |
| C | 0 | 25 | 0 |
| D | 0 | 25 | 0 |
| Mode SS | |||
|---|---|---|---|
| Quadrant | BADHDUFLAG | Total packets | Discarded packets |
| A | 0 | 124 | 0 |
| B | 0 | 124 | 0 |
| C | 0 | 124 | 0 |
| D | 0 | 124 | 0 |
| Mode M0 | |||
|---|---|---|---|
| Quadrant | BADHDUFLAG | Total packets | Discarded packets |
| A | 0 | 13724 | 2 |
| B | 0 | 14163 | 2 |
| C | 0 | 13785 | 2 |
| D | 0 | 18814 | 2 |
| Quadrant | Total seconds | Saturated seconds | Saturation percentage |
|---|---|---|---|
| A | 6157 | 101 | 1.640409% |
| B | 6157 | 129 | 2.095176% |
| C | 6157 | 148 | 2.403768% |
| D | 6157 | 255 | 4.141627% |
Noise dominated data is calculated using 1-second bins in cleaned event files. If a bin has >2000 counts, and if more than 50% of those come from <1% of pixels, then it is considered to be noise-dominated and hence unusable.
| Quadrant | # 1 sec bins | Bins with >0 counts | Bins with >2000 counts | High rate bins dominated by noise | Noise dominated (total time) | Noise dominated (detector-on time) | Marked lightcurve |
|---|---|---|---|---|---|---|---|
| A | 7482 | 6158 | 0 | 0 | 0.00% | 0.00% | 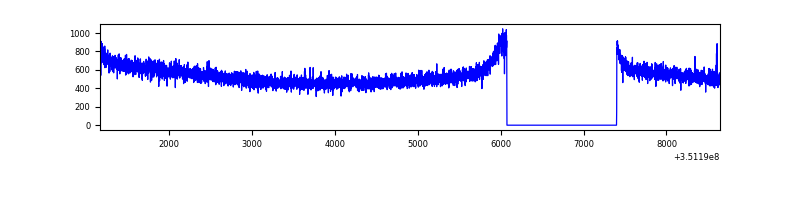 |
| B | 7482 | 6158 | 11 | 11 | 0.15% | 0.18% | 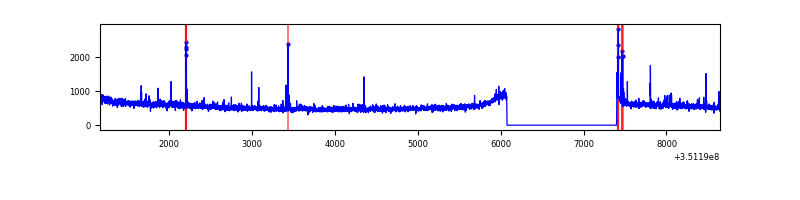 |
| C | 7482 | 6158 | 0 | 0 | 0.00% | 0.00% | 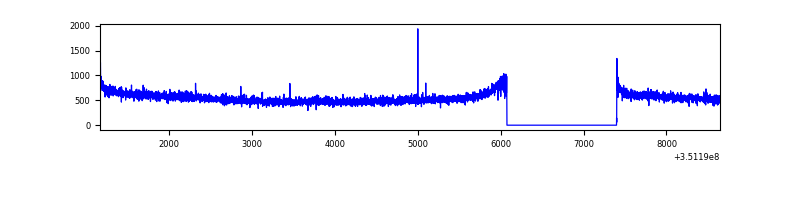 |
| D | 7482 | 6158 | 116 | 116 | 1.55% | 1.88% | 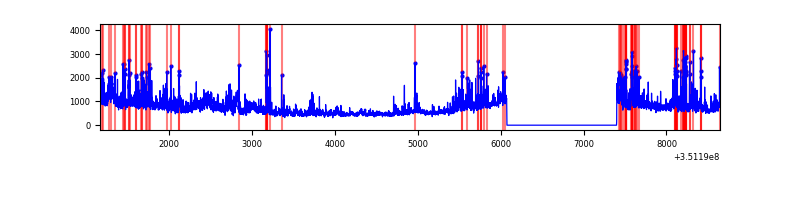 |
Top three noisy pixels from each quadrant. If the there are fewer than three noisy pixels in the level2.evt file, extra rows are filled as -1
| Pixel properties | Quadrant properties | ||||||
|---|---|---|---|---|---|---|---|
| Quadrant | DetID | PixID | Counts | Sigma | Mean | Median | Sigma |
| A | 13 | 254 | 10820 | 57.98 | 859 | 845 | 172.1 |
| A | 3 | 137 | 7865 | 40.8 | 859 | 845 | 172.1 |
| A | 0 | 226 | 7316 | 37.61 | 859 | 845 | 172.1 |
| B | 0 | 229 | 37554 | 230.77 | 854 | 836 | 159.1 |
| B | 10 | 246 | 26870 | 163.62 | 854 | 836 | 159.1 |
| B | 0 | 183 | 23580 | 142.94 | 854 | 836 | 159.1 |
| C | 14 | 238 | 132129 | 692.85 | 814 | 822 | 189.5 |
| C | 3 | 233 | 39127 | 202.12 | 814 | 822 | 189.5 |
| C | 2 | 114 | 14613 | 72.77 | 814 | 822 | 189.5 |
| D | 1 | 52 | 1000857 | 5235.35 | 805 | 785 | 191.0 |
| D | 8 | 195 | 709171 | 3708.38 | 805 | 785 | 191.0 |
| D | 12 | 233 | 75156 | 389.33 | 805 | 785 | 191.0 |
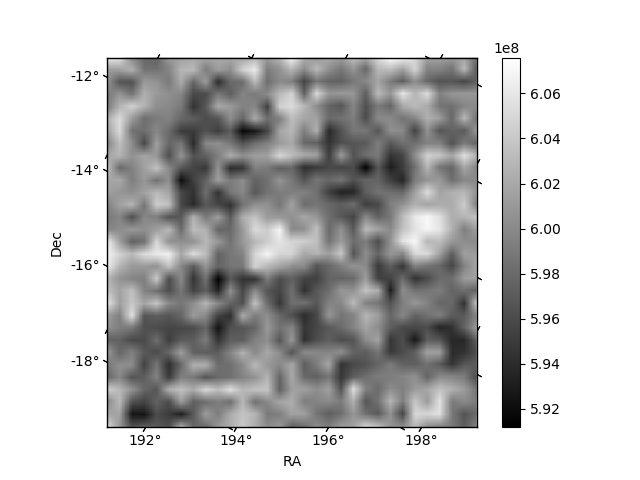
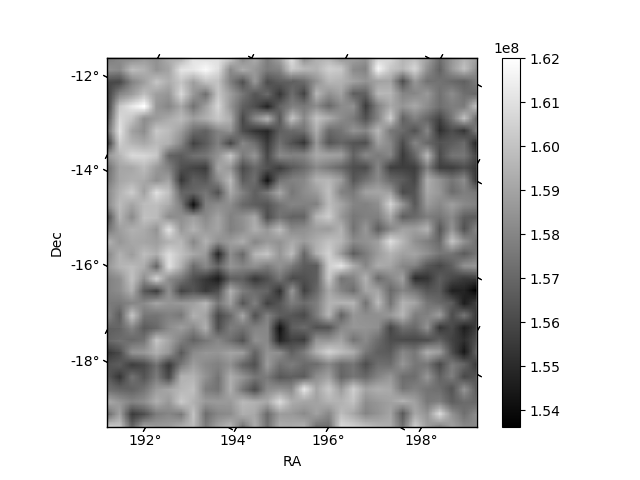
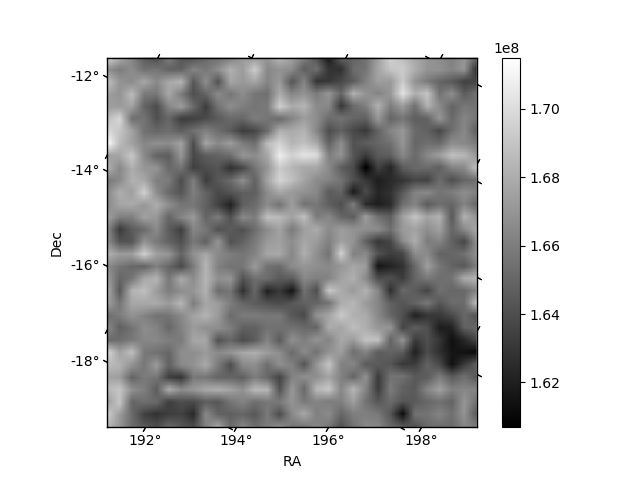
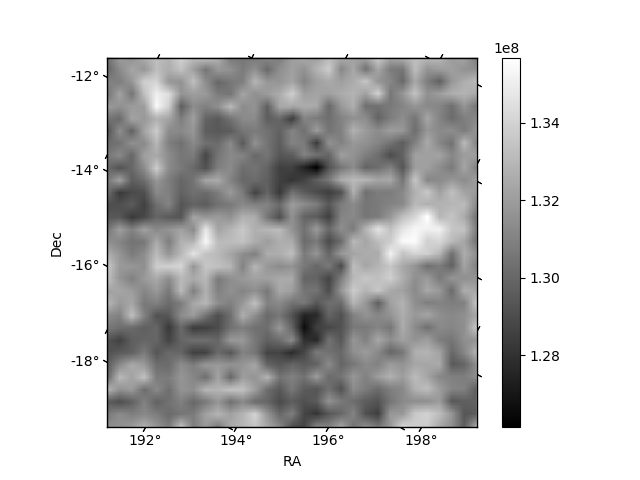
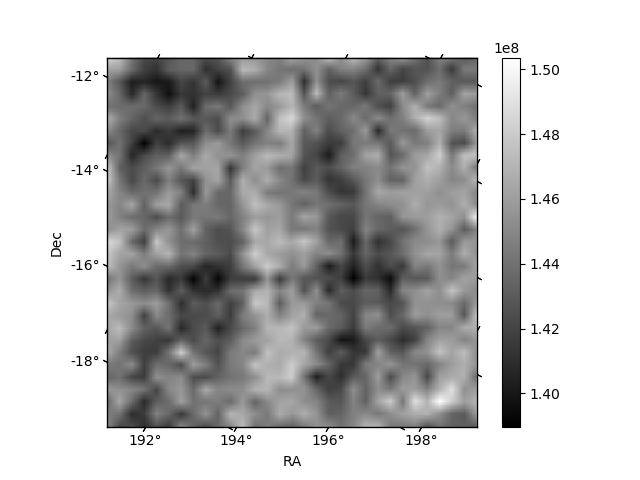
Histogram calculated using DETX and DETY for each event in the final _common_clean file
| Quadrant A | 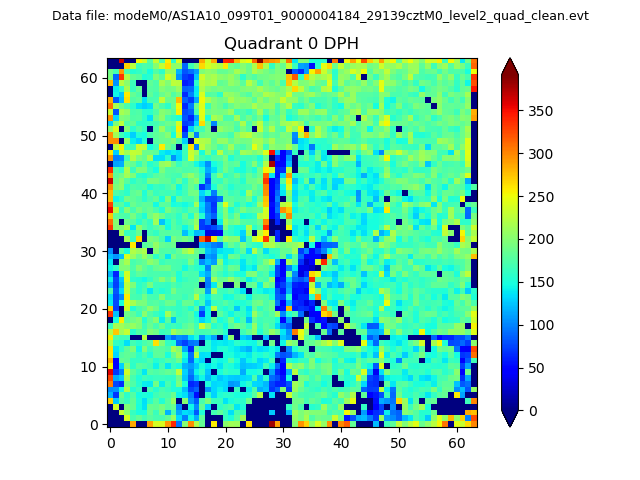 |
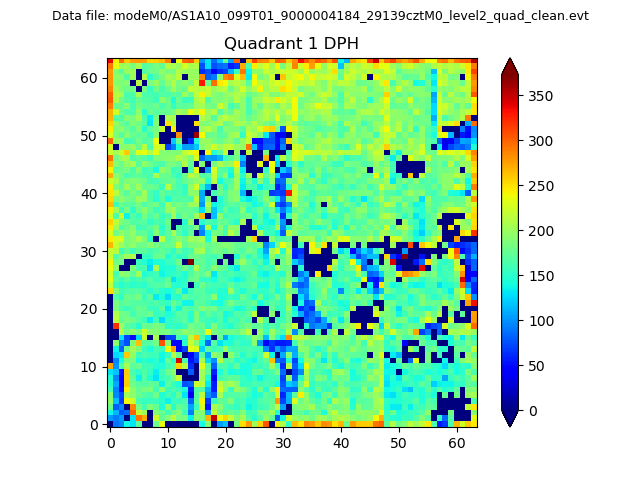 |
Quadrant B |
|---|---|---|---|
| Quadrant D | 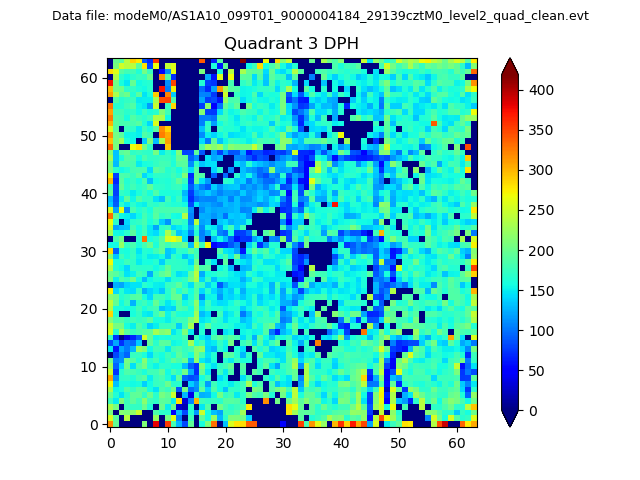 |
 |
Quadrant C |
| Plot type | Count rate plots | Images |
|---|---|---|
| Comparison with Poisson distribution Blue bars denote a histogram of data divided into 1 sec bins. Red curve is a Poisson curve with rate = median count rate of data. |
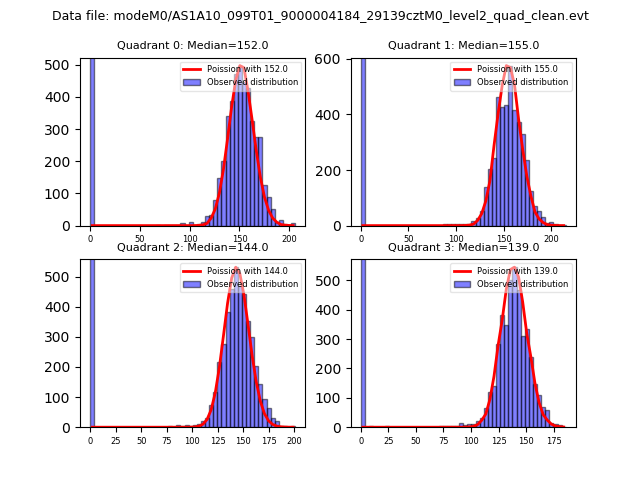 |
 |
| Quadrant-wise count rates Data is divided into 100 sec bins |
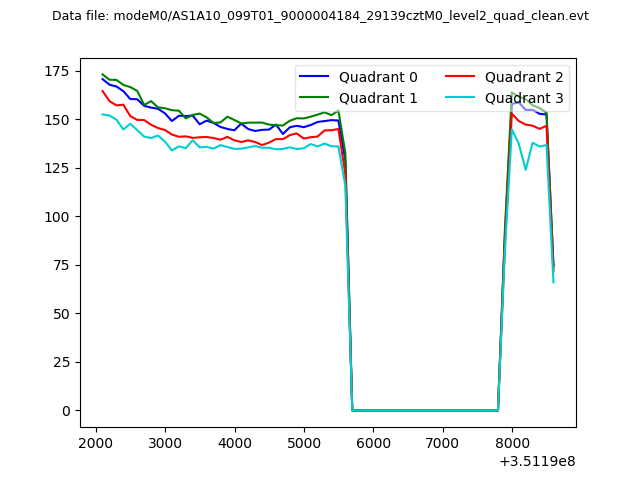 |
|
| Module-wise count rates for Quadrant A Data is divided into 100 sec bins |
 |
 |
| Module-wise count rates for Quadrant B Data is divided into 100 sec bins |
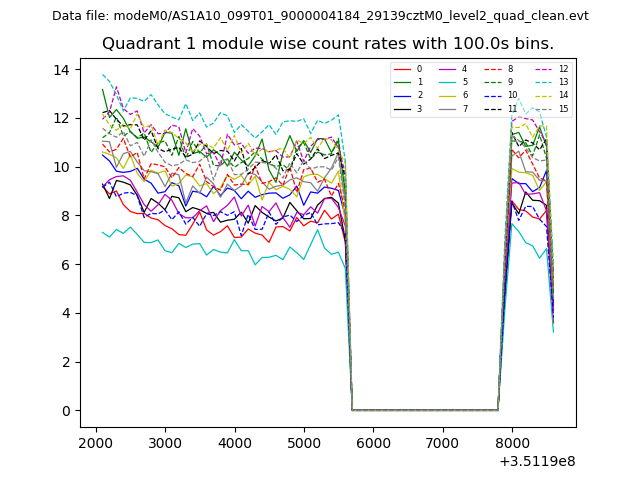 |
 |
| Module-wise count rates for Quadrant C Data is divided into 100 sec bins |
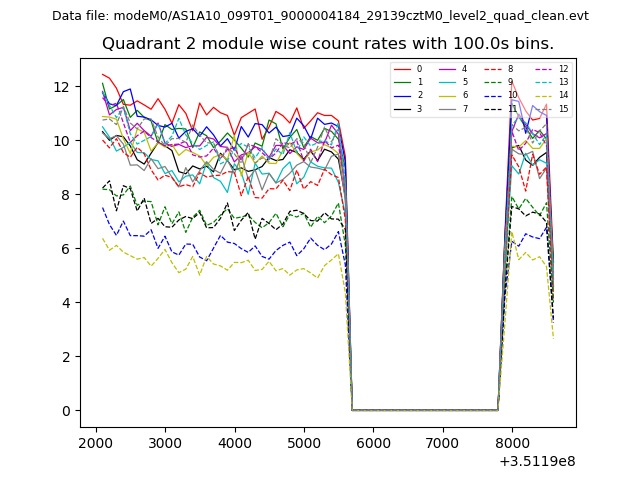 |
 |
| Module-wise count rates for Quadrant D Data is divided into 100 sec bins |
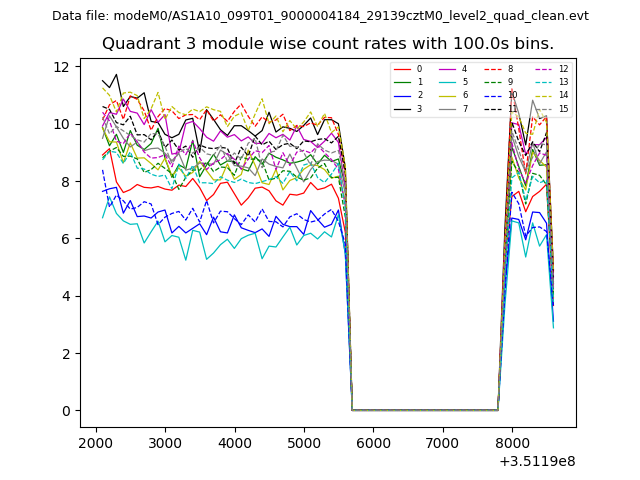 |
 |
| Parameter | Plot |
|---|---|
| CZT HV Monitor | 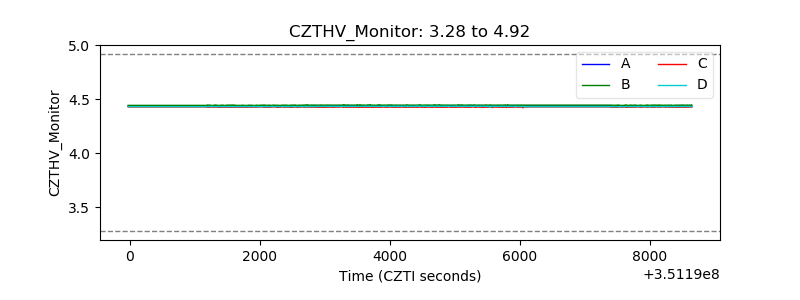 |
| D_VDD | 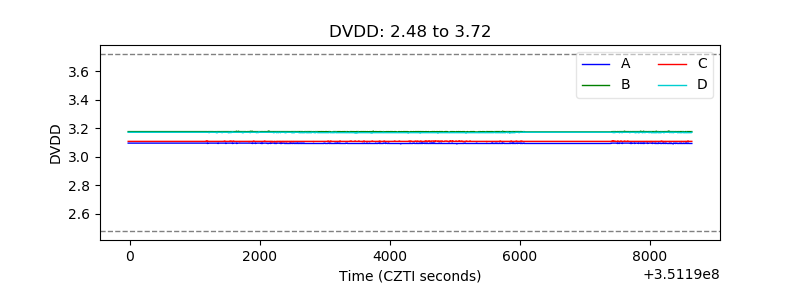 |
| Temperature 1 | 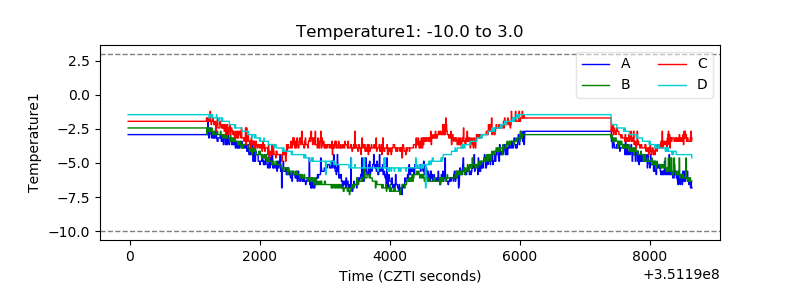 |
| Veto HV Monitor | 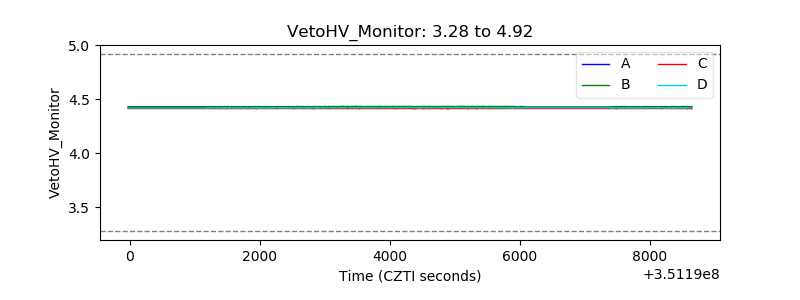 |
| Veto LLD | 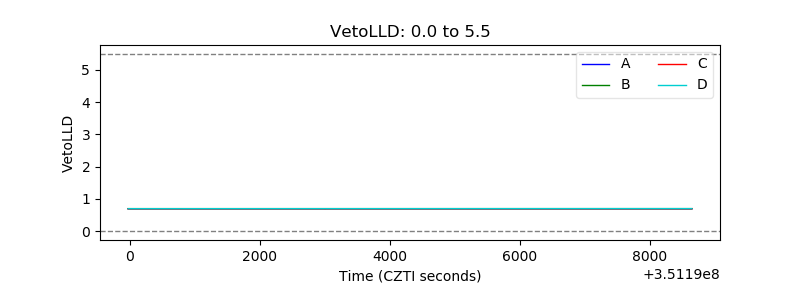 |
| Alpha Counter | 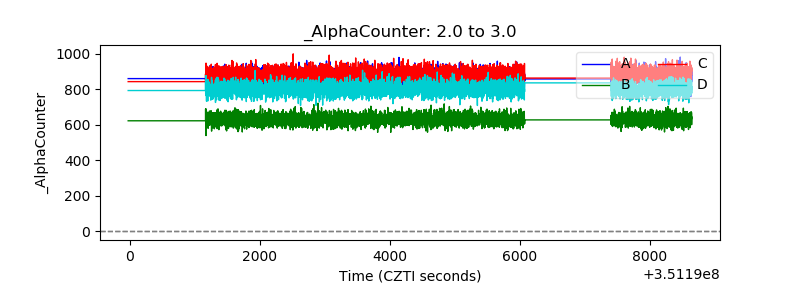 |
| _CPM_Rate | 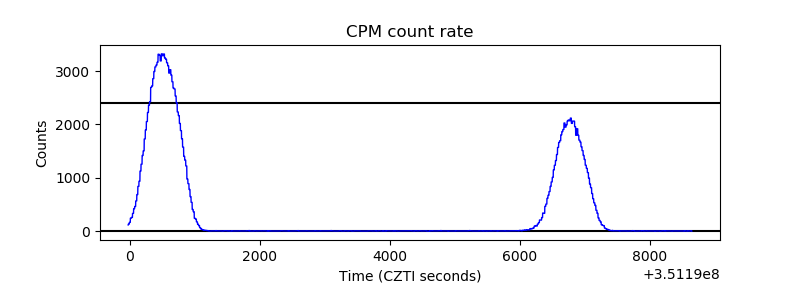 |
| CZT Counter | 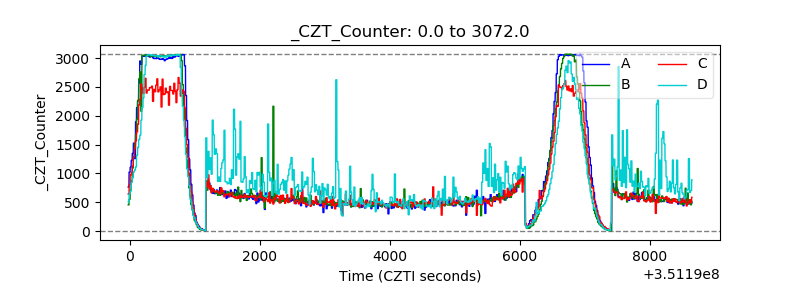 |
| +2.5 Volts monitor | 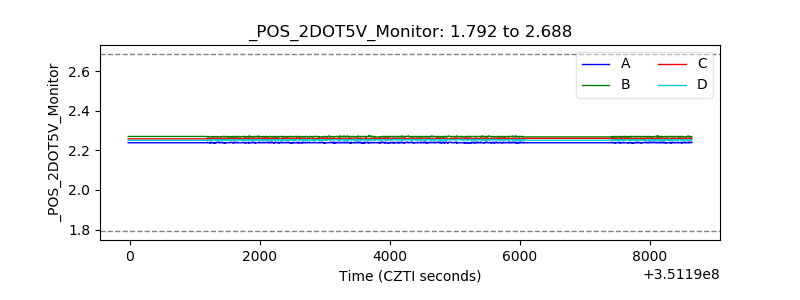 |
| +5 Volts monitor | 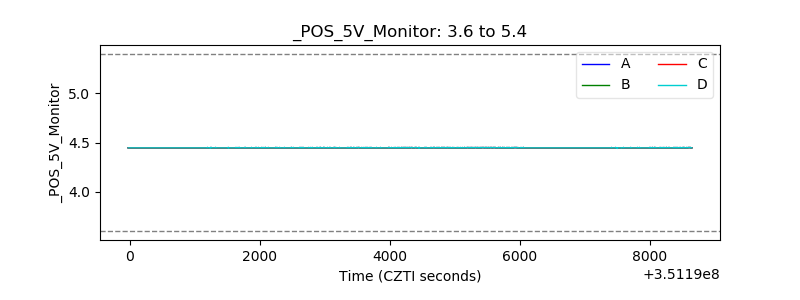 |
| _ROLL_ROT | 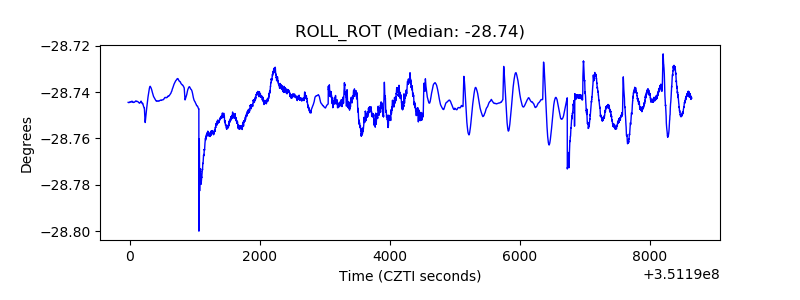 |
| _Roll_DEC | 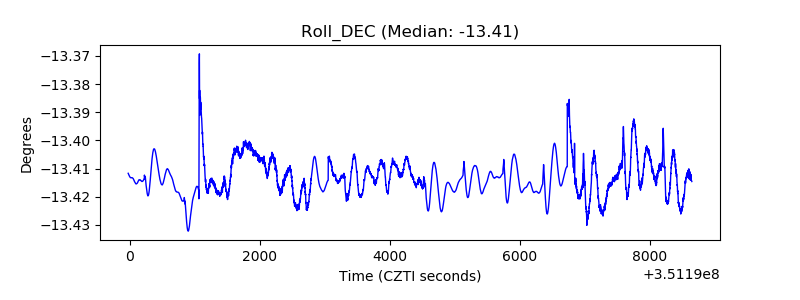 |
| _Roll_RA | 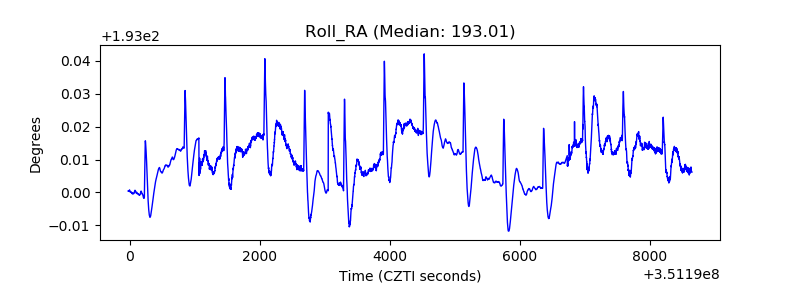 |
| Veto Counter | 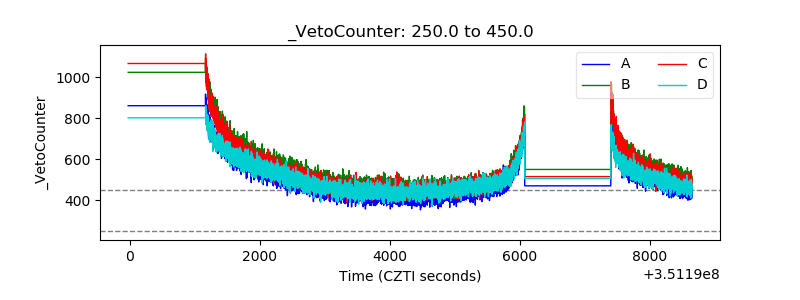 |