| Param | Original file | Final file |
|---|---|---|
| Filename | modeM0/AS1A10_099T01_9000004184_29143cztM0_level2.evt | modeM0/AS1A10_099T01_9000004184_29143cztM0_level2_quad_clean.evt |
| Size (bytes) | 636,099,840 | 120,712,320 |
| Size | 606.6 MB | 115.1 MB |
| Events in quadrant A | 4,217,701 | 774,630 |
| Events in quadrant B | 4,335,564 | 792,610 |
| Events in quadrant C | 4,382,796 | 754,880 |
| Events in quadrant D | 5,741,212 | 732,421 |
| Mode M9 | |||
|---|---|---|---|
| Quadrant | BADHDUFLAG | Total packets | Discarded packets |
| A | 0 | 3 | 0 |
| B | 0 | 3 | 0 |
| C | 0 | 3 | 0 |
| D | 0 | 3 | 0 |
| Mode SS | |||
|---|---|---|---|
| Quadrant | BADHDUFLAG | Total packets | Discarded packets |
| A | 0 | 178 | 0 |
| B | 0 | 178 | 0 |
| C | 0 | 178 | 0 |
| D | 0 | 178 | 0 |
| Mode M0 | |||
|---|---|---|---|
| Quadrant | BADHDUFLAG | Total packets | Discarded packets |
| A | 0 | 18169 | 2 |
| B | 0 | 18457 | 2 |
| C | 0 | 18476 | 2 |
| D | 0 | 23038 | 2 |
| Quadrant | Total seconds | Saturated seconds | Saturation percentage |
|---|---|---|---|
| A | 8650 | 100 | 1.156069% |
| B | 8650 | 159 | 1.838150% |
| C | 8650 | 219 | 2.531792% |
| D | 8651 | 312 | 3.606519% |
Noise dominated data is calculated using 1-second bins in cleaned event files. If a bin has >2000 counts, and if more than 50% of those come from <1% of pixels, then it is considered to be noise-dominated and hence unusable.
| Quadrant | # 1 sec bins | Bins with >0 counts | Bins with >2000 counts | High rate bins dominated by noise | Noise dominated (total time) | Noise dominated (detector-on time) | Marked lightcurve |
|---|---|---|---|---|---|---|---|
| A | 9035 | 8652 | 0 | 0 | 0.00% | 0.00% | 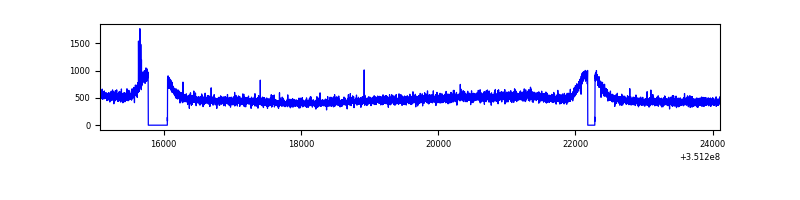 |
| B | 9035 | 8652 | 1 | 1 | 0.01% | 0.01% | 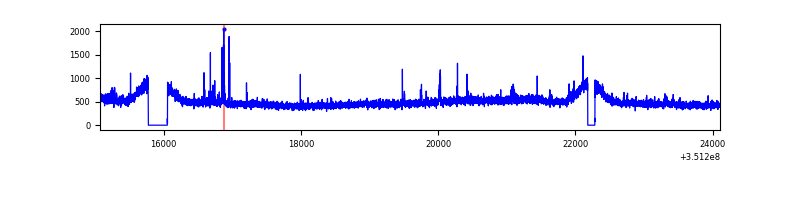 |
| C | 9035 | 8652 | 0 | 0 | 0.00% | 0.00% | 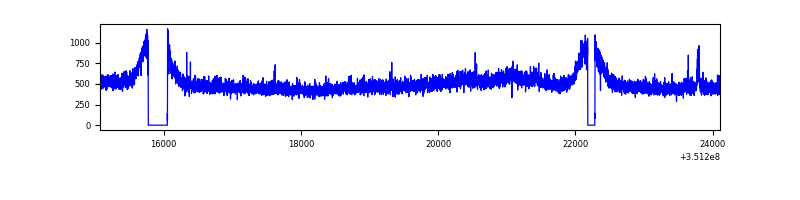 |
| D | 9036 | 8653 | 188 | 188 | 2.08% | 2.17% | 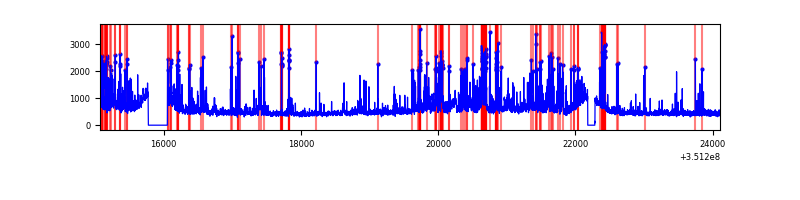 |
Top three noisy pixels from each quadrant. If the there are fewer than three noisy pixels in the level2.evt file, extra rows are filled as -1
| Pixel properties | Quadrant properties | ||||||
|---|---|---|---|---|---|---|---|
| Quadrant | DetID | PixID | Counts | Sigma | Mean | Median | Sigma |
| A | 13 | 254 | 14969 | 62.66 | 1088 | 1064 | 221.9 |
| A | 11 | 29 | 12747 | 52.65 | 1088 | 1064 | 221.9 |
| A | 3 | 137 | 11228 | 45.8 | 1088 | 1064 | 221.9 |
| B | 0 | 183 | 36725 | 169.39 | 1081 | 1051 | 210.6 |
| B | 10 | 246 | 30025 | 137.58 | 1081 | 1051 | 210.6 |
| B | 12 | 111 | 27451 | 125.35 | 1081 | 1051 | 210.6 |
| C | 14 | 238 | 167134 | 665.61 | 1048 | 1052 | 249.5 |
| C | 3 | 233 | 112257 | 445.68 | 1048 | 1052 | 249.5 |
| C | 2 | 114 | 20697 | 78.73 | 1048 | 1052 | 249.5 |
| D | 1 | 52 | 1193425 | 4746.9 | 1042 | 1012 | 251.2 |
| D | 8 | 195 | 479665 | 1905.48 | 1042 | 1012 | 251.2 |
| D | 2 | 120 | 57986 | 226.81 | 1042 | 1012 | 251.2 |
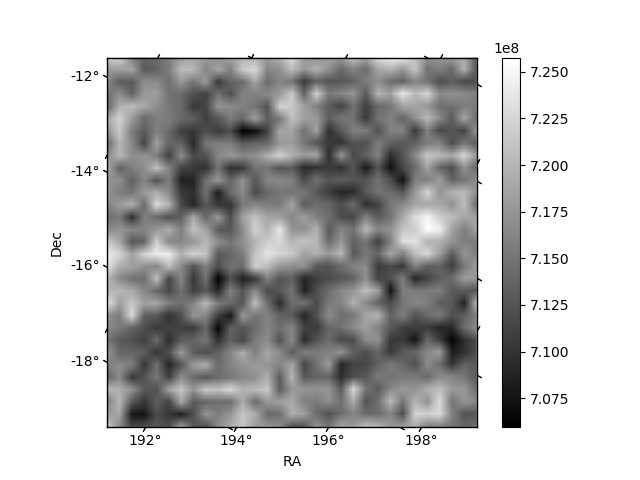
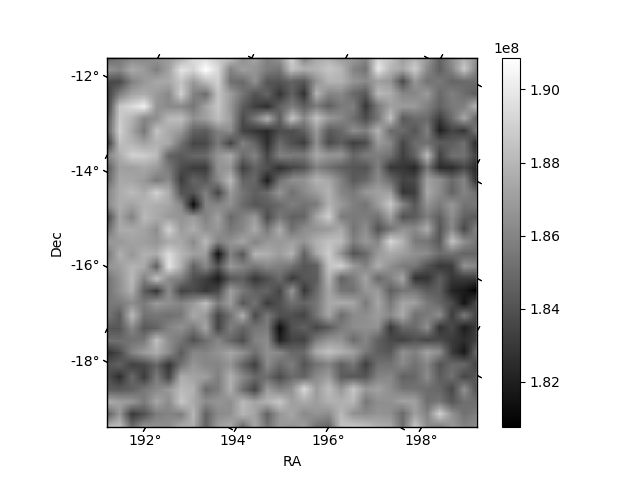
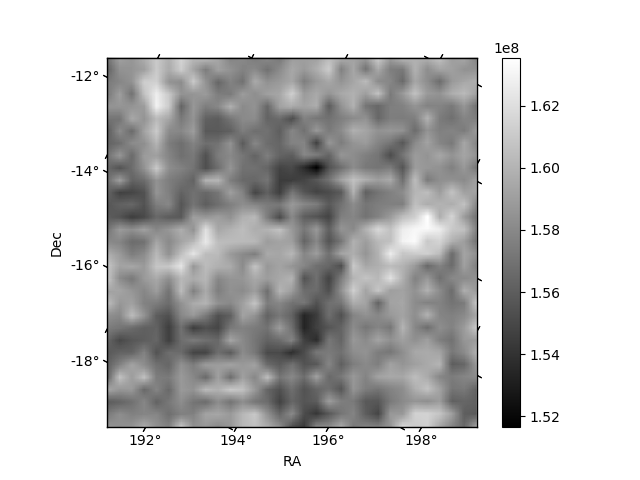
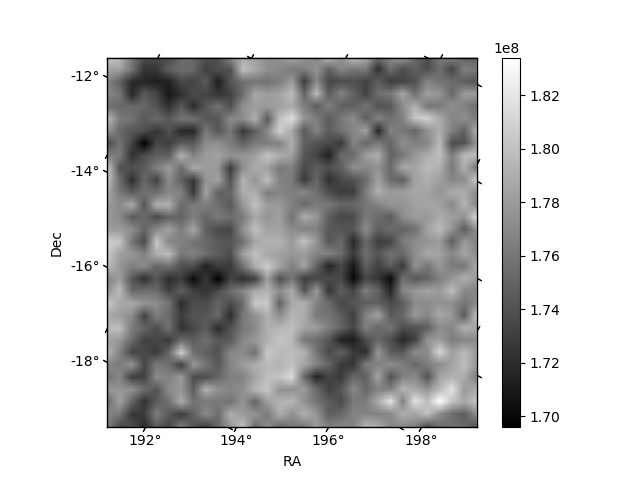
Histogram calculated using DETX and DETY for each event in the final _common_clean file
| Quadrant A |  |
 |
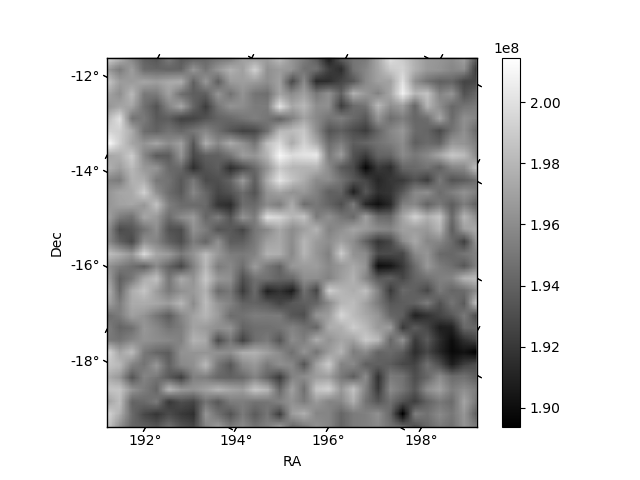
Quadrant B |
|---|---|---|---|
| Quadrant D |  |
 |
Quadrant C |
| Plot type | Count rate plots | Images |
|---|---|---|
| Comparison with Poisson distribution Blue bars denote a histogram of data divided into 1 sec bins. Red curve is a Poisson curve with rate = median count rate of data. |
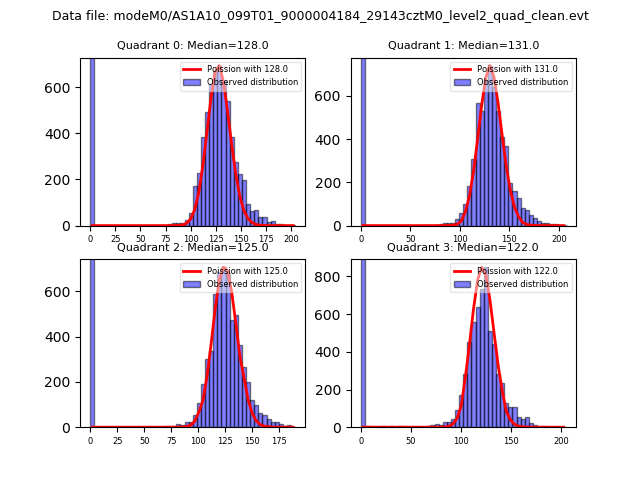 |
 |
| Quadrant-wise count rates Data is divided into 100 sec bins |
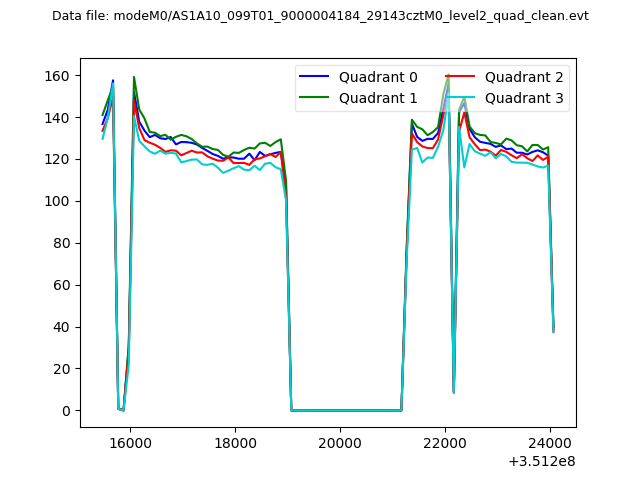 |
|
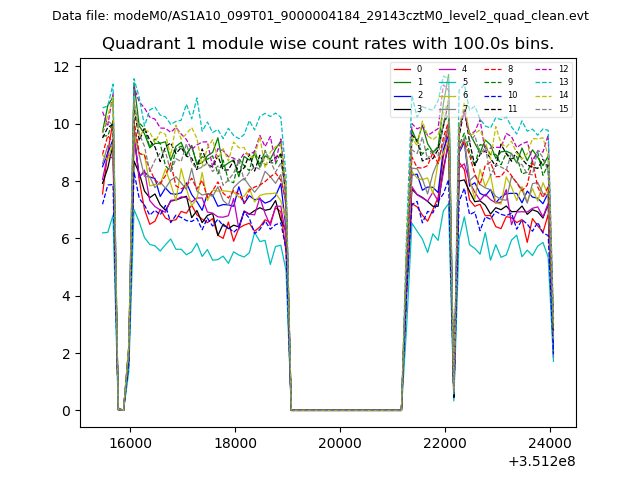
| Module-wise count rates for Quadrant A Data is divided into 100 sec bins |
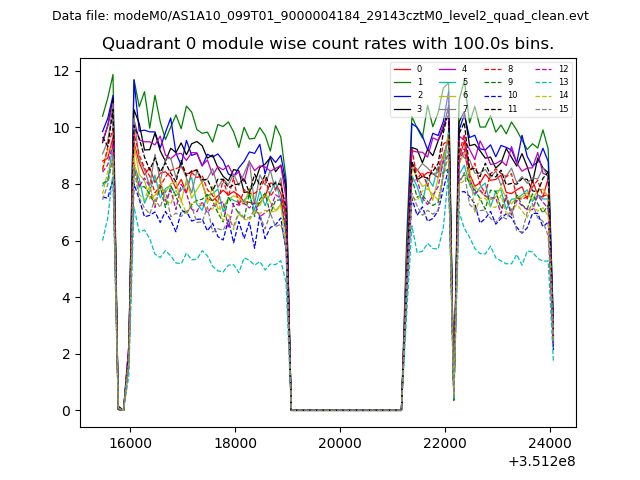 |
 |
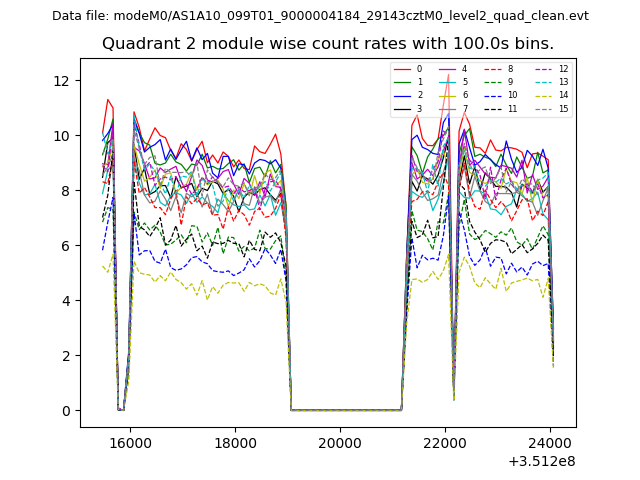
| Module-wise count rates for Quadrant B Data is divided into 100 sec bins |
 |
 |
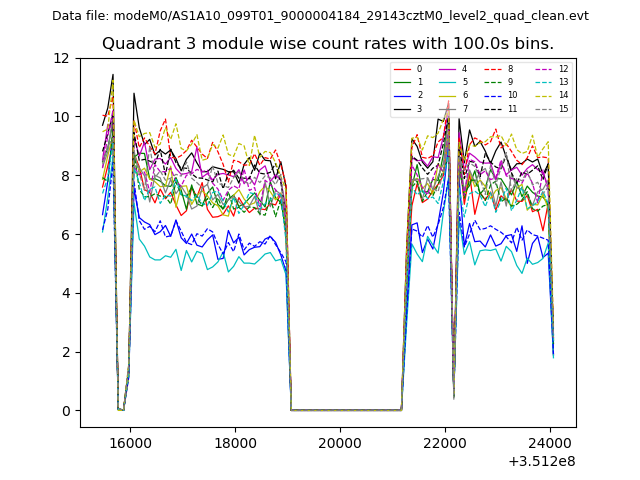
| Module-wise count rates for Quadrant C Data is divided into 100 sec bins |
 |
 |
| Module-wise count rates for Quadrant D Data is divided into 100 sec bins |
 |
 |
| Parameter | Plot |
|---|---|
| CZT HV Monitor | 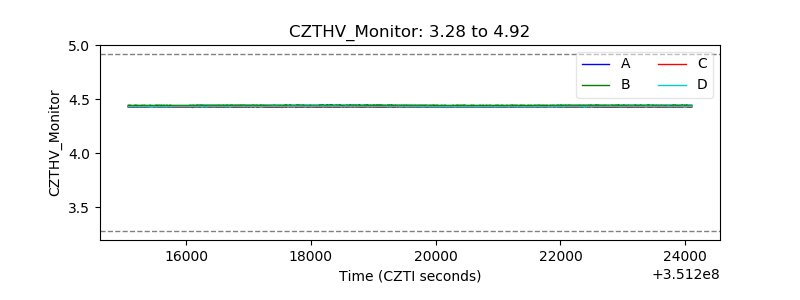 |
| D_VDD | 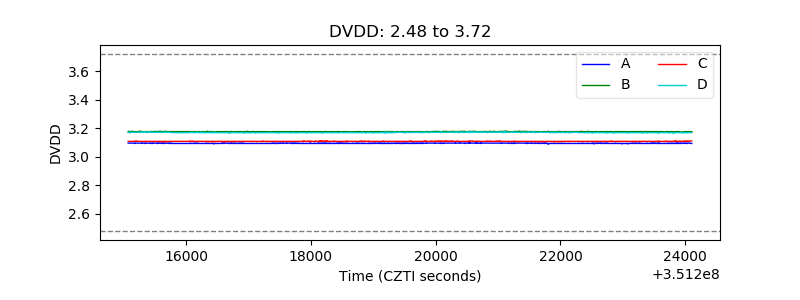 |
| Temperature 1 | 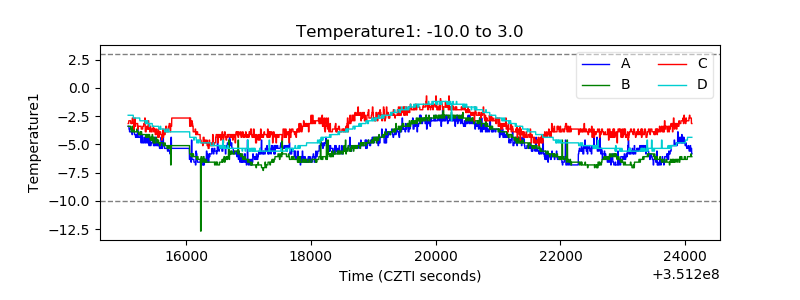 |
| Veto HV Monitor |  |
| Veto LLD | 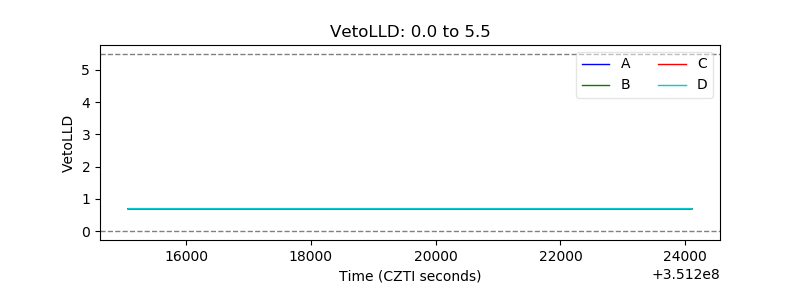 |
| Alpha Counter | 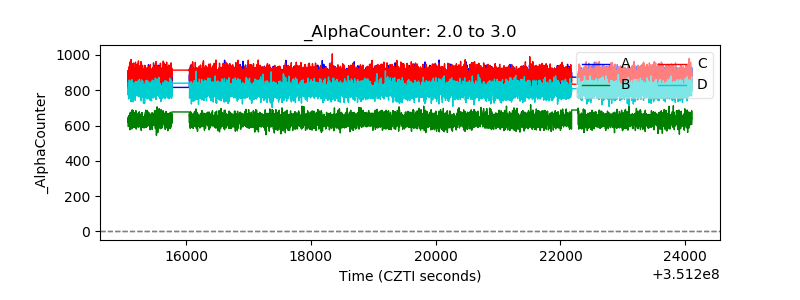 |
| _CPM_Rate | 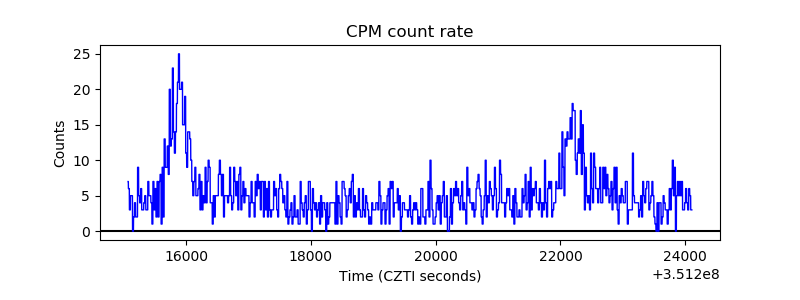 |
| CZT Counter |  |
| +2.5 Volts monitor |  |
| +5 Volts monitor | 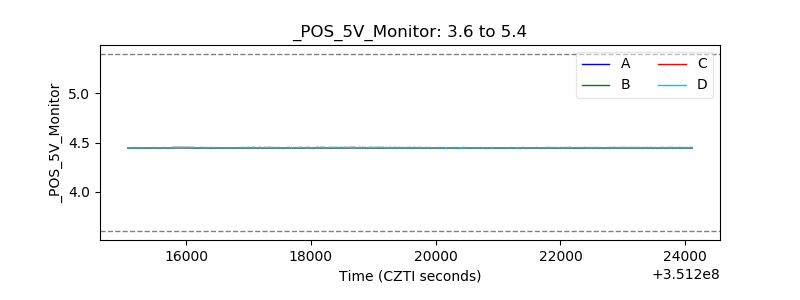 |
| _ROLL_ROT | 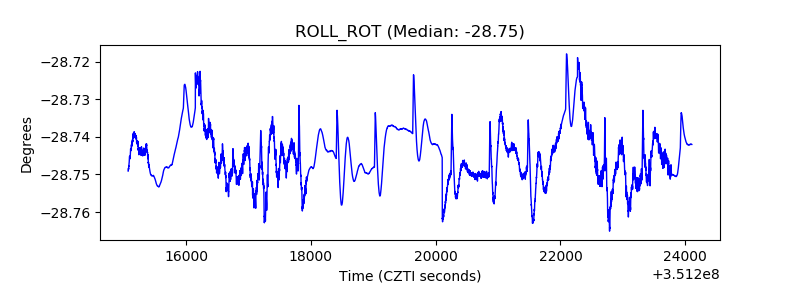 |
| _Roll_DEC |  |
| _Roll_RA | 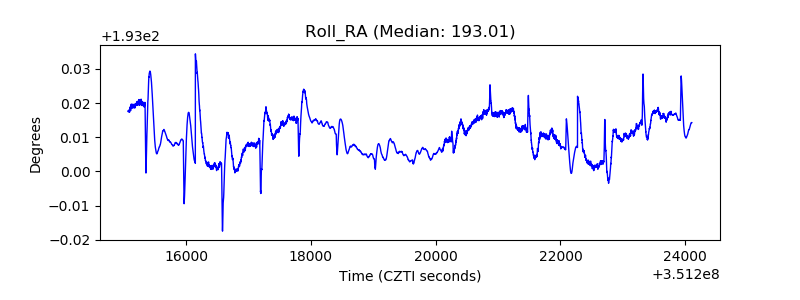 |
| Veto Counter | 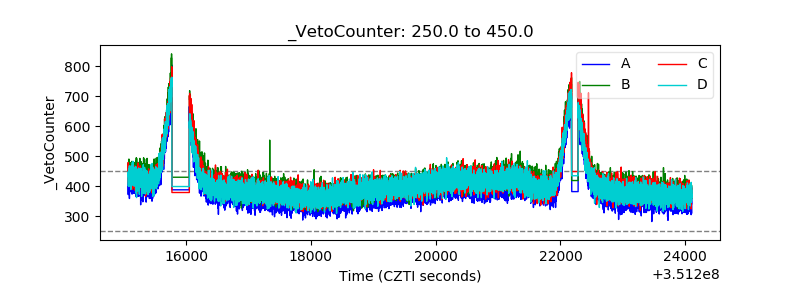 |