| Param | Original file | Final file |
|---|---|---|
| Filename | modeM0/AS1A10_099T01_9000004184_29144cztM0_level2.evt | modeM0/AS1A10_099T01_9000004184_29144cztM0_level2_quad_clean.evt |
| Size (bytes) | 517,550,400 | 98,985,600 |
| Size | 493.6 MB | 94.4 MB |
| Events in quadrant A | 3,370,219 | 631,236 |
| Events in quadrant B | 3,449,422 | 647,410 |
| Events in quadrant C | 3,530,669 | 617,500 |
| Events in quadrant D | 4,831,284 | 596,535 |
| Mode M9 | |||
|---|---|---|---|
| Quadrant | BADHDUFLAG | Total packets | Discarded packets |
| A | 0 | 3 | 0 |
| B | 0 | 3 | 0 |
| C | 0 | 3 | 0 |
| D | 0 | 3 | 0 |
| Mode SS | |||
|---|---|---|---|
| Quadrant | BADHDUFLAG | Total packets | Discarded packets |
| A | 0 | 148 | 0 |
| B | 0 | 148 | 0 |
| C | 0 | 148 | 0 |
| D | 0 | 148 | 0 |
| Mode M0 | |||
|---|---|---|---|
| Quadrant | BADHDUFLAG | Total packets | Discarded packets |
| A | 0 | 14777 | 1 |
| B | 0 | 14939 | 1 |
| C | 0 | 14931 | 1 |
| D | 0 | 19320 | 1 |
| Quadrant | Total seconds | Saturated seconds | Saturation percentage |
|---|---|---|---|
| A | 7250 | 52 | 0.717241% |
| B | 7251 | 57 | 0.786098% |
| C | 7251 | 97 | 1.337747% |
| D | 7251 | 289 | 3.985657% |
Noise dominated data is calculated using 1-second bins in cleaned event files. If a bin has >2000 counts, and if more than 50% of those come from <1% of pixels, then it is considered to be noise-dominated and hence unusable.
| Quadrant | # 1 sec bins | Bins with >0 counts | Bins with >2000 counts | High rate bins dominated by noise | Noise dominated (total time) | Noise dominated (detector-on time) | Marked lightcurve |
|---|---|---|---|---|---|---|---|
| A | 7570 | 7251 | 0 | 0 | 0.00% | 0.00% | 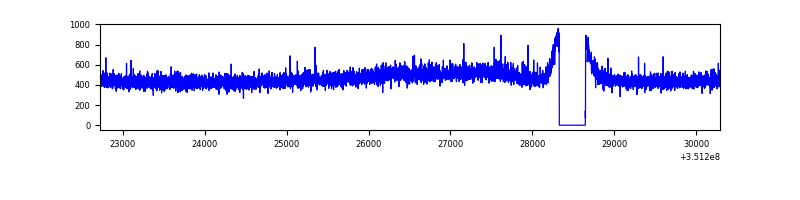 |
| B | 7571 | 7252 | 0 | 0 | 0.00% | 0.00% | 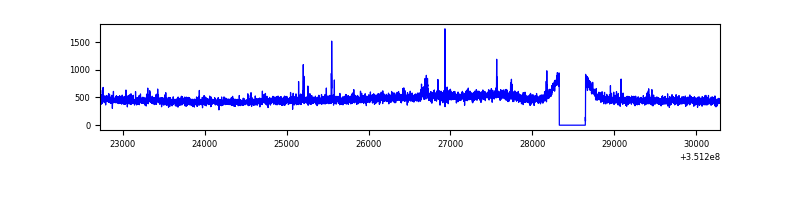 |
| C | 7571 | 7252 | 0 | 0 | 0.00% | 0.00% |  |
| D | 7571 | 7252 | 200 | 200 | 2.64% | 2.76% | 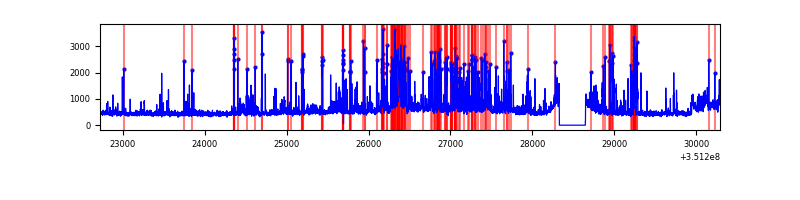 |
Top three noisy pixels from each quadrant. If the there are fewer than three noisy pixels in the level2.evt file, extra rows are filled as -1
| Pixel properties | Quadrant properties | ||||||
|---|---|---|---|---|---|---|---|
| Quadrant | DetID | PixID | Counts | Sigma | Mean | Median | Sigma |
| A | 0 | 13 | 14433 | 77.34 | 868 | 850 | 175.6 |
| A | 13 | 254 | 13185 | 70.24 | 868 | 850 | 175.6 |
| A | 3 | 137 | 8826 | 45.42 | 868 | 850 | 175.6 |
| B | 0 | 183 | 25528 | 146.84 | 863 | 836 | 168.2 |
| B | 12 | 111 | 21258 | 121.45 | 863 | 836 | 168.2 |
| B | 11 | 111 | 19271 | 109.63 | 863 | 836 | 168.2 |
| C | 14 | 238 | 134708 | 675.63 | 839 | 844 | 198.1 |
| C | 3 | 233 | 104212 | 521.71 | 839 | 844 | 198.1 |
| C | 2 | 114 | 16940 | 81.24 | 839 | 844 | 198.1 |
| D | 1 | 52 | 1068469 | 5348.27 | 831 | 808 | 199.6 |
| D | 8 | 195 | 372881 | 1863.84 | 831 | 808 | 199.6 |
| D | 12 | 233 | 164606 | 820.52 | 831 | 808 | 199.6 |
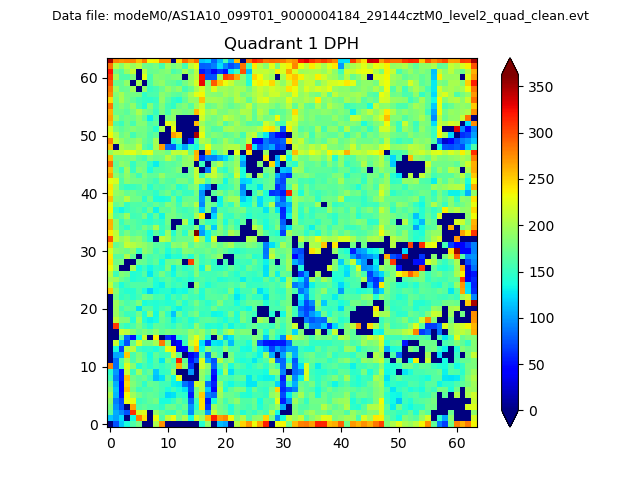
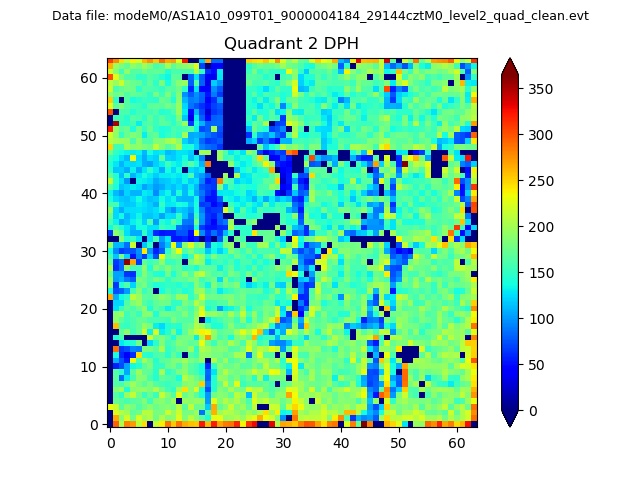
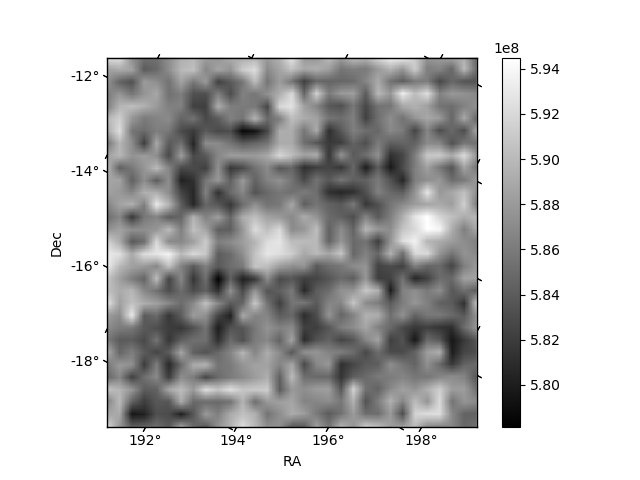
Histogram calculated using DETX and DETY for each event in the final _common_clean file
| Quadrant A | 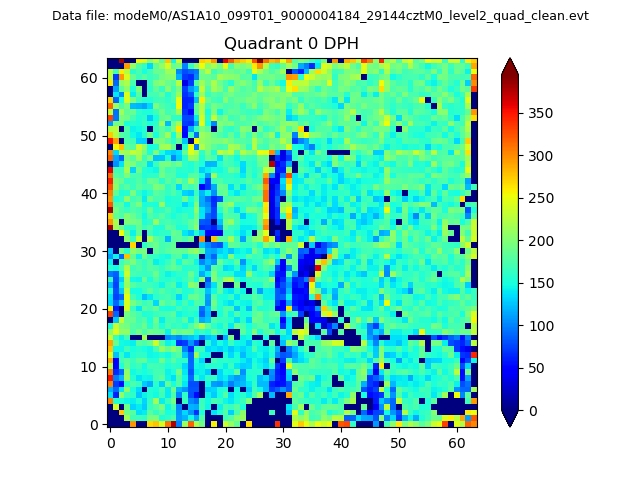 |
 |
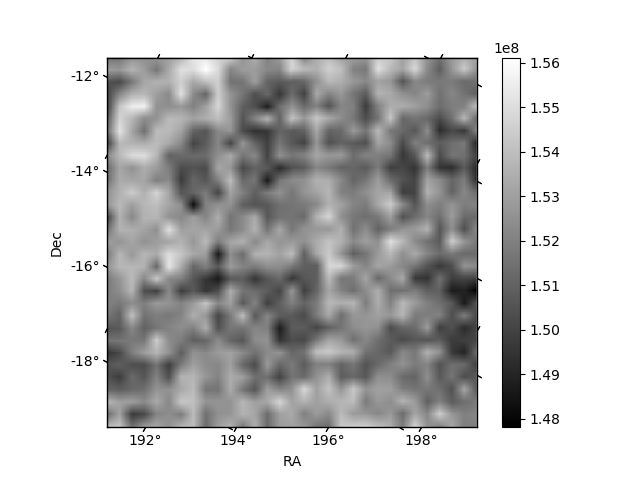
Quadrant B |
|---|---|---|---|
| Quadrant D | 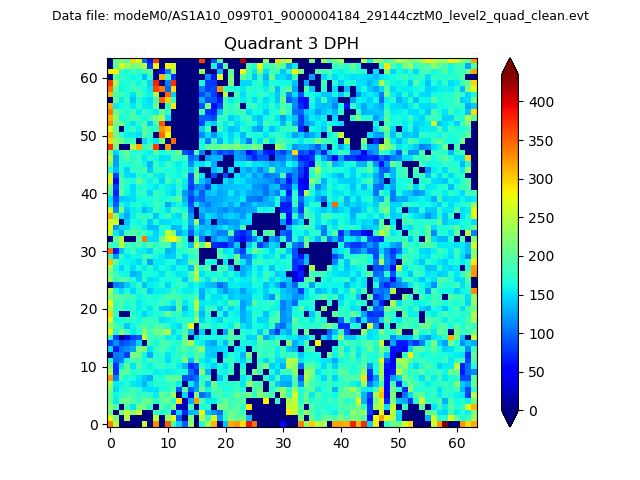 |
 |
Quadrant C |
| Plot type | Count rate plots | Images |
|---|---|---|
| Comparison with Poisson distribution Blue bars denote a histogram of data divided into 1 sec bins. Red curve is a Poisson curve with rate = median count rate of data. |
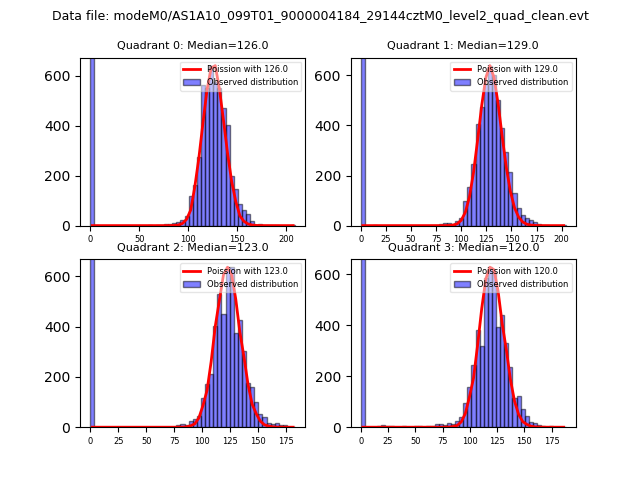 |
 |
| Quadrant-wise count rates Data is divided into 100 sec bins |
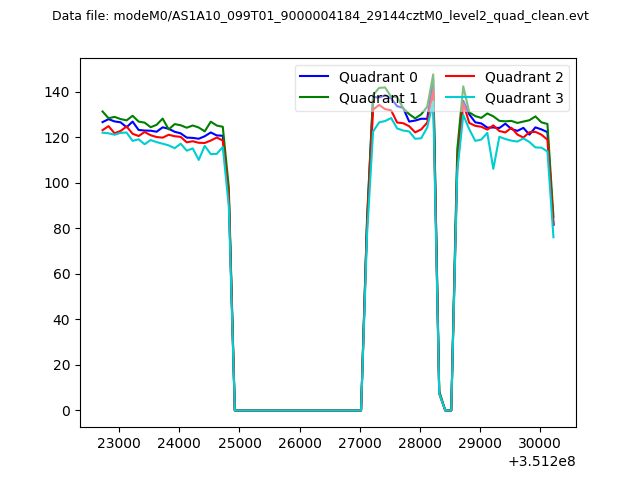 |
|
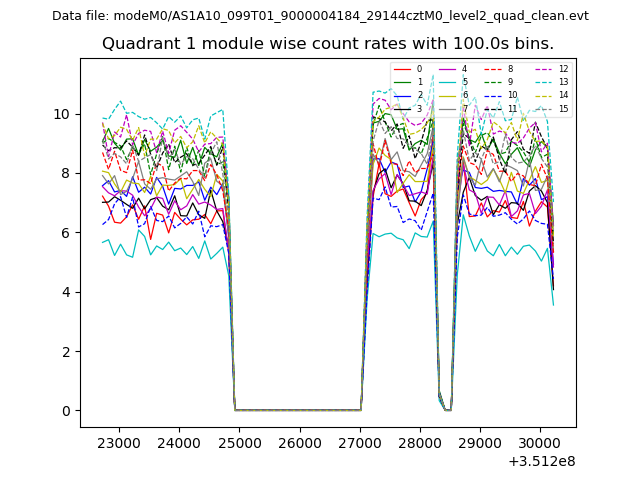
| Module-wise count rates for Quadrant A Data is divided into 100 sec bins |
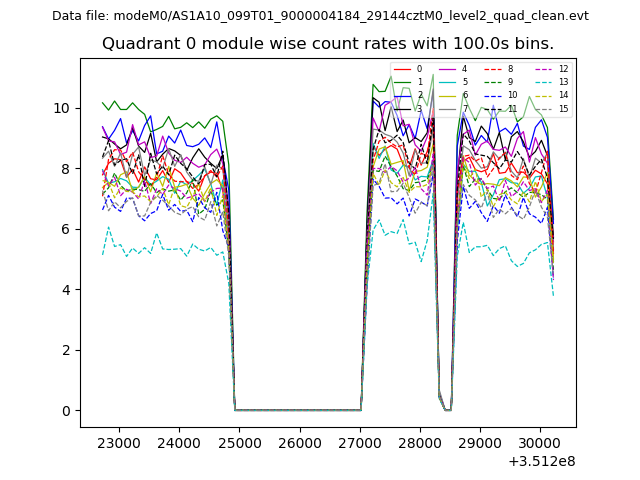 |
 |
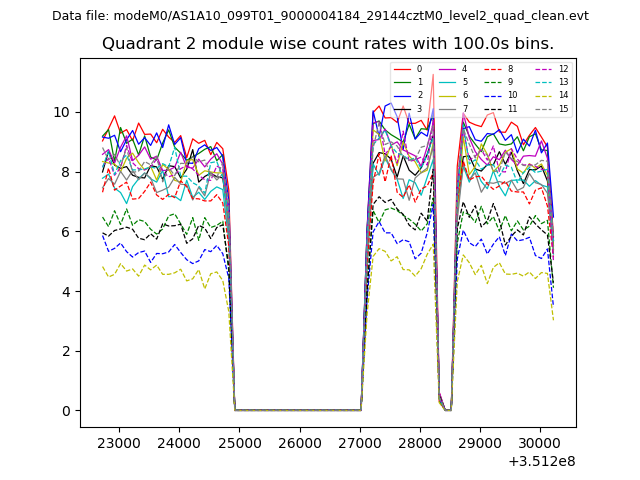
| Module-wise count rates for Quadrant B Data is divided into 100 sec bins |
 |
 |
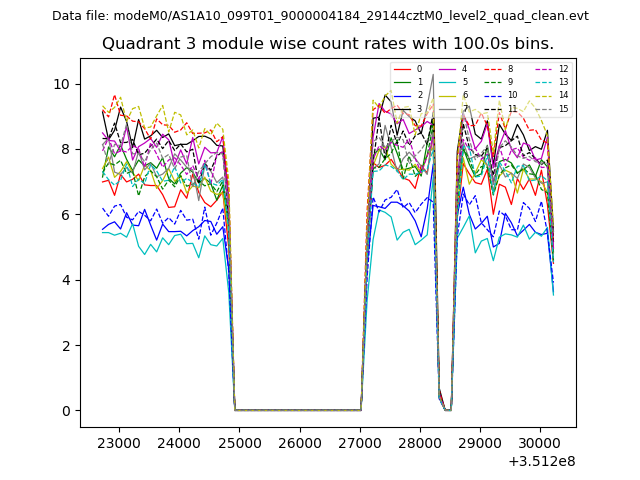
| Module-wise count rates for Quadrant C Data is divided into 100 sec bins |
 |
 |
| Module-wise count rates for Quadrant D Data is divided into 100 sec bins |
 |
 |
| Parameter | Plot |
|---|---|
| CZT HV Monitor |  |
| D_VDD | 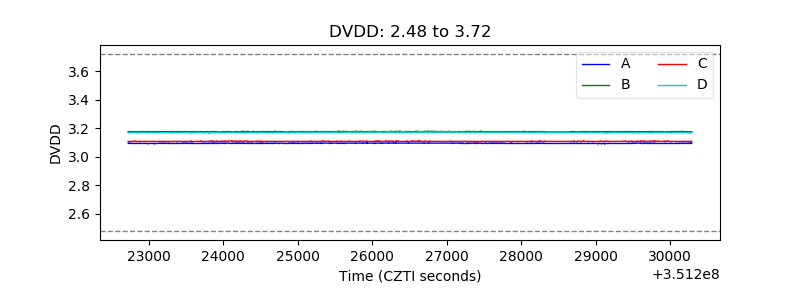 |
| Temperature 1 | 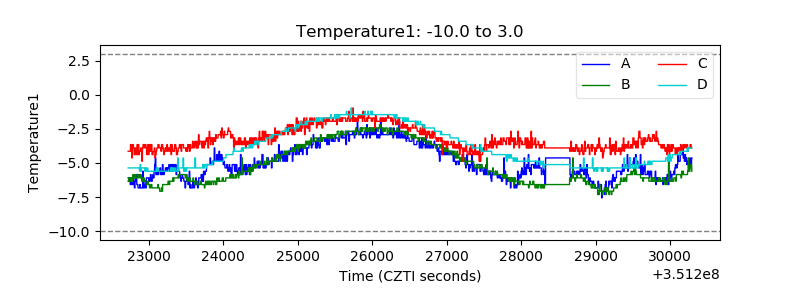 |
| Veto HV Monitor | 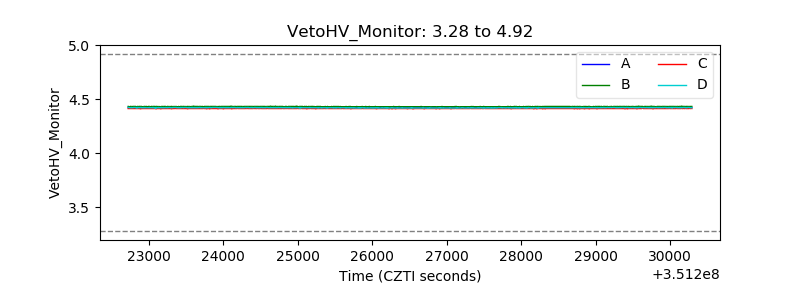 |
| Veto LLD | 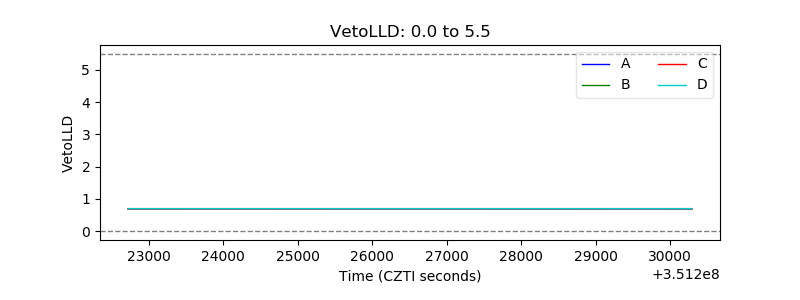 |
| Alpha Counter | 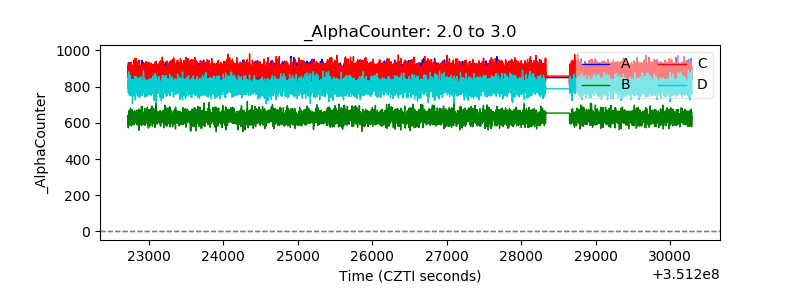 |
| _CPM_Rate | 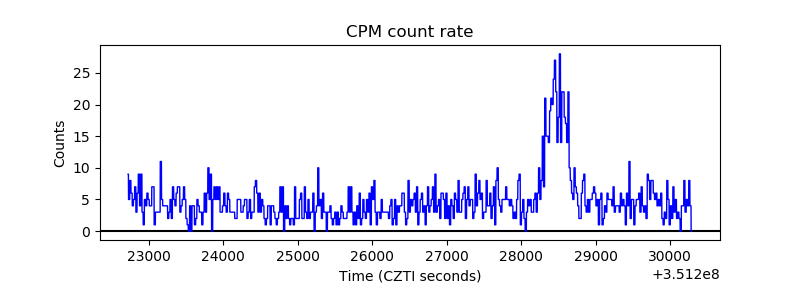 |
| CZT Counter | 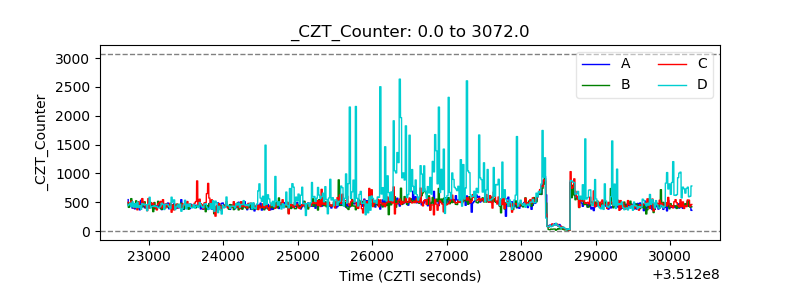 |
| +2.5 Volts monitor |  |
| +5 Volts monitor | 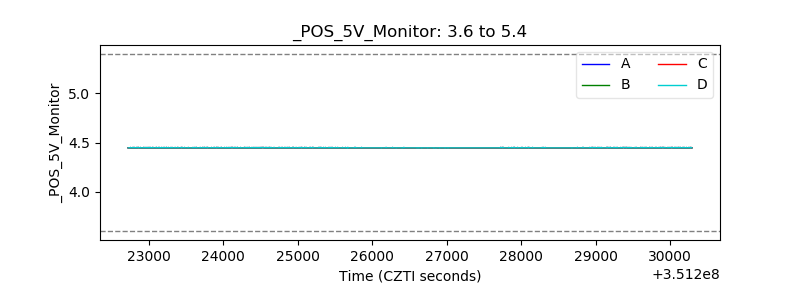 |
| _ROLL_ROT | 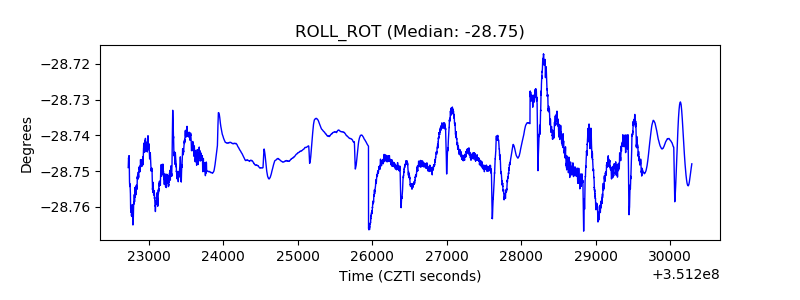 |
| _Roll_DEC | 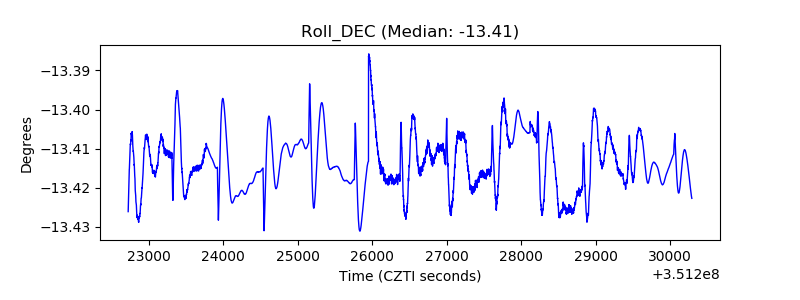 |
| _Roll_RA | 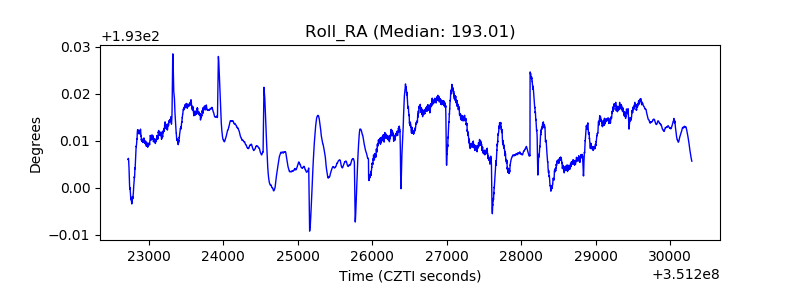 |
| Veto Counter | 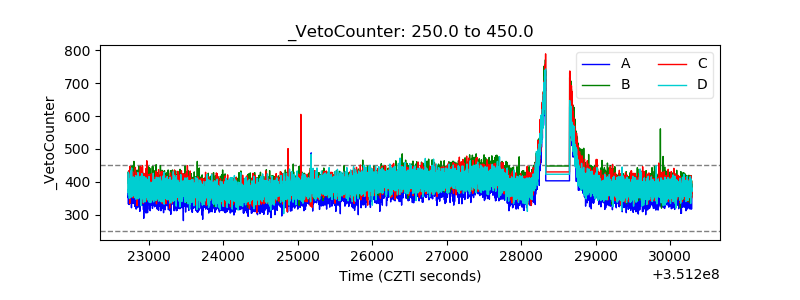 |