| Param | Original file | Final file |
|---|---|---|
| Filename | modeM0/AS1A10_099T01_9000004184_29146cztM0_level2.evt | modeM0/AS1A10_099T01_9000004184_29146cztM0_level2_quad_clean.evt |
| Size (bytes) | 932,091,840 | 157,901,760 |
| Size | 888.9 MB | 150.6 MB |
| Events in quadrant A | 5,868,612 | 993,807 |
| Events in quadrant B | 6,061,107 | 1,017,515 |
| Events in quadrant C | 6,151,108 | 972,633 |
| Events in quadrant D | 9,293,696 | 925,651 |
| Mode M9 | |||
|---|---|---|---|
| Quadrant | BADHDUFLAG | Total packets | Discarded packets |
| A | 0 | 13 | 0 |
| B | 0 | 13 | 0 |
| C | 0 | 13 | 0 |
| D | 0 | 13 | 0 |
| Mode SS | |||
|---|---|---|---|
| Quadrant | BADHDUFLAG | Total packets | Discarded packets |
| A | 0 | 256 | 0 |
| B | 0 | 256 | 0 |
| C | 0 | 256 | 0 |
| D | 0 | 256 | 0 |
| Mode M0 | |||
|---|---|---|---|
| Quadrant | BADHDUFLAG | Total packets | Discarded packets |
| A | 0 | 25539 | 2 |
| B | 0 | 25927 | 2 |
| C | 0 | 25818 | 3 |
| D | 0 | 36005 | 2 |
| Quadrant | Total seconds | Saturated seconds | Saturation percentage |
|---|---|---|---|
| A | 12623 | 95 | 0.752594% |
| B | 12623 | 101 | 0.800127% |
| C | 12623 | 198 | 1.568565% |
| D | 12623 | 711 | 5.632575% |
Noise dominated data is calculated using 1-second bins in cleaned event files. If a bin has >2000 counts, and if more than 50% of those come from <1% of pixels, then it is considered to be noise-dominated and hence unusable.
| Quadrant | # 1 sec bins | Bins with >0 counts | Bins with >2000 counts | High rate bins dominated by noise | Noise dominated (total time) | Noise dominated (detector-on time) | Marked lightcurve |
|---|---|---|---|---|---|---|---|
| A | 13843 | 12625 | 0 | 0 | 0.00% | 0.00% | 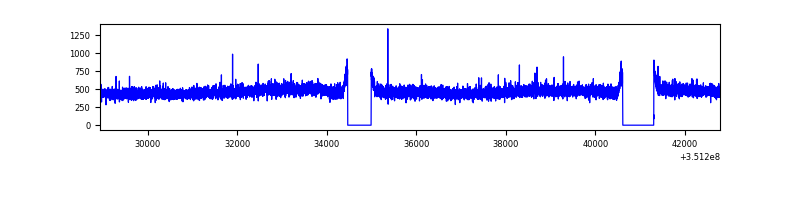 |
| B | 13843 | 12625 | 5 | 5 | 0.04% | 0.04% | 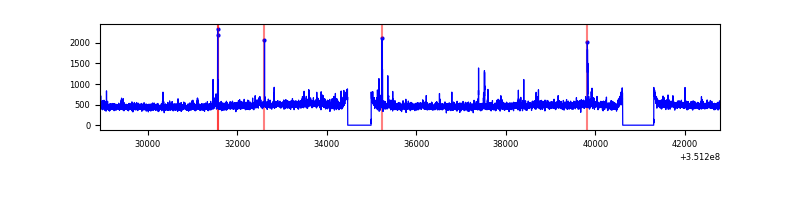 |
| C | 13843 | 12625 | 0 | 0 | 0.00% | 0.00% | 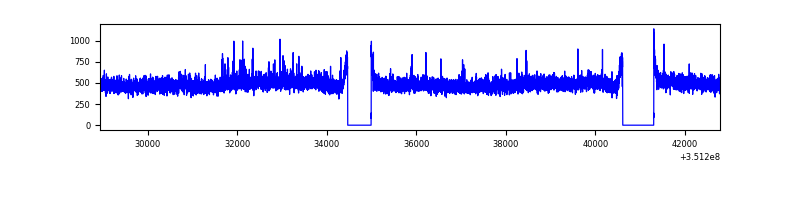 |
| D | 13843 | 12625 | 552 | 552 | 3.99% | 4.37% | 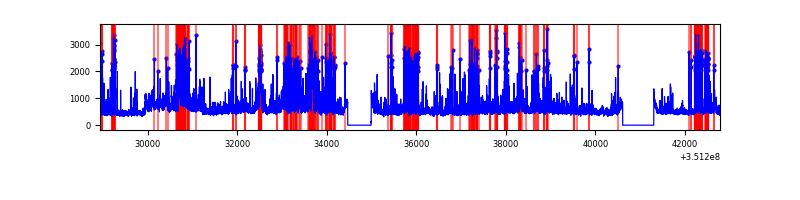 |
Top three noisy pixels from each quadrant. If the there are fewer than three noisy pixels in the level2.evt file, extra rows are filled as -1
| Pixel properties | Quadrant properties | ||||||
|---|---|---|---|---|---|---|---|
| Quadrant | DetID | PixID | Counts | Sigma | Mean | Median | Sigma |
| A | 13 | 254 | 22484 | 68.41 | 1520 | 1483 | 307.0 |
| A | 3 | 137 | 15285 | 44.96 | 1520 | 1483 | 307.0 |
| A | 0 | 226 | 12799 | 36.86 | 1520 | 1483 | 307.0 |
| B | 0 | 183 | 40986 | 135.32 | 1510 | 1468 | 292.0 |
| B | 12 | 111 | 36909 | 121.36 | 1510 | 1468 | 292.0 |
| B | 11 | 111 | 33764 | 110.59 | 1510 | 1468 | 292.0 |
| C | 14 | 238 | 260588 | 751.63 | 1468 | 1477 | 344.7 |
| C | 3 | 233 | 103873 | 297.03 | 1468 | 1477 | 344.7 |
| C | 14 | 254 | 37882 | 105.6 | 1468 | 1477 | 344.7 |
| D | 1 | 52 | 2764225 | 8043.41 | 1451 | 1415 | 343.5 |
| D | 8 | 195 | 783952 | 2278.21 | 1451 | 1415 | 343.5 |
| D | 12 | 233 | 127590 | 367.34 | 1451 | 1415 | 343.5 |
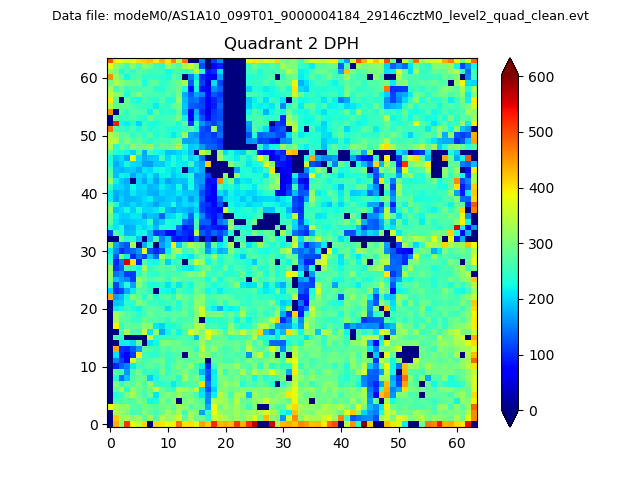
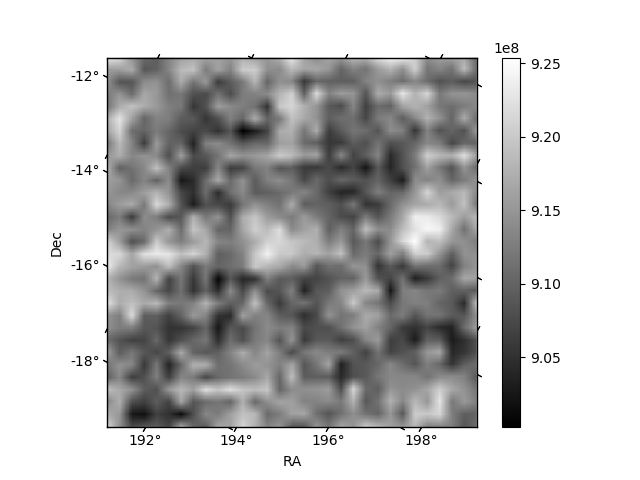
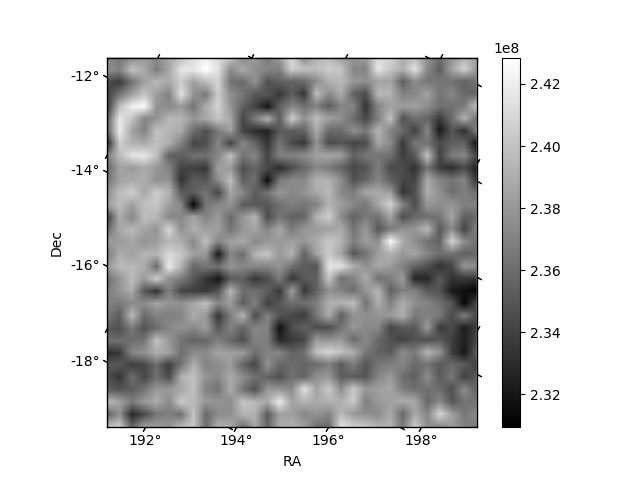
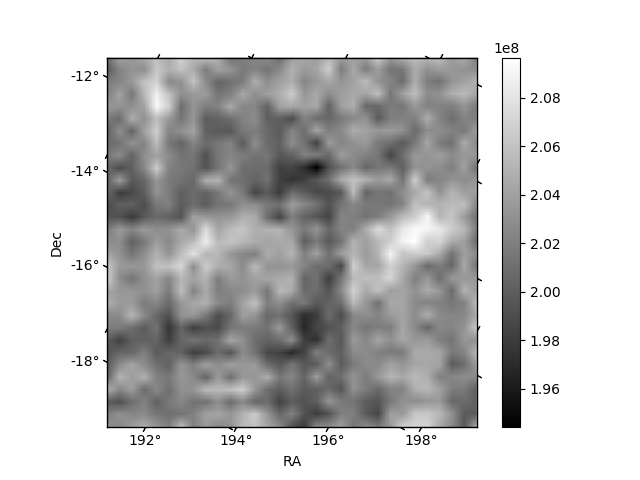
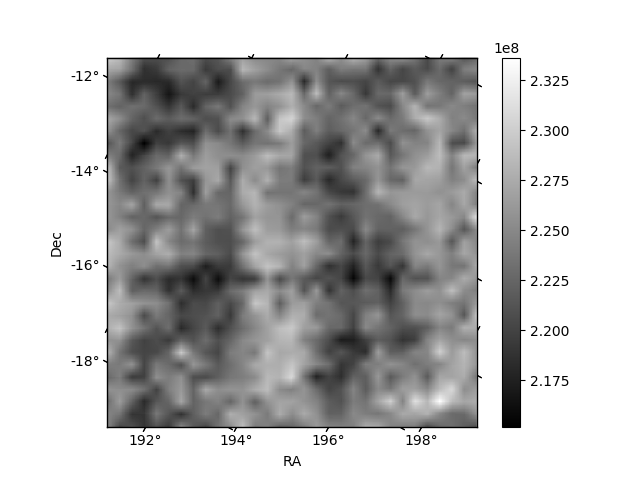
Histogram calculated using DETX and DETY for each event in the final _common_clean file
| Quadrant A | 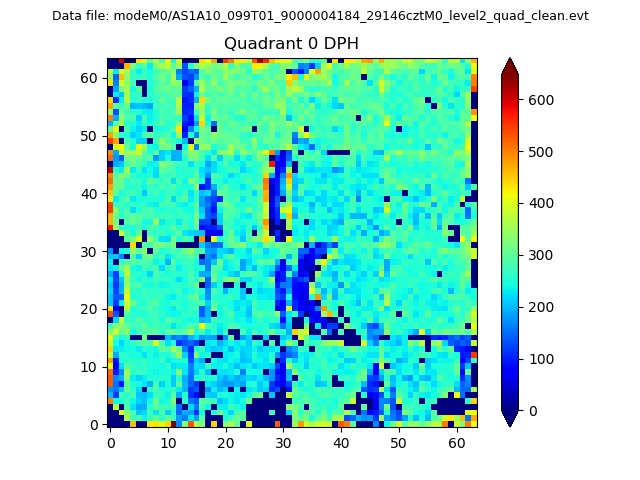 |
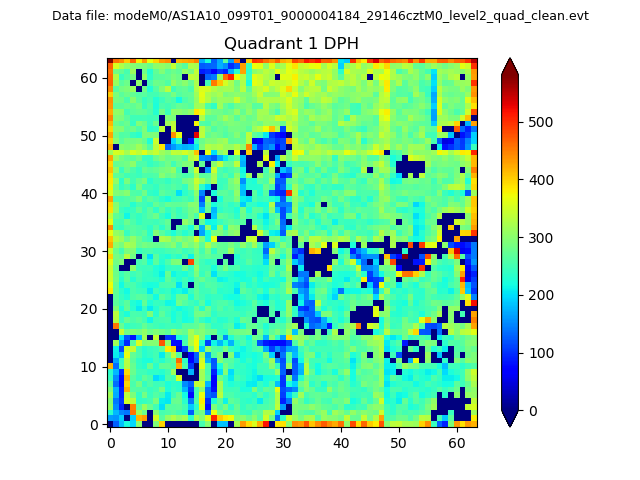 |
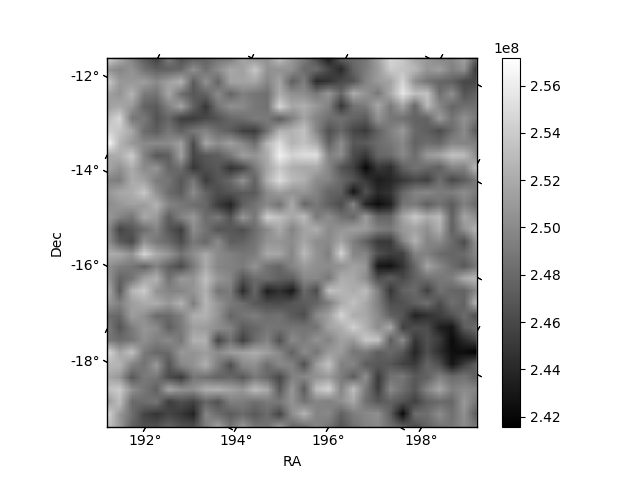
Quadrant B |
|---|---|---|---|
| Quadrant D | 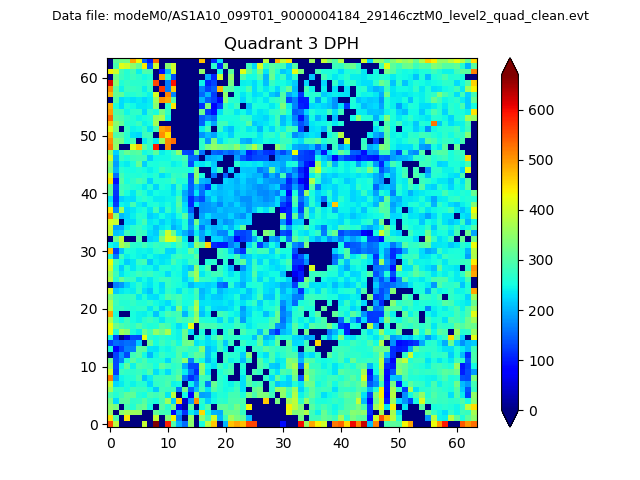 |
 |
Quadrant C |
| Plot type | Count rate plots | Images |
|---|---|---|
| Comparison with Poisson distribution Blue bars denote a histogram of data divided into 1 sec bins. Red curve is a Poisson curve with rate = median count rate of data. |
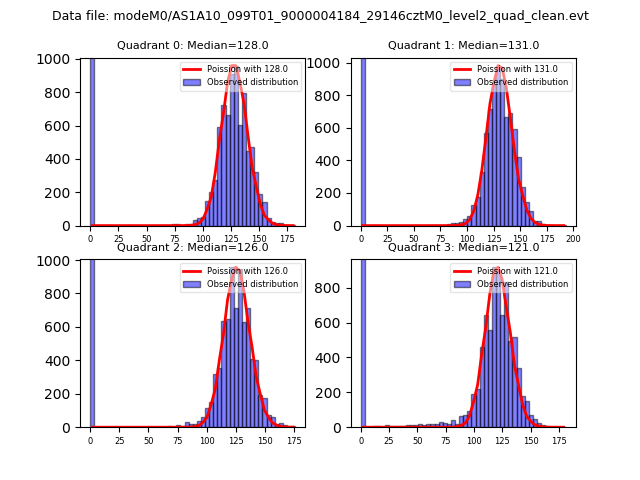 |
 |
| Quadrant-wise count rates Data is divided into 100 sec bins |
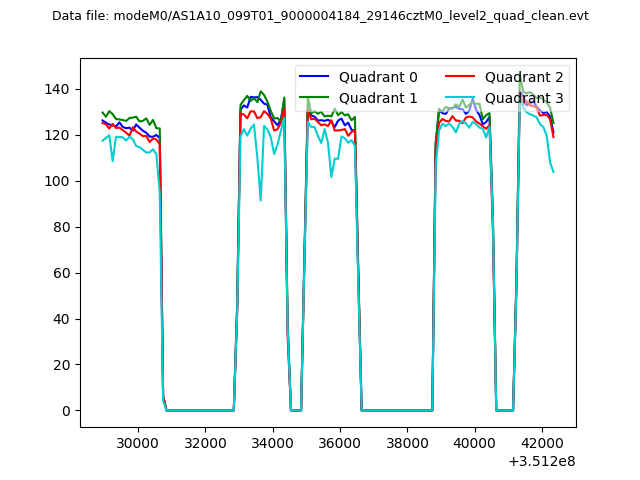 |
|
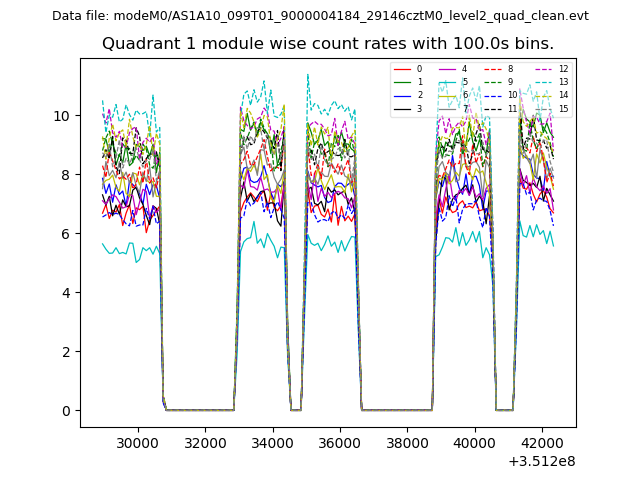
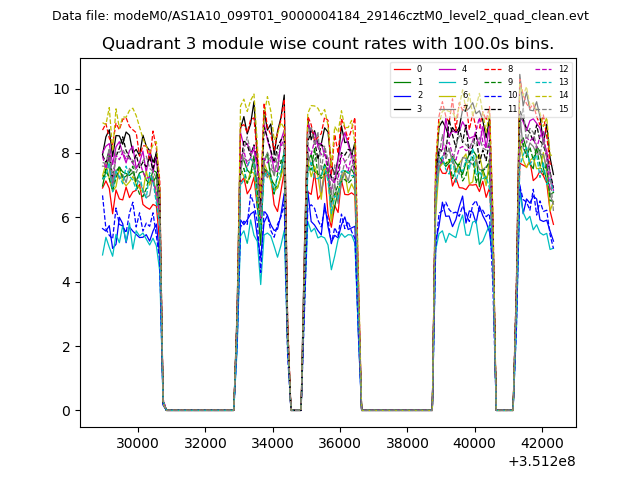
| Module-wise count rates for Quadrant A Data is divided into 100 sec bins |
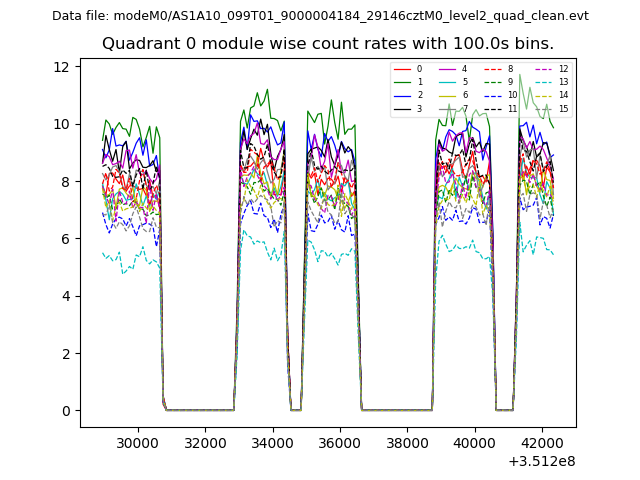 |
 |
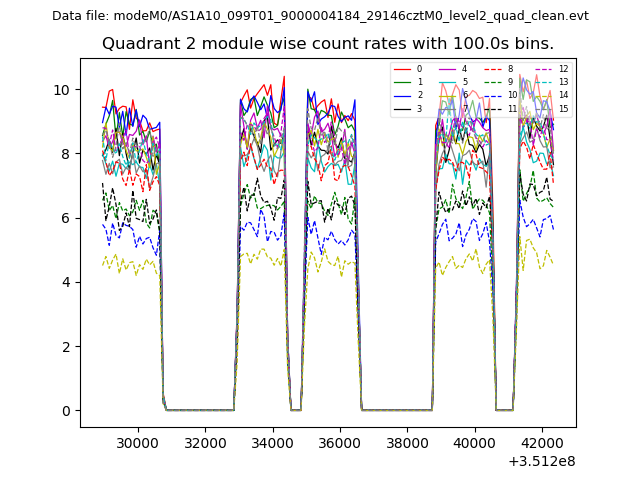
| Module-wise count rates for Quadrant B Data is divided into 100 sec bins |
 |
 |
| Module-wise count rates for Quadrant C Data is divided into 100 sec bins |
 |
 |
| Module-wise count rates for Quadrant D Data is divided into 100 sec bins |
 |
 |
| Parameter | Plot |
|---|---|
| CZT HV Monitor | 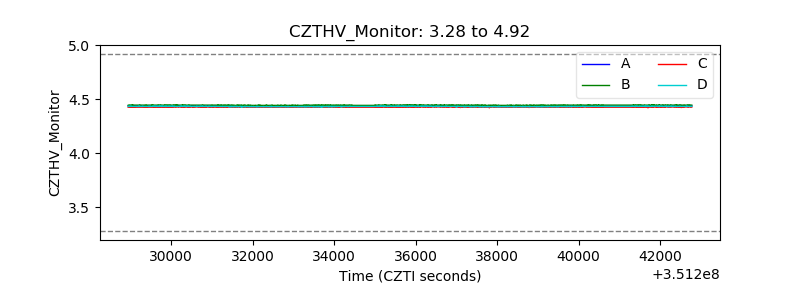 |
| D_VDD | 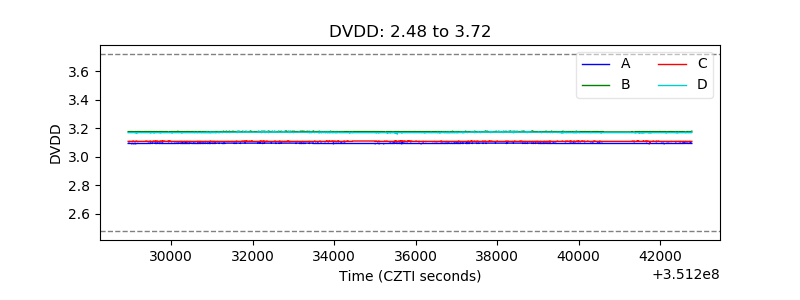 |
| Temperature 1 | 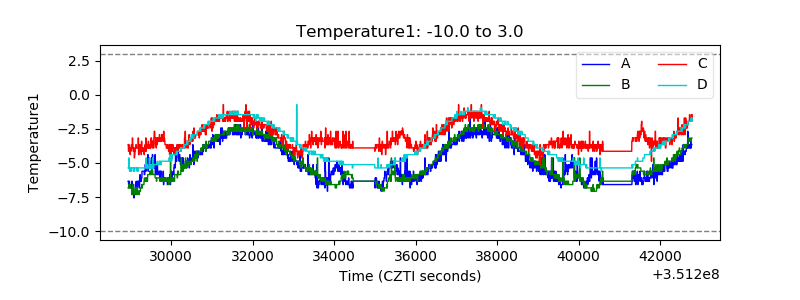 |
| Veto HV Monitor | 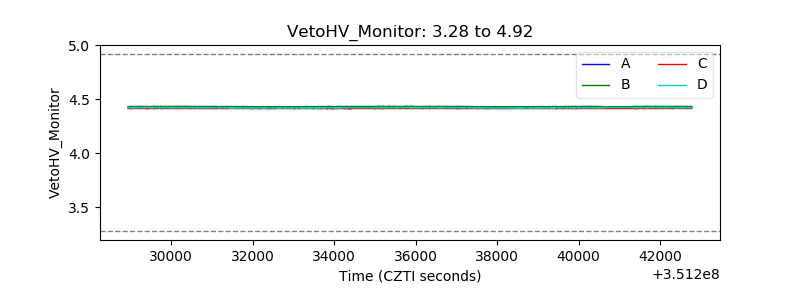 |
| Veto LLD | 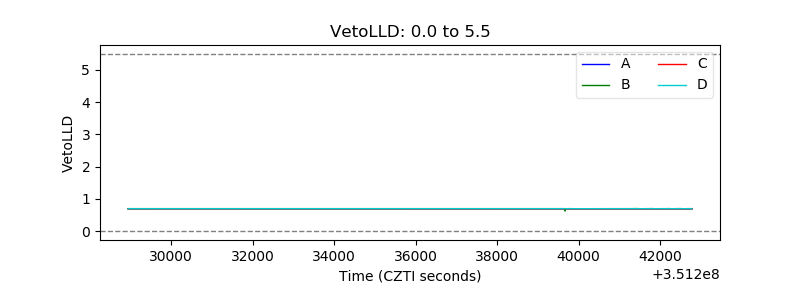 |
| Alpha Counter | 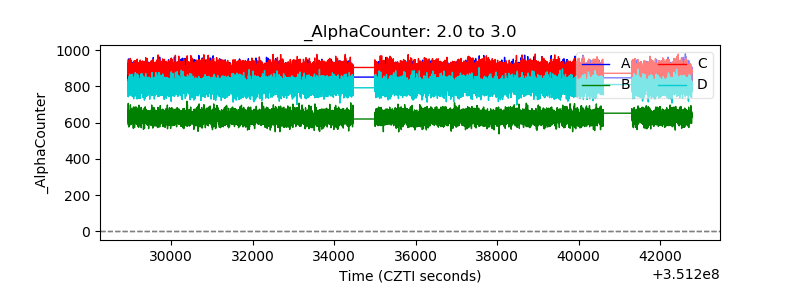 |
| _CPM_Rate | 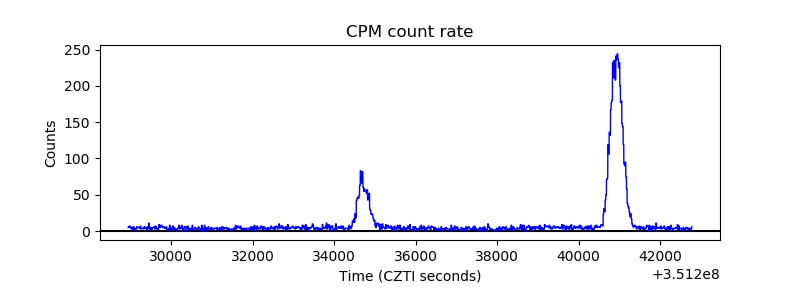 |
| CZT Counter | 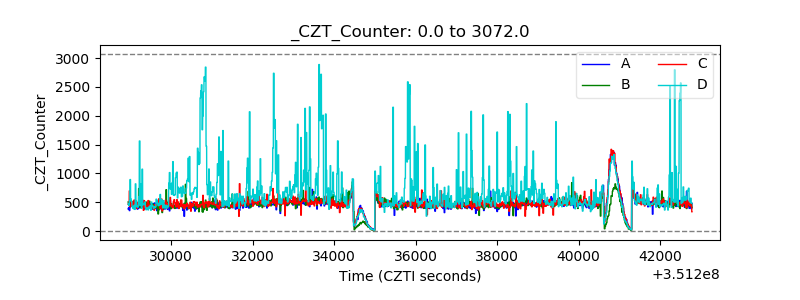 |
| +2.5 Volts monitor |  |
| +5 Volts monitor | 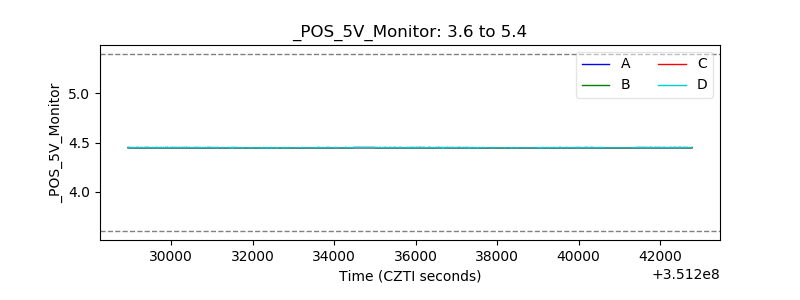 |
| _ROLL_ROT |  |
| _Roll_DEC | 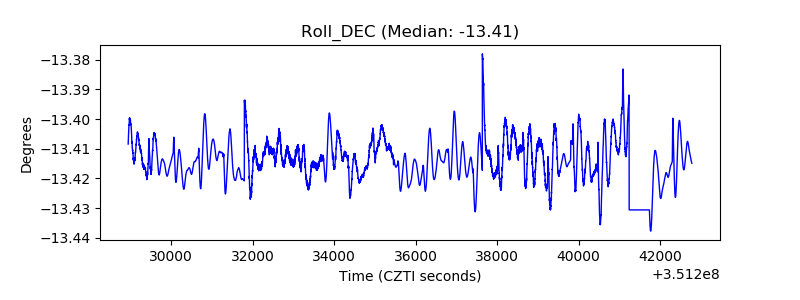 |
| _Roll_RA | 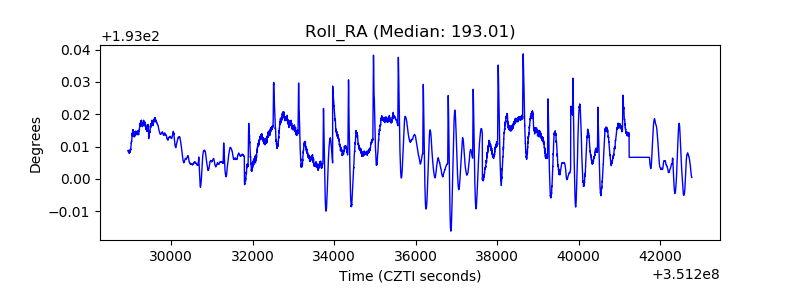 |
| Veto Counter | 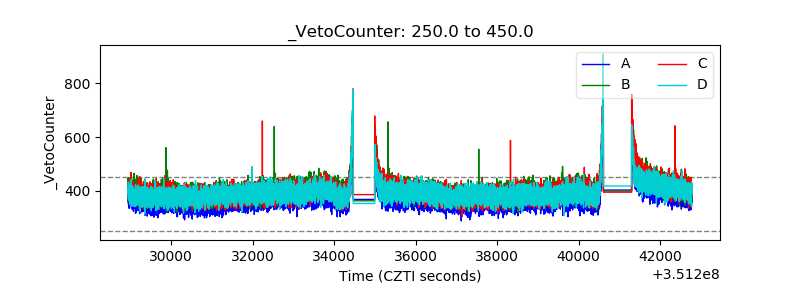 |