| Param | Original file | Final file |
|---|---|---|
| Filename | modeM0/AS1A10_099T01_9000004184_29147cztM0_level2.evt | modeM0/AS1A10_099T01_9000004184_29147cztM0_level2_quad_clean.evt |
| Size (bytes) | 477,596,160 | 79,024,320 |
| Size | 455.5 MB | 75.4 MB |
| Events in quadrant A | 3,168,630 | 489,268 |
| Events in quadrant B | 3,395,498 | 497,357 |
| Events in quadrant C | 3,317,717 | 477,282 |
| Events in quadrant D | 4,131,569 | 466,304 |
| Mode M9 | |||
|---|---|---|---|
| Quadrant | BADHDUFLAG | Total packets | Discarded packets |
| A | 0 | 9 | 0 |
| B | 0 | 9 | 0 |
| C | 0 | 9 | 0 |
| D | 0 | 9 | 0 |
| Mode SS | |||
|---|---|---|---|
| Quadrant | BADHDUFLAG | Total packets | Discarded packets |
| A | 0 | 134 | 0 |
| B | 0 | 134 | 0 |
| C | 0 | 134 | 0 |
| D | 0 | 134 | 0 |
| Mode M0 | |||
|---|---|---|---|
| Quadrant | BADHDUFLAG | Total packets | Discarded packets |
| A | 0 | 13531 | 1 |
| B | 0 | 14121 | 1 |
| C | 0 | 13715 | 1 |
| D | 0 | 16480 | 1 |
| Quadrant | Total seconds | Saturated seconds | Saturation percentage |
|---|---|---|---|
| A | 6639 | 57 | 0.858563% |
| B | 6639 | 79 | 1.189938% |
| C | 6639 | 99 | 1.491188% |
| D | 6639 | 138 | 2.078626% |
Noise dominated data is calculated using 1-second bins in cleaned event files. If a bin has >2000 counts, and if more than 50% of those come from <1% of pixels, then it is considered to be noise-dominated and hence unusable.
| Quadrant | # 1 sec bins | Bins with >0 counts | Bins with >2000 counts | High rate bins dominated by noise | Noise dominated (total time) | Noise dominated (detector-on time) | Marked lightcurve |
|---|---|---|---|---|---|---|---|
| A | 7514 | 6640 | 0 | 0 | 0.00% | 0.00% | 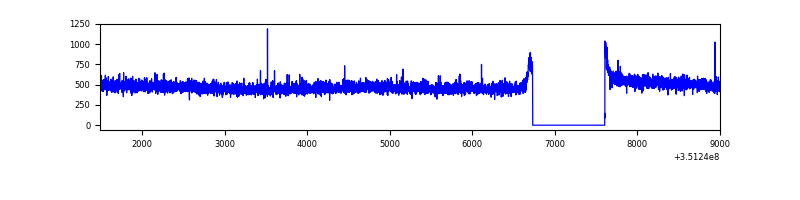 |
| B | 7514 | 6640 | 8 | 8 | 0.11% | 0.12% | 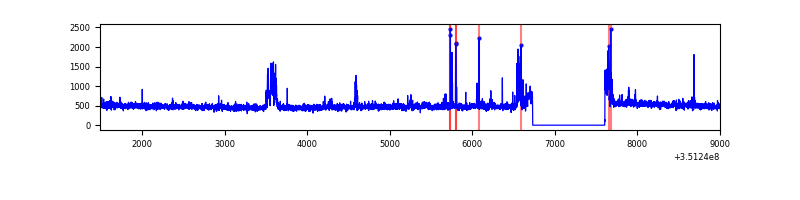 |
| C | 7514 | 6640 | 0 | 0 | 0.00% | 0.00% | 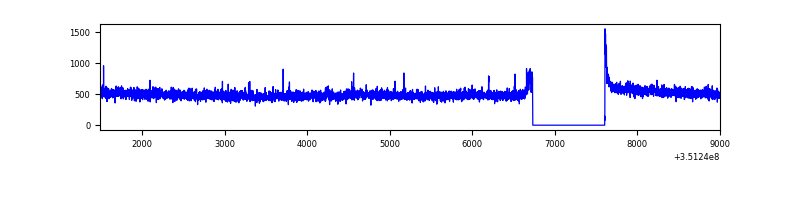 |
| D | 7514 | 6640 | 89 | 89 | 1.18% | 1.34% | 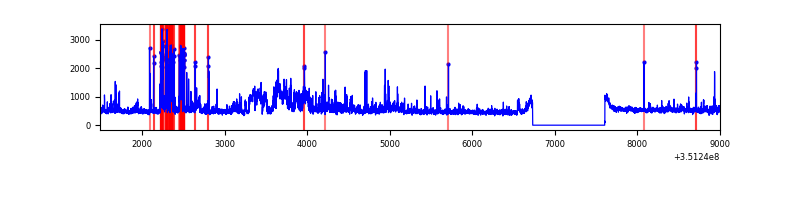 |
Top three noisy pixels from each quadrant. If the there are fewer than three noisy pixels in the level2.evt file, extra rows are filled as -1
| Pixel properties | Quadrant properties | ||||||
|---|---|---|---|---|---|---|---|
| Quadrant | DetID | PixID | Counts | Sigma | Mean | Median | Sigma |
| A | 13 | 254 | 11711 | 65.41 | 820 | 800 | 166.8 |
| A | 3 | 137 | 7968 | 42.97 | 820 | 800 | 166.8 |
| A | 0 | 226 | 7039 | 37.4 | 820 | 800 | 166.8 |
| B | 10 | 246 | 83238 | 523.77 | 811 | 789 | 157.4 |
| B | 0 | 190 | 82279 | 517.68 | 811 | 789 | 157.4 |
| B | 10 | 245 | 29492 | 182.34 | 811 | 789 | 157.4 |
| C | 14 | 238 | 130512 | 699.27 | 790 | 795 | 185.5 |
| C | 3 | 233 | 85258 | 455.32 | 790 | 795 | 185.5 |
| C | 2 | 114 | 15214 | 77.73 | 790 | 795 | 185.5 |
| D | 1 | 52 | 815558 | 4308.08 | 797 | 772 | 189.1 |
| D | 8 | 195 | 217954 | 1148.32 | 797 | 772 | 189.1 |
| D | 2 | 120 | 34397 | 177.79 | 797 | 772 | 189.1 |
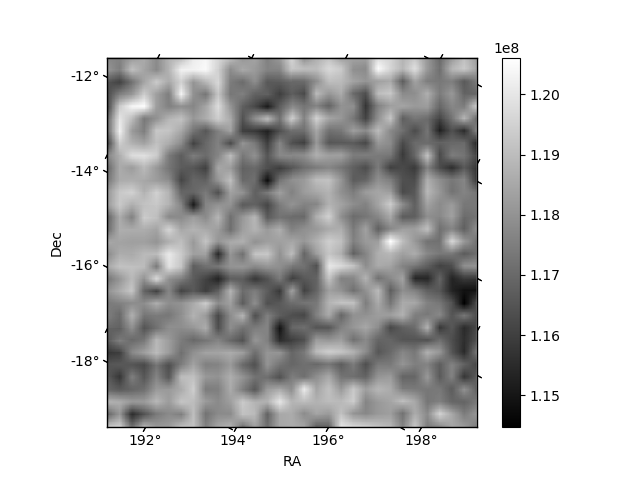
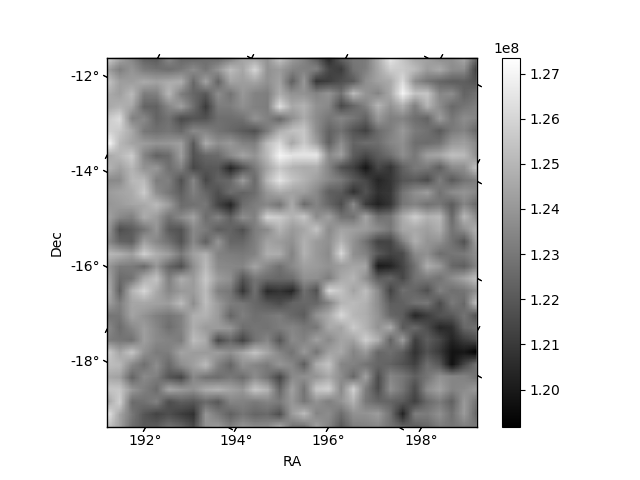
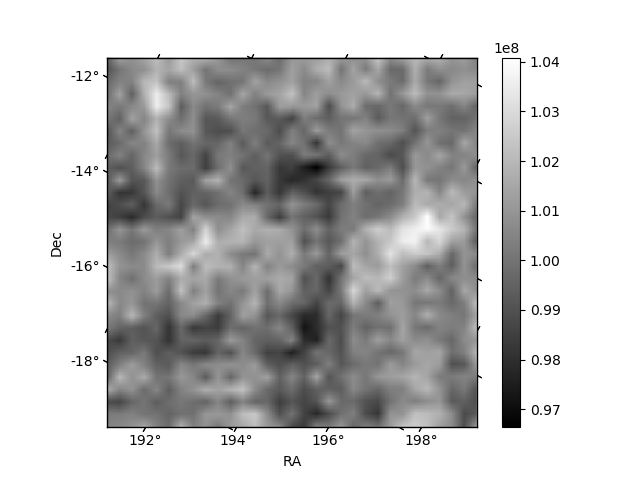
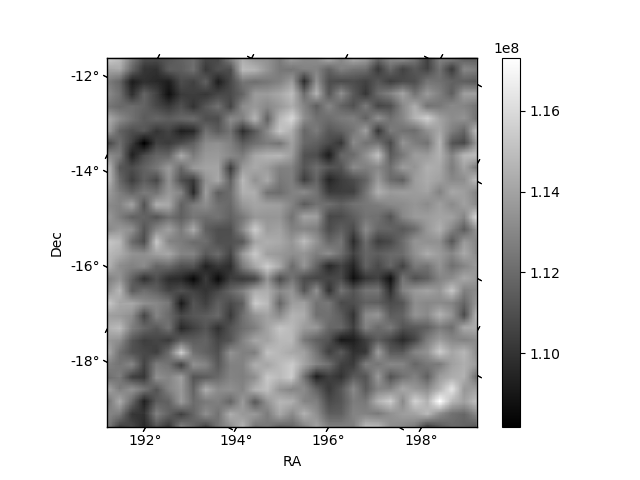
Histogram calculated using DETX and DETY for each event in the final _common_clean file
| Quadrant A | 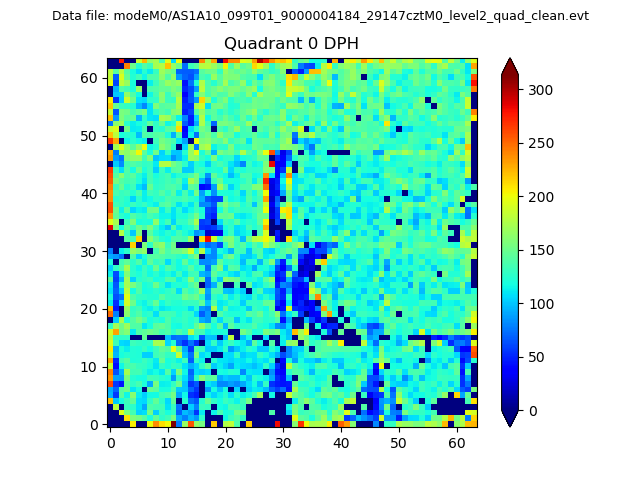 |
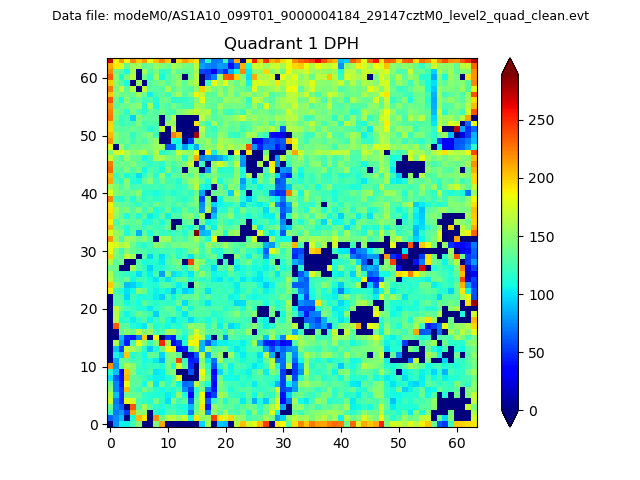 |
Quadrant B |
|---|---|---|---|
| Quadrant D | 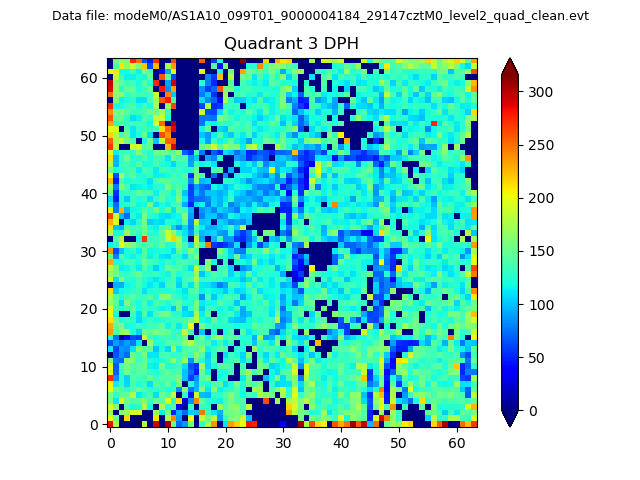 |
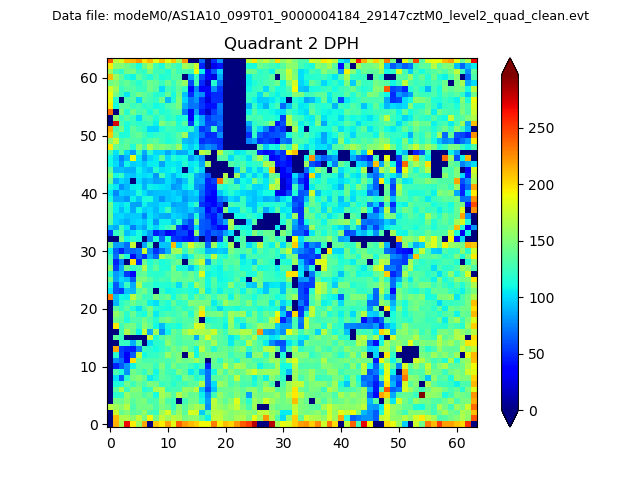 |
Quadrant C |
| Plot type | Count rate plots | Images |
|---|---|---|
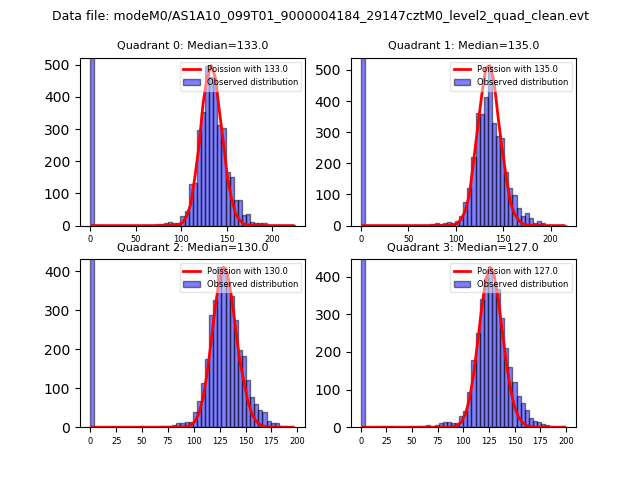
| Comparison with Poisson distribution Blue bars denote a histogram of data divided into 1 sec bins. Red curve is a Poisson curve with rate = median count rate of data. |
 |
 |
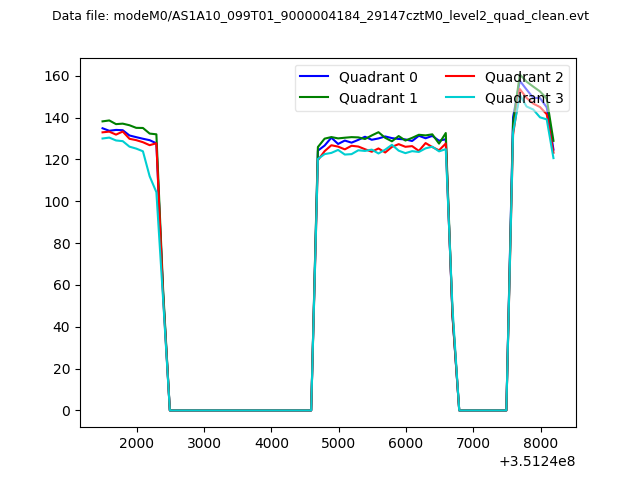
| Quadrant-wise count rates Data is divided into 100 sec bins |
 |
|
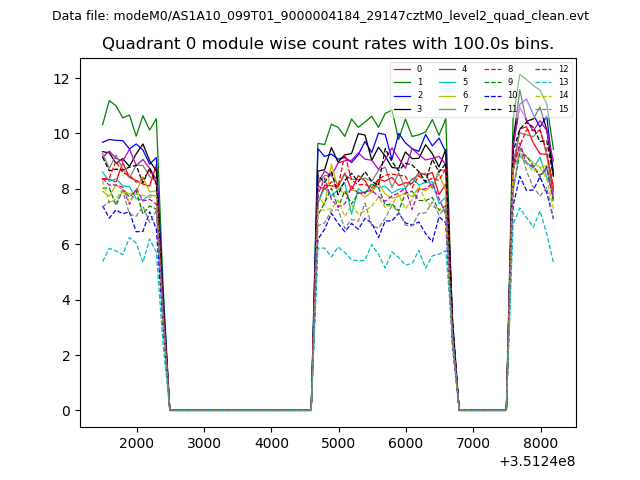
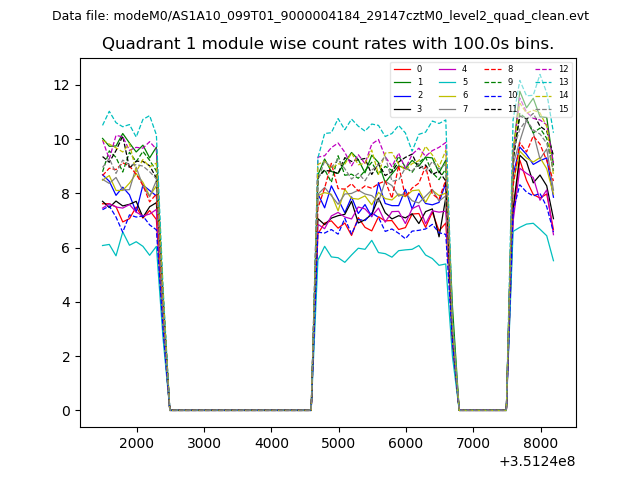
| Module-wise count rates for Quadrant A Data is divided into 100 sec bins |
 |
 |
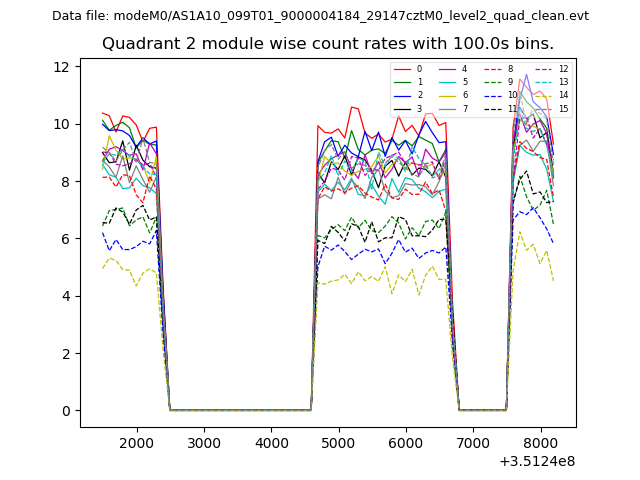
| Module-wise count rates for Quadrant B Data is divided into 100 sec bins |
 |
 |
| Module-wise count rates for Quadrant C Data is divided into 100 sec bins |
 |
 |
| Module-wise count rates for Quadrant D Data is divided into 100 sec bins |
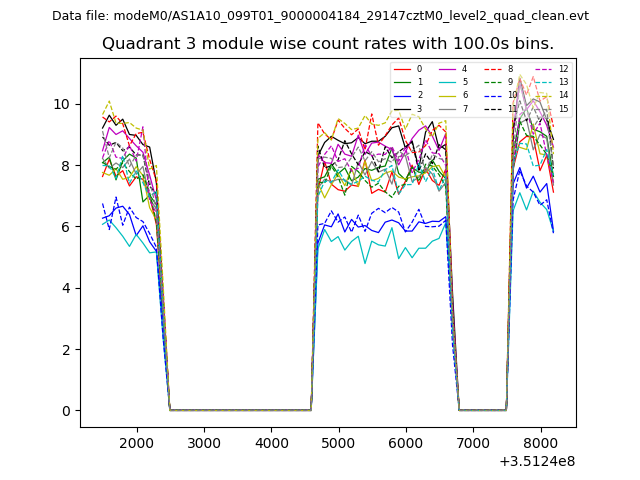 |
 |
| Parameter | Plot |
|---|---|
| CZT HV Monitor | 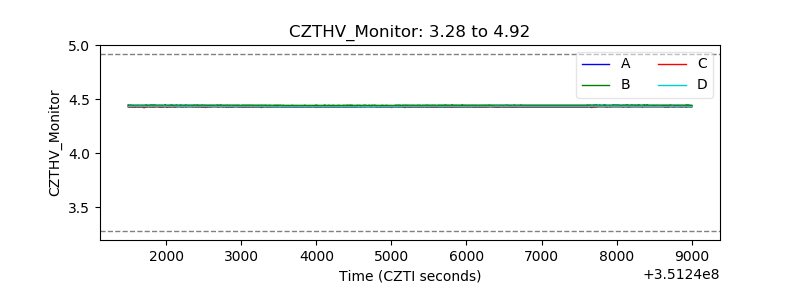 |
| D_VDD | 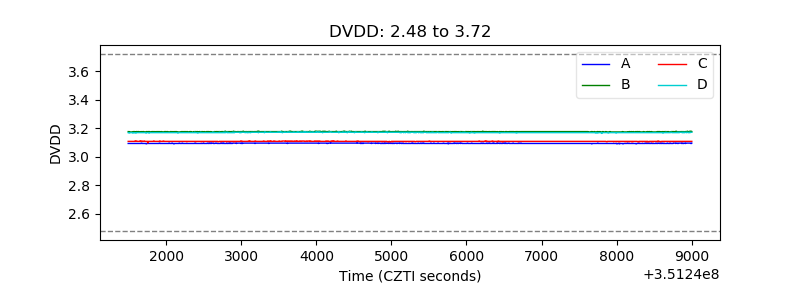 |
| Temperature 1 | 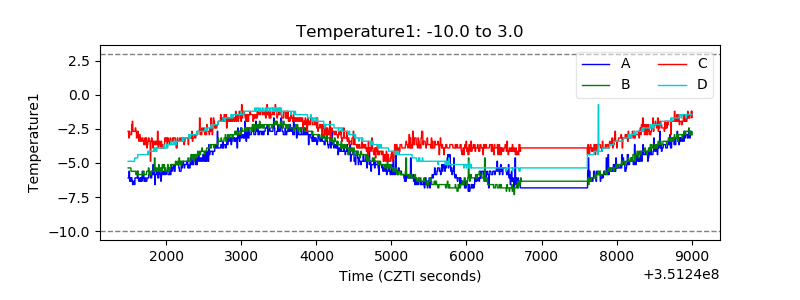 |
| Veto HV Monitor |  |
| Veto LLD | 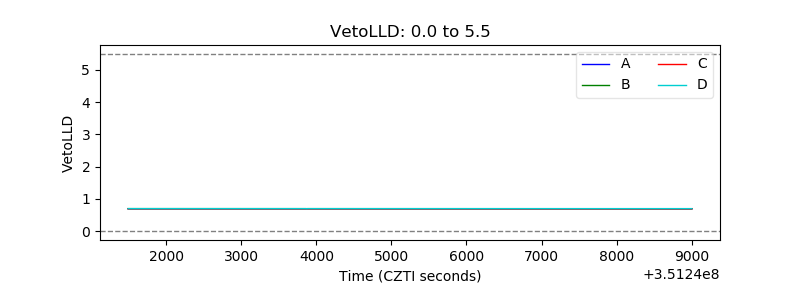 |
| Alpha Counter | 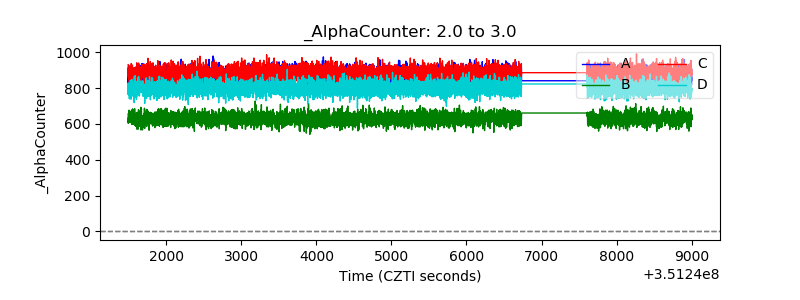 |
| _CPM_Rate |  |
| CZT Counter | 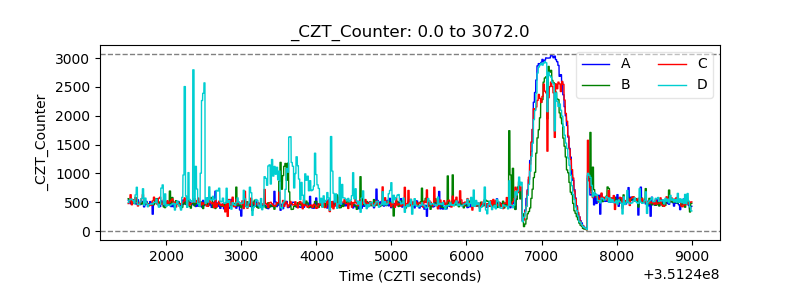 |
| +2.5 Volts monitor | 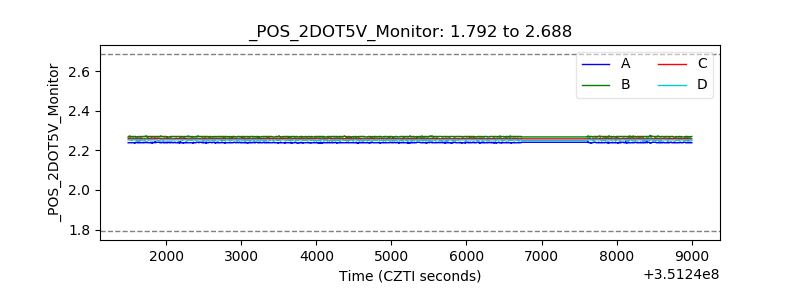 |
| +5 Volts monitor |  |
| _ROLL_ROT | 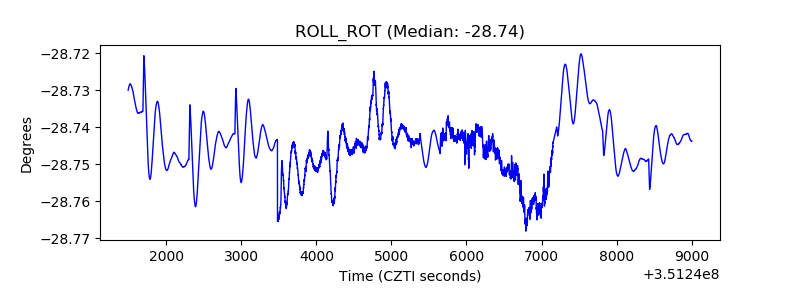 |
| _Roll_DEC | 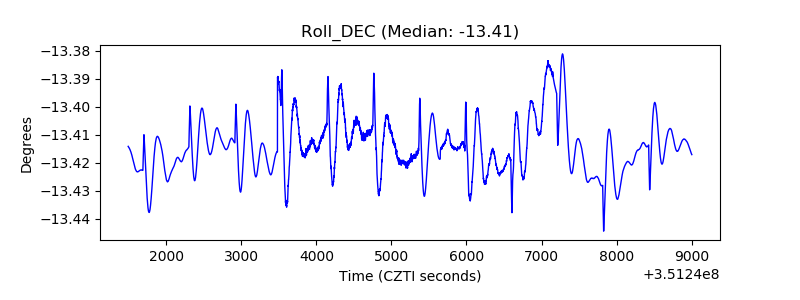 |
| _Roll_RA | 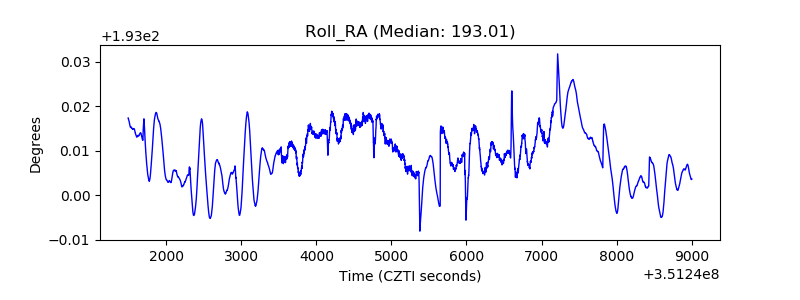 |
| Veto Counter | 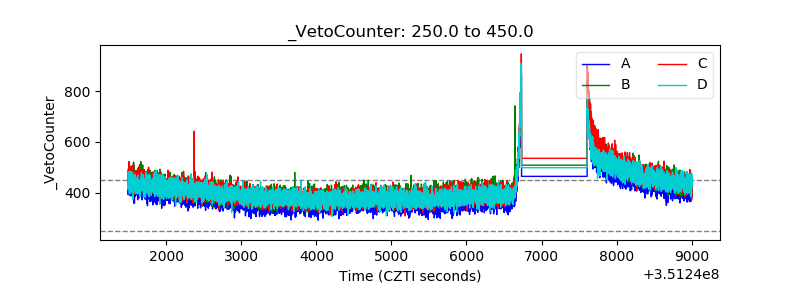 |