| Param | Original file | Final file |
|---|---|---|
| Filename | modeM0/AS1A10_099T01_9000004184_29148cztM0_level2.evt | modeM0/AS1A10_099T01_9000004184_29148cztM0_level2_quad_clean.evt |
| Size (bytes) | 512,844,480 | 74,079,360 |
| Size | 489.1 MB | 70.6 MB |
| Events in quadrant A | 3,470,412 | 448,720 |
| Events in quadrant B | 3,691,810 | 452,909 |
| Events in quadrant C | 3,674,223 | 434,238 |
| Events in quadrant D | 4,226,023 | 425,650 |
| Mode M9 | |||
|---|---|---|---|
| Quadrant | BADHDUFLAG | Total packets | Discarded packets |
| A | 0 | 13 | 0 |
| B | 0 | 14 | 0 |
| C | 0 | 14 | 0 |
| D | 0 | 14 | 0 |
| Mode SS | |||
|---|---|---|---|
| Quadrant | BADHDUFLAG | Total packets | Discarded packets |
| A | 0 | 138 | 0 |
| B | 0 | 138 | 0 |
| C | 0 | 138 | 0 |
| D | 0 | 138 | 0 |
| Mode M0 | |||
|---|---|---|---|
| Quadrant | BADHDUFLAG | Total packets | Discarded packets |
| A | 0 | 14595 | 2 |
| B | 0 | 15203 | 2 |
| C | 0 | 15006 | 2 |
| D | 0 | 16902 | 2 |
| Quadrant | Total seconds | Saturated seconds | Saturation percentage |
|---|---|---|---|
| A | 6920 | 64 | 0.924855% |
| B | 6919 | 84 | 1.214048% |
| C | 6919 | 180 | 2.601532% |
| D | 6919 | 137 | 1.980055% |
Noise dominated data is calculated using 1-second bins in cleaned event files. If a bin has >2000 counts, and if more than 50% of those come from <1% of pixels, then it is considered to be noise-dominated and hence unusable.
| Quadrant | # 1 sec bins | Bins with >0 counts | Bins with >2000 counts | High rate bins dominated by noise | Noise dominated (total time) | Noise dominated (detector-on time) | Marked lightcurve |
|---|---|---|---|---|---|---|---|
| A | 7960 | 6921 | 0 | 0 | 0.00% | 0.00% | 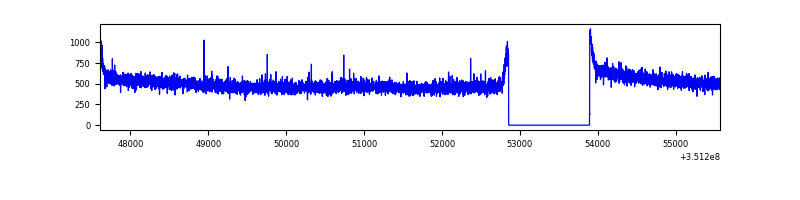 |
| B | 7959 | 6920 | 4 | 4 | 0.05% | 0.06% | 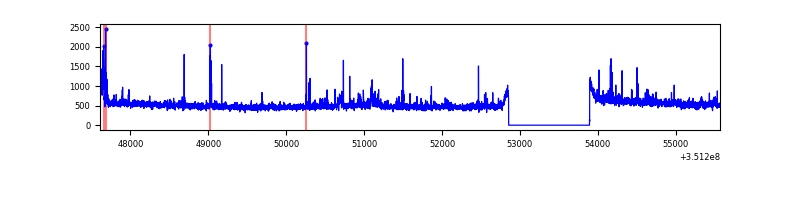 |
| C | 7959 | 6920 | 0 | 0 | 0.00% | 0.00% | 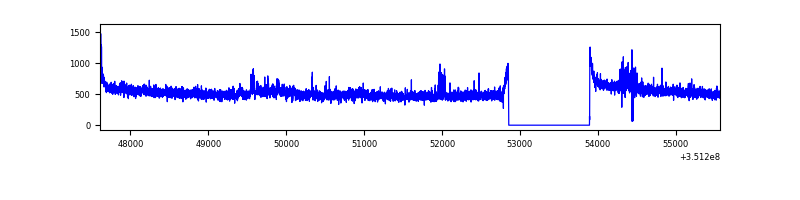 |
| D | 7959 | 6920 | 99 | 99 | 1.24% | 1.43% | 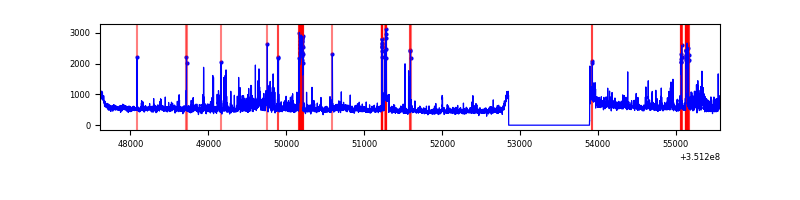 |
Top three noisy pixels from each quadrant. If the there are fewer than three noisy pixels in the level2.evt file, extra rows are filled as -1
| Pixel properties | Quadrant properties | ||||||
|---|---|---|---|---|---|---|---|
| Quadrant | DetID | PixID | Counts | Sigma | Mean | Median | Sigma |
| A | 13 | 254 | 12679 | 65.3 | 899 | 881 | 180.7 |
| A | 3 | 137 | 8623 | 42.85 | 899 | 881 | 180.7 |
| A | 0 | 226 | 7554 | 36.94 | 899 | 881 | 180.7 |
| B | 10 | 246 | 72319 | 418.75 | 884 | 863 | 170.6 |
| B | 10 | 245 | 63399 | 366.47 | 884 | 863 | 170.6 |
| B | 0 | 189 | 35561 | 203.34 | 884 | 863 | 170.6 |
| C | 14 | 238 | 159288 | 789.23 | 858 | 861 | 200.7 |
| C | 3 | 233 | 123033 | 608.62 | 858 | 861 | 200.7 |
| C | 14 | 254 | 32287 | 156.55 | 858 | 861 | 200.7 |
| D | 1 | 52 | 603043 | 2957.83 | 868 | 846 | 203.6 |
| D | 8 | 195 | 290361 | 1422.02 | 868 | 846 | 203.6 |
| D | 2 | 234 | 27016 | 128.54 | 868 | 846 | 203.6 |
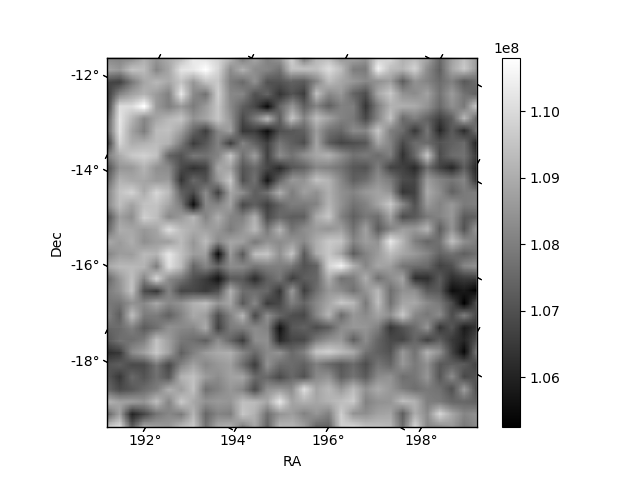
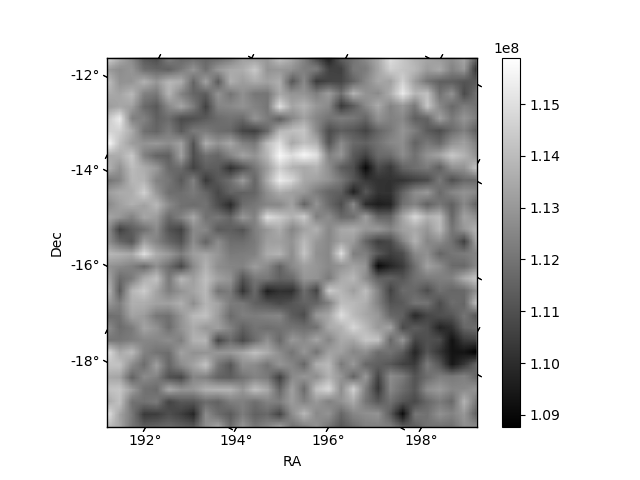
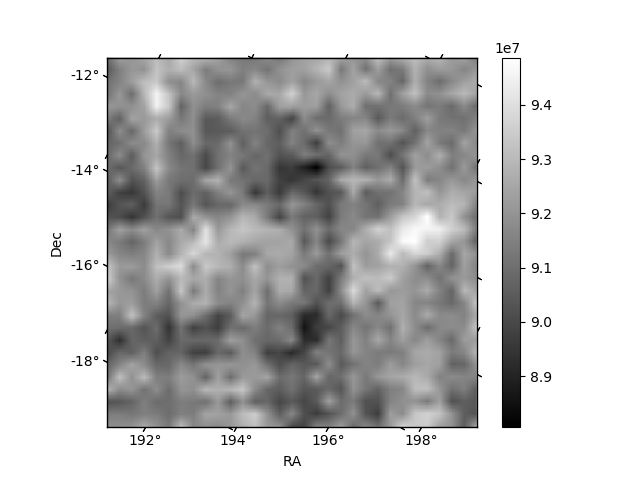
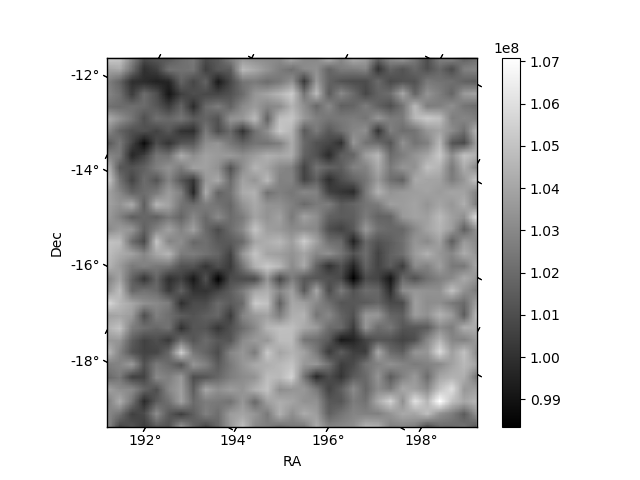
Histogram calculated using DETX and DETY for each event in the final _common_clean file
| Quadrant A | 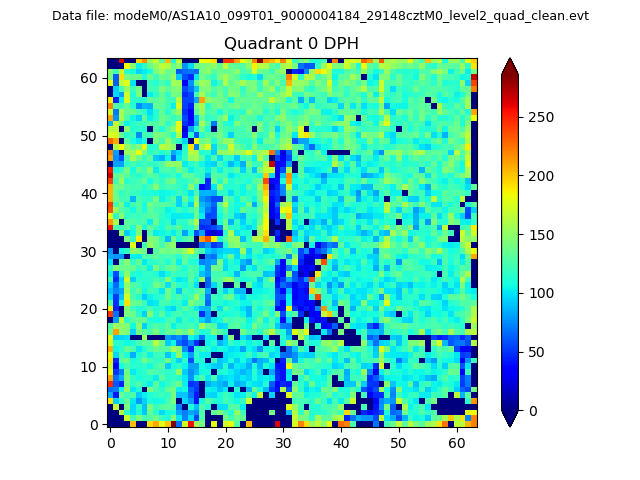 |
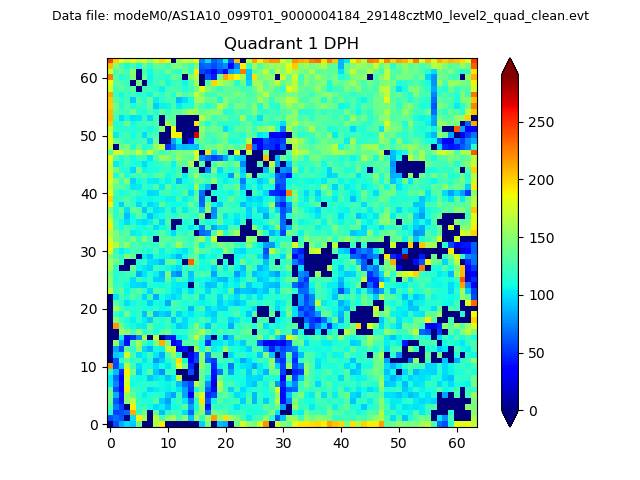 |
Quadrant B |
|---|---|---|---|
| Quadrant D | 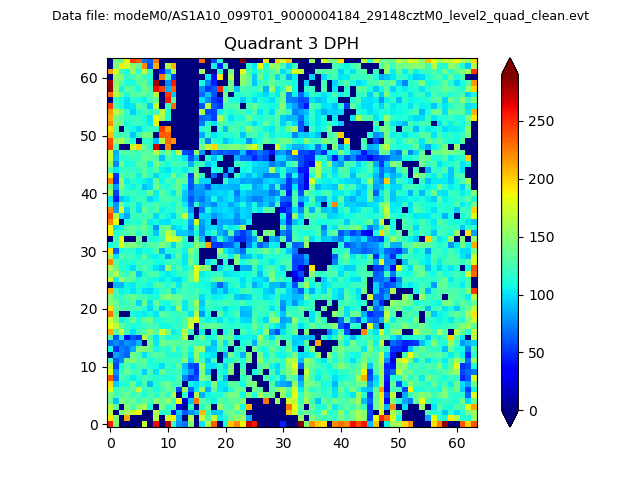 |
 |
Quadrant C |
| Plot type | Count rate plots | Images |
|---|---|---|
| Comparison with Poisson distribution Blue bars denote a histogram of data divided into 1 sec bins. Red curve is a Poisson curve with rate = median count rate of data. |
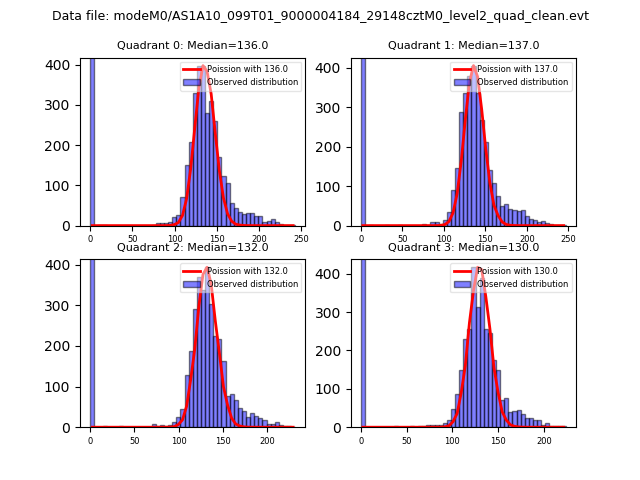 |
 |
| Quadrant-wise count rates Data is divided into 100 sec bins |
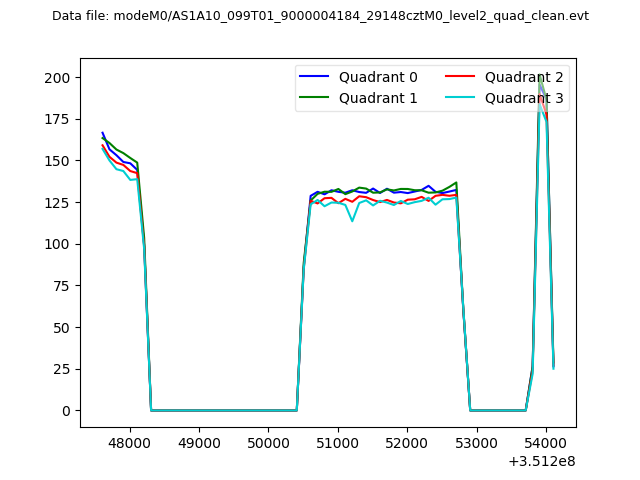 |
|
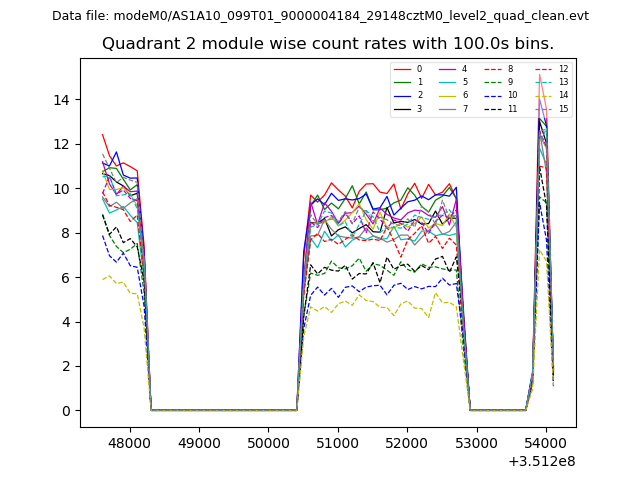
| Module-wise count rates for Quadrant A Data is divided into 100 sec bins |
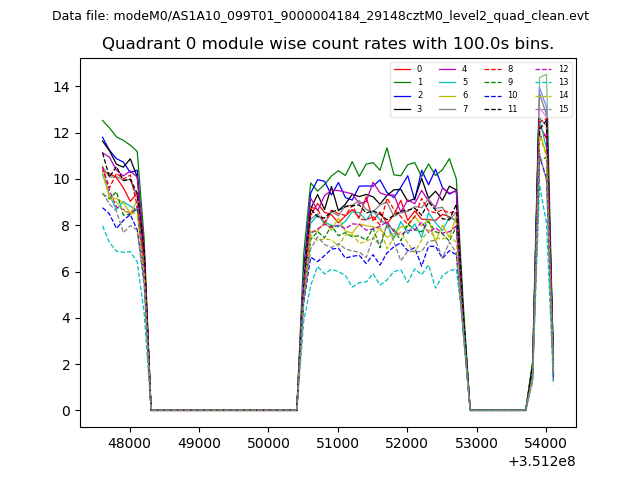 |
 |
| Module-wise count rates for Quadrant B Data is divided into 100 sec bins |
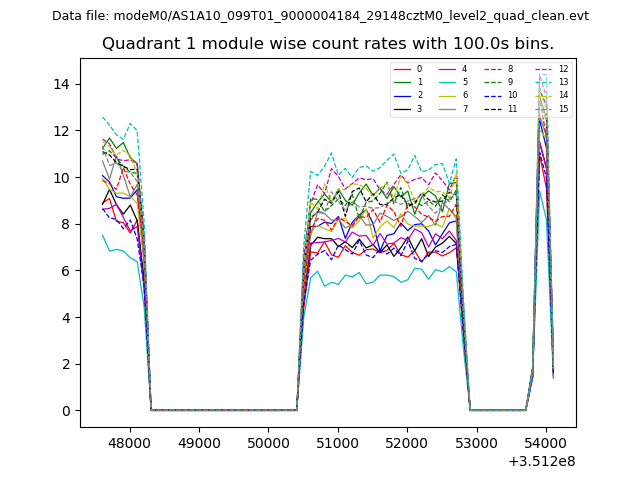 |
 |
| Module-wise count rates for Quadrant C Data is divided into 100 sec bins |
 |
 |
| Module-wise count rates for Quadrant D Data is divided into 100 sec bins |
 |
 |
| Parameter | Plot |
|---|---|
| CZT HV Monitor | 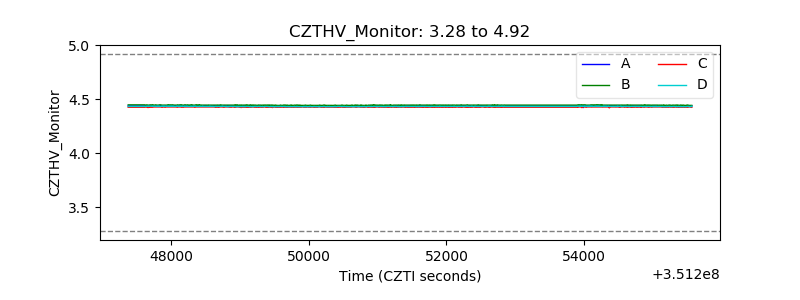 |
| D_VDD | 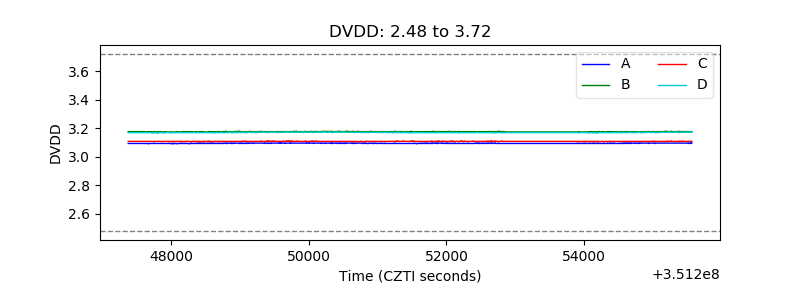 |
| Temperature 1 | 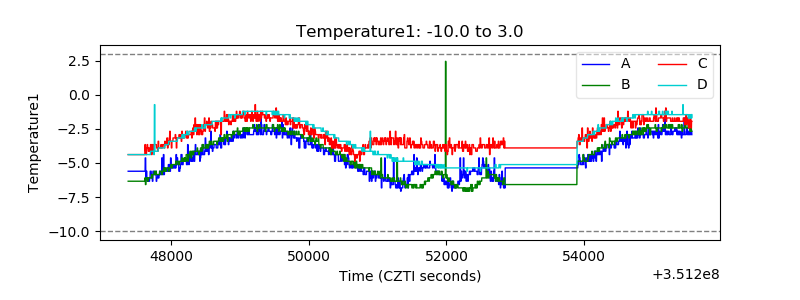 |
| Veto HV Monitor | 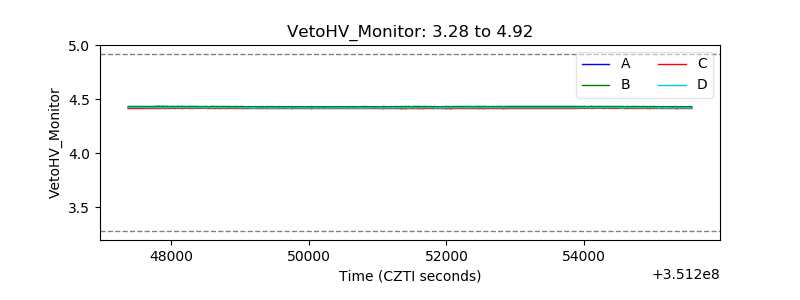 |
| Veto LLD | 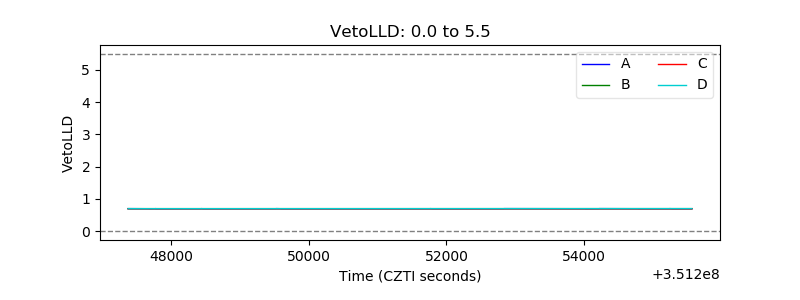 |
| Alpha Counter | 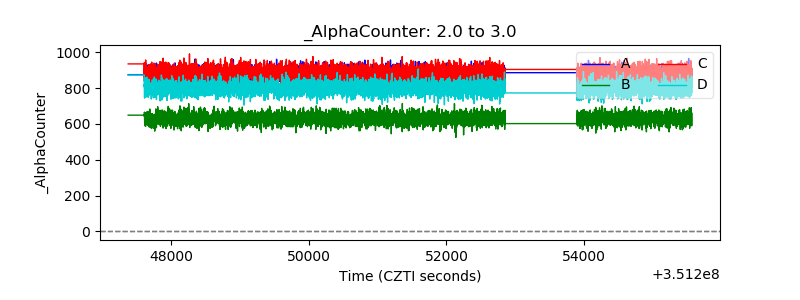 |
| _CPM_Rate | 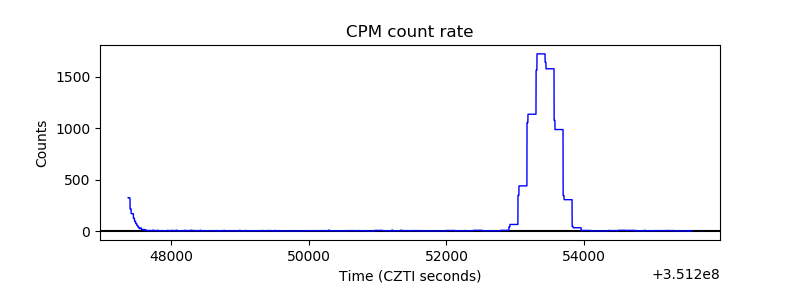 |
| CZT Counter |  |
| +2.5 Volts monitor |  |
| +5 Volts monitor | 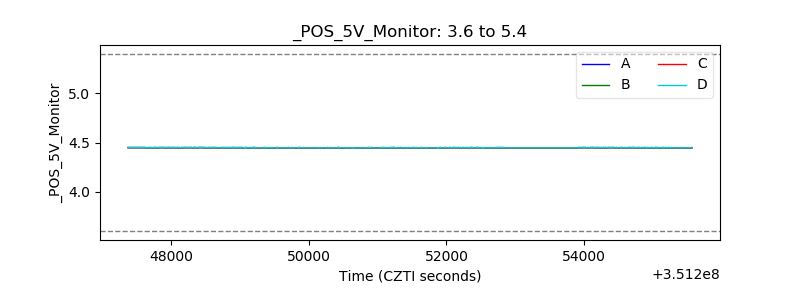 |
| _ROLL_ROT |  |
| _Roll_DEC |  |
| _Roll_RA |  |
| Veto Counter |  |