| Param | Original file | Final file |
|---|---|---|
| Filename | modeM0/AS1A10_099T01_9000004184_29153cztM0_level2.evt | modeM0/AS1A10_099T01_9000004184_29153cztM0_level2_quad_clean.evt |
| Size (bytes) | 540,668,160 | 93,144,960 |
| Size | 515.6 MB | 88.8 MB |
| Events in quadrant A | 3,415,592 | 617,794 |
| Events in quadrant B | 3,598,597 | 629,124 |
| Events in quadrant C | 3,441,772 | 587,736 |
| Events in quadrant D | 5,503,422 | 558,479 |
| Mode M9 | |||
|---|---|---|---|
| Quadrant | BADHDUFLAG | Total packets | Discarded packets |
| A | 0 | 23 | 0 |
| B | 0 | 24 | 0 |
| C | 0 | 24 | 0 |
| D | 0 | 24 | 0 |
| Mode SS | |||
|---|---|---|---|
| Quadrant | BADHDUFLAG | Total packets | Discarded packets |
| A | 0 | 124 | 0 |
| B | 0 | 124 | 0 |
| C | 0 | 124 | 0 |
| D | 0 | 124 | 0 |
| Mode M0 | |||
|---|---|---|---|
| Quadrant | BADHDUFLAG | Total packets | Discarded packets |
| A | 0 | 14135 | 2 |
| B | 0 | 14671 | 2 |
| C | 0 | 14165 | 2 |
| D | 0 | 20618 | 2 |
| Quadrant | Total seconds | Saturated seconds | Saturation percentage |
|---|---|---|---|
| A | 6127 | 114 | 1.860617% |
| B | 6127 | 144 | 2.350253% |
| C | 6127 | 158 | 2.578750% |
| D | 6127 | 420 | 6.854905% |
Noise dominated data is calculated using 1-second bins in cleaned event files. If a bin has >2000 counts, and if more than 50% of those come from <1% of pixels, then it is considered to be noise-dominated and hence unusable.
| Quadrant | # 1 sec bins | Bins with >0 counts | Bins with >2000 counts | High rate bins dominated by noise | Noise dominated (total time) | Noise dominated (detector-on time) | Marked lightcurve |
|---|---|---|---|---|---|---|---|
| A | 7472 | 6128 | 0 | 0 | 0.00% | 0.00% | 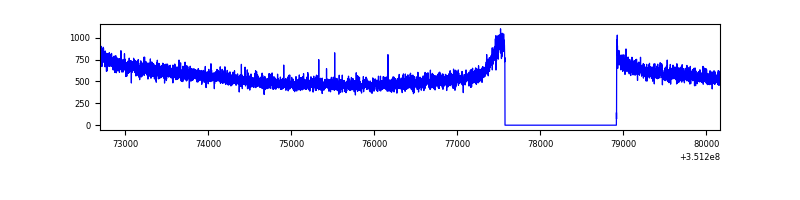 |
| B | 7472 | 6128 | 0 | 0 | 0.00% | 0.00% | 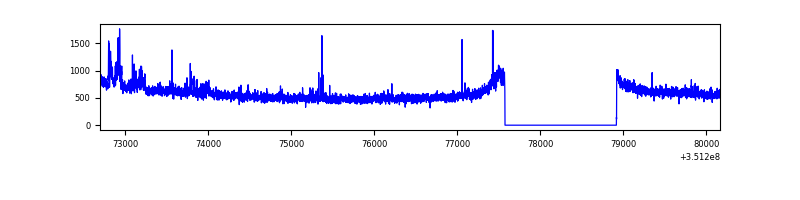 |
| C | 7472 | 6128 | 0 | 0 | 0.00% | 0.00% | 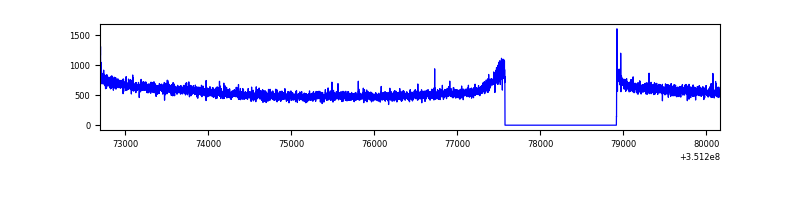 |
| D | 7472 | 6128 | 277 | 277 | 3.71% | 4.52% | 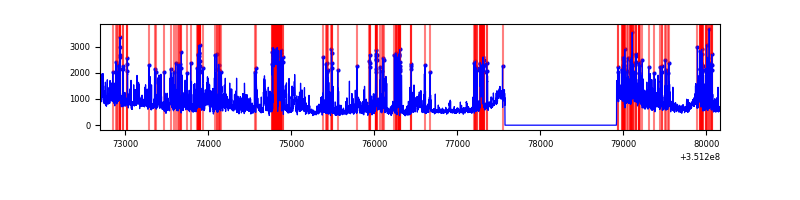 |
Top three noisy pixels from each quadrant. If the there are fewer than three noisy pixels in the level2.evt file, extra rows are filled as -1
| Pixel properties | Quadrant properties | ||||||
|---|---|---|---|---|---|---|---|
| Quadrant | DetID | PixID | Counts | Sigma | Mean | Median | Sigma |
| A | 13 | 254 | 11793 | 62.92 | 884 | 870 | 173.6 |
| A | 3 | 137 | 8021 | 41.19 | 884 | 870 | 173.6 |
| A | 0 | 226 | 7557 | 38.52 | 884 | 870 | 173.6 |
| B | 0 | 189 | 79104 | 475.57 | 878 | 859 | 164.5 |
| B | 0 | 190 | 58268 | 348.93 | 878 | 859 | 164.5 |
| B | 12 | 111 | 19253 | 111.8 | 878 | 859 | 164.5 |
| C | 14 | 238 | 137196 | 707.64 | 835 | 845 | 192.7 |
| C | 3 | 233 | 26078 | 130.96 | 835 | 845 | 192.7 |
| C | 2 | 114 | 14777 | 72.31 | 835 | 845 | 192.7 |
| D | 1 | 52 | 1951621 | 10032.99 | 820 | 801 | 194.4 |
| D | 8 | 195 | 342594 | 1757.83 | 820 | 801 | 194.4 |
| D | 12 | 233 | 42137 | 212.59 | 820 | 801 | 194.4 |
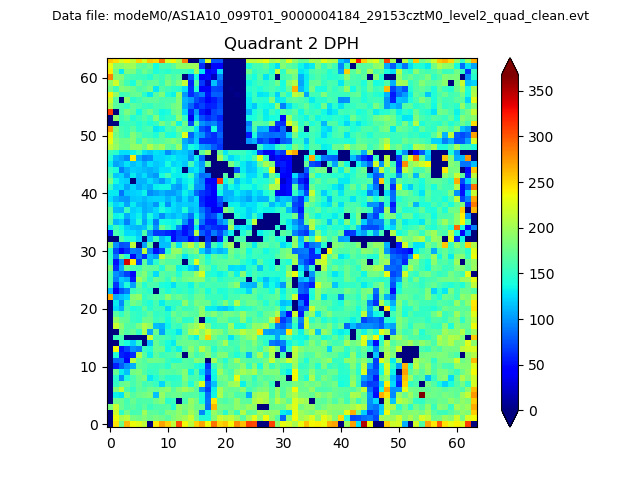
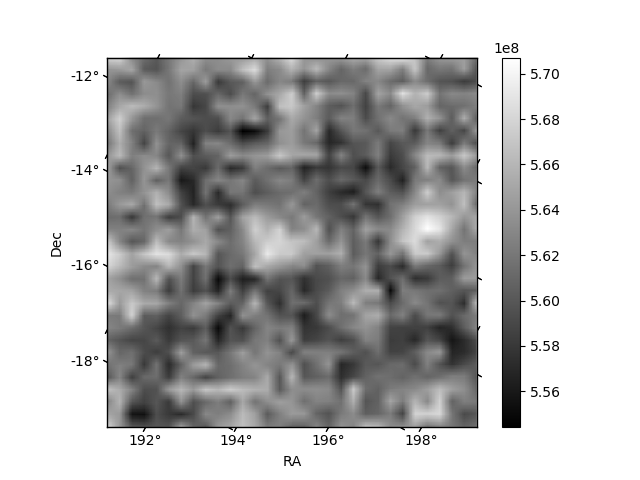
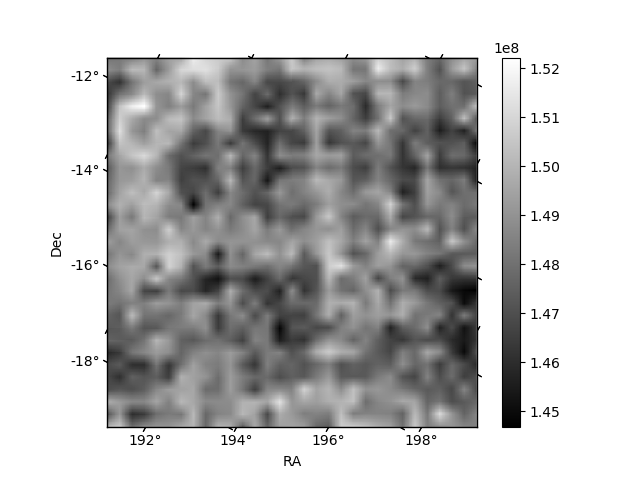
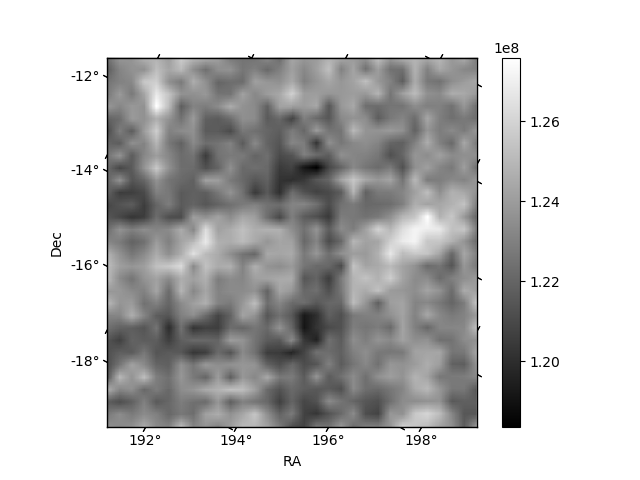
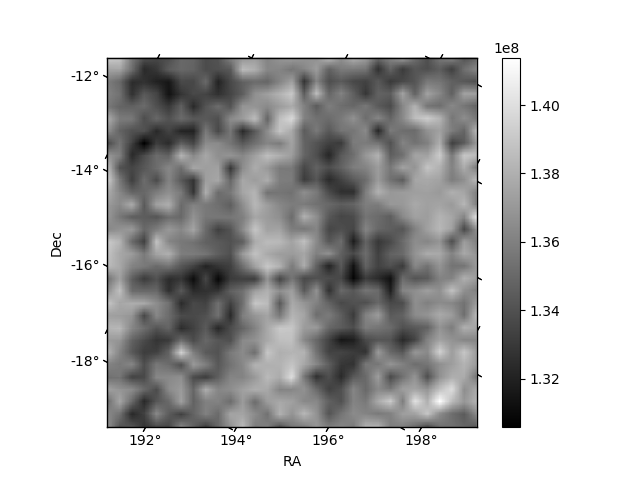
Histogram calculated using DETX and DETY for each event in the final _common_clean file
| Quadrant A | 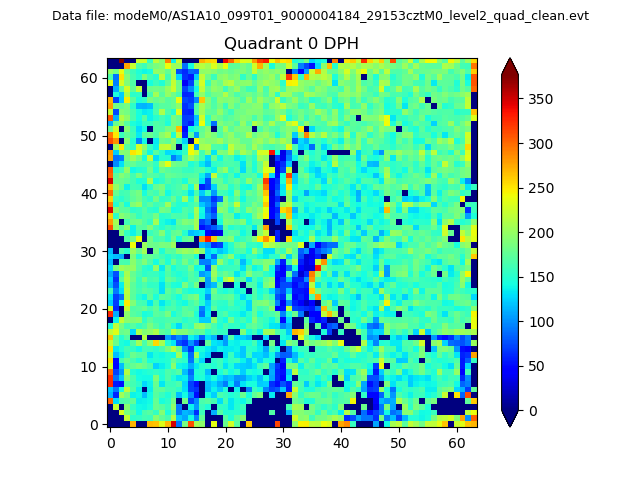 |
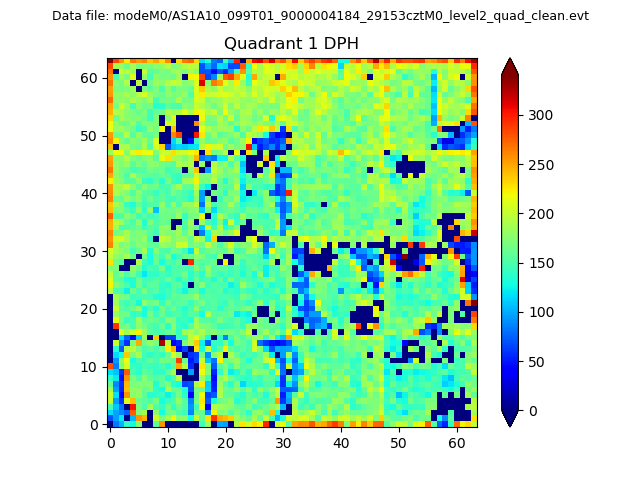 |
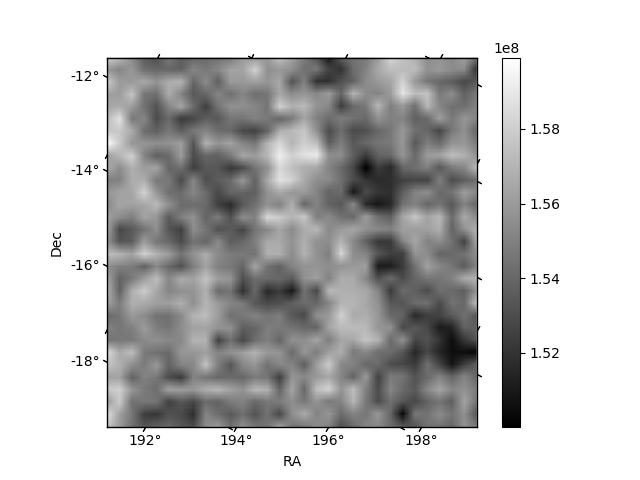
Quadrant B |
|---|---|---|---|
| Quadrant D | 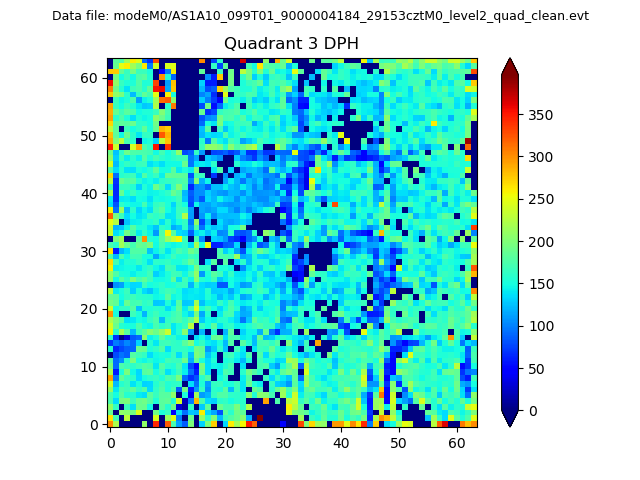 |
 |
Quadrant C |
| Plot type | Count rate plots | Images |
|---|---|---|
| Comparison with Poisson distribution Blue bars denote a histogram of data divided into 1 sec bins. Red curve is a Poisson curve with rate = median count rate of data. |
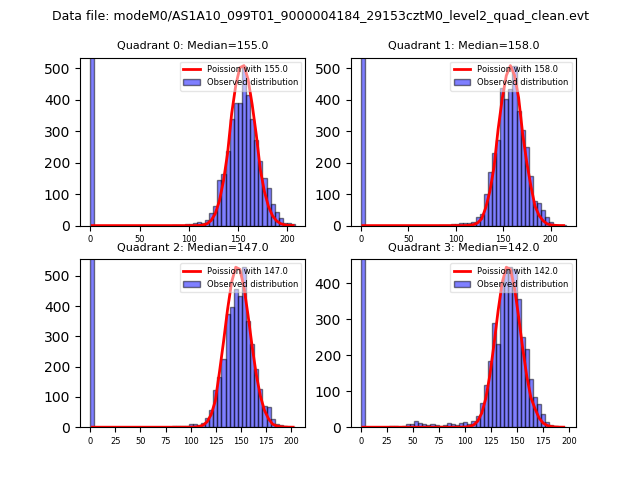 |
 |
| Quadrant-wise count rates Data is divided into 100 sec bins |
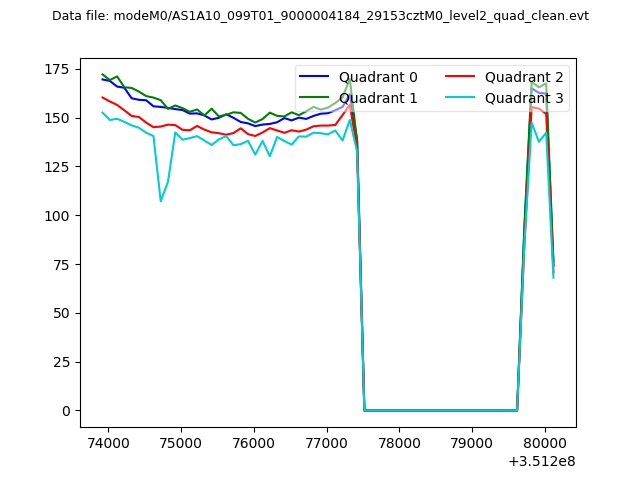 |
|
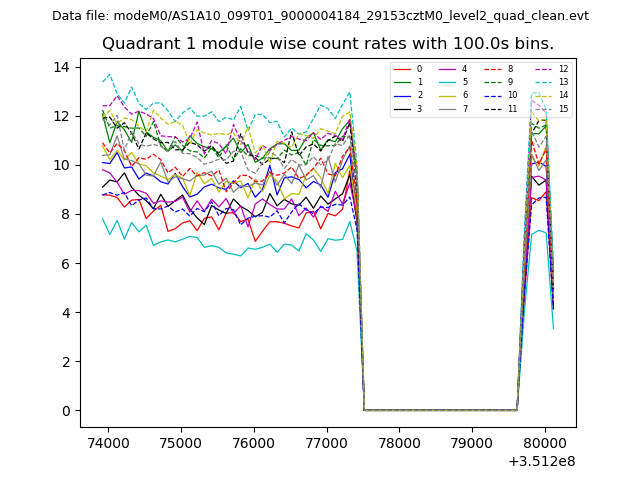
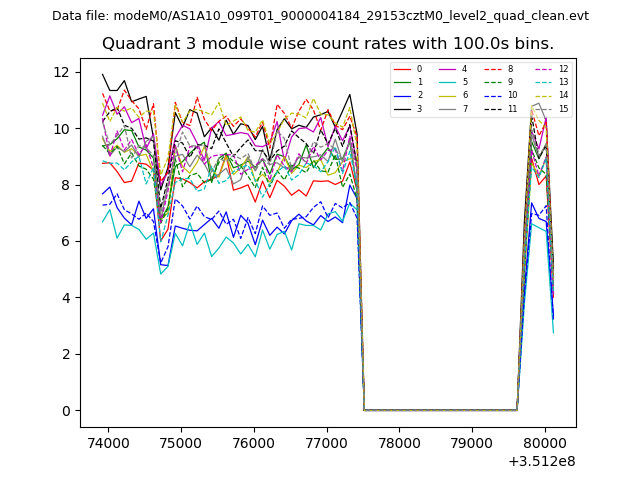
| Module-wise count rates for Quadrant A Data is divided into 100 sec bins |
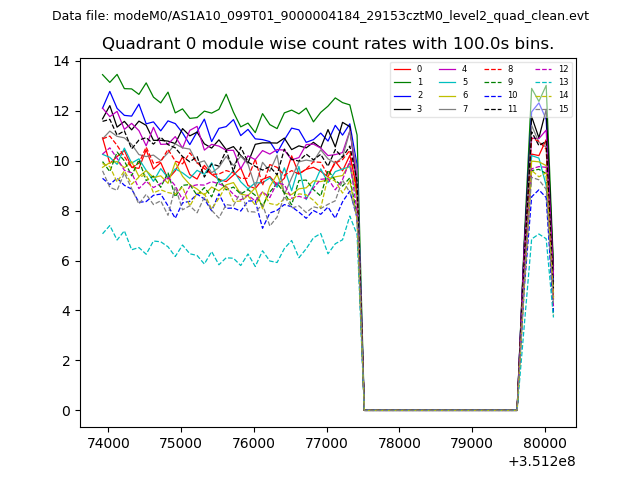 |
 |
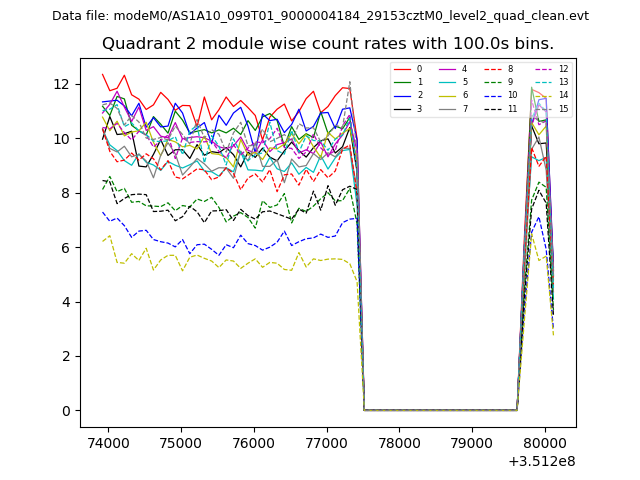
| Module-wise count rates for Quadrant B Data is divided into 100 sec bins |
 |
 |
| Module-wise count rates for Quadrant C Data is divided into 100 sec bins |
 |
 |
| Module-wise count rates for Quadrant D Data is divided into 100 sec bins |
 |
 |
| Parameter | Plot |
|---|---|
| CZT HV Monitor | 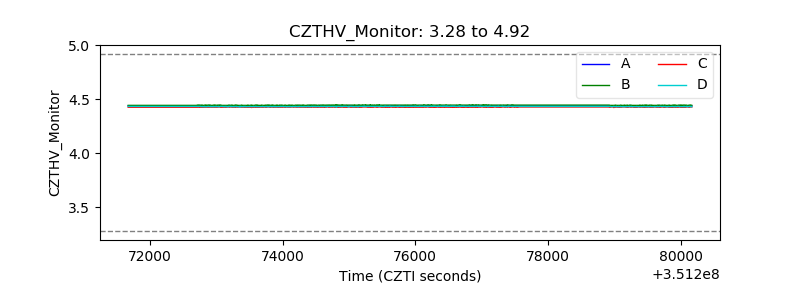 |
| D_VDD | 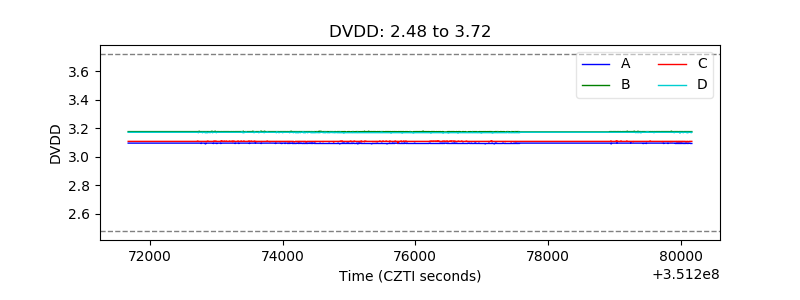 |
| Temperature 1 | 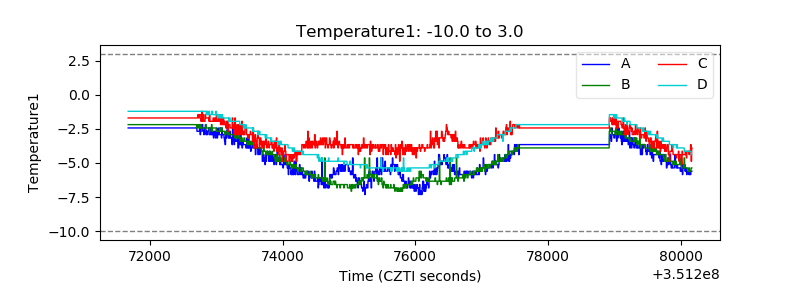 |
| Veto HV Monitor | 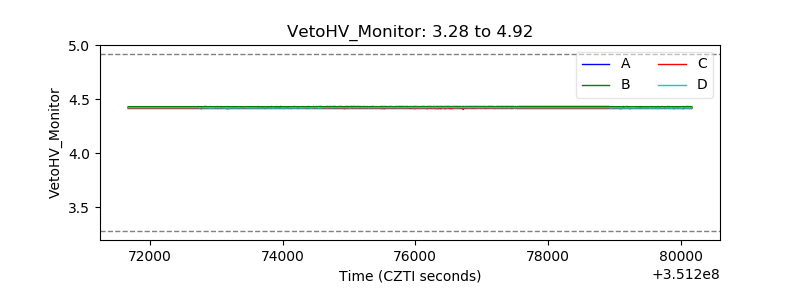 |
| Veto LLD | 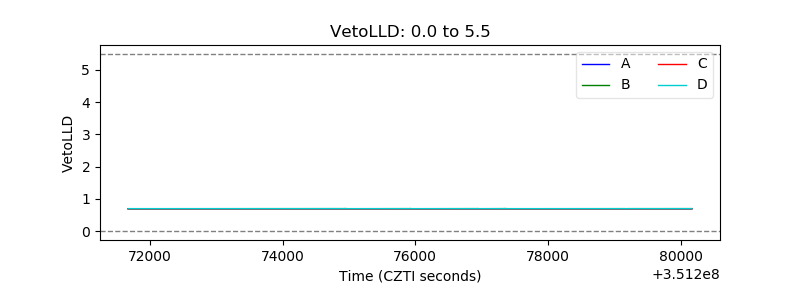 |
| Alpha Counter | 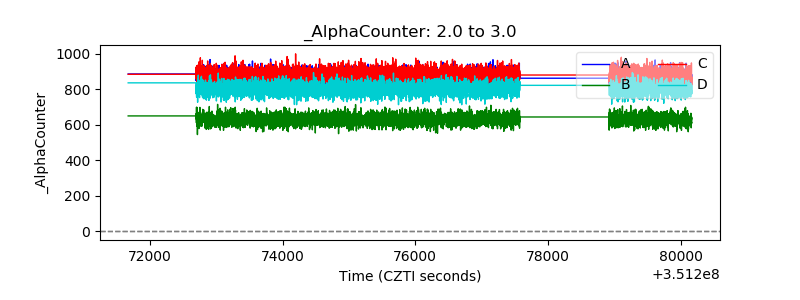 |
| _CPM_Rate | 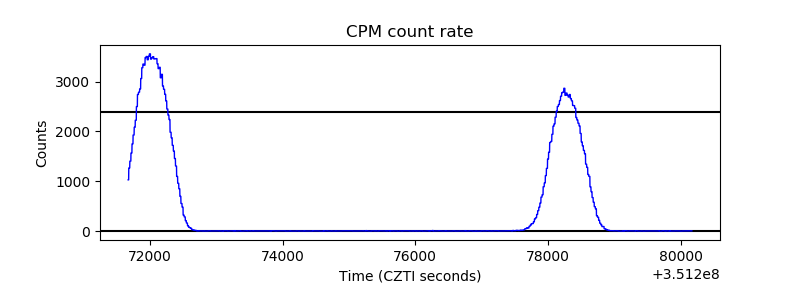 |
| CZT Counter | 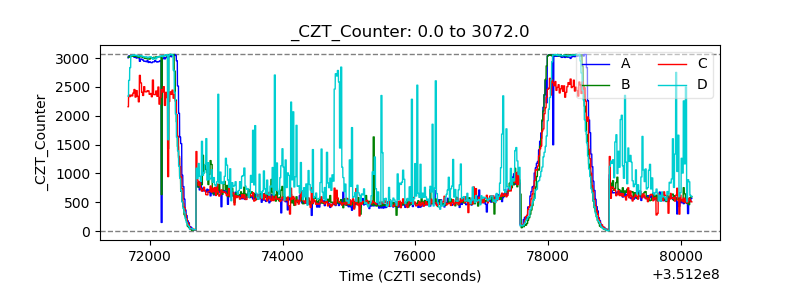 |
| +2.5 Volts monitor |  |
| +5 Volts monitor |  |
| _ROLL_ROT | 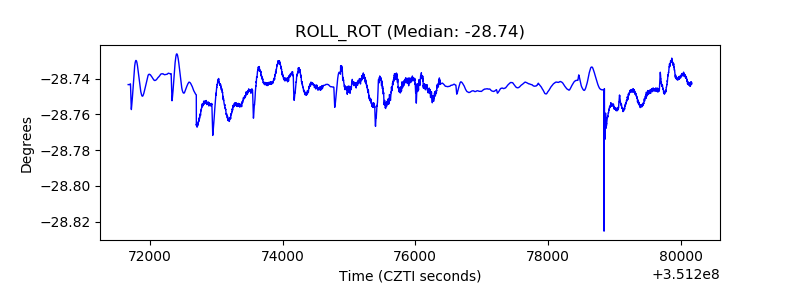 |
| _Roll_DEC | 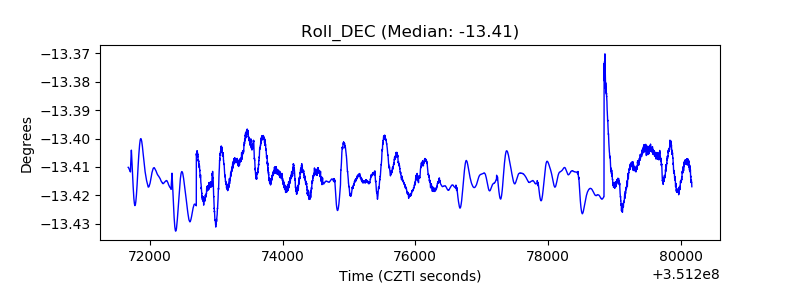 |
| _Roll_RA | 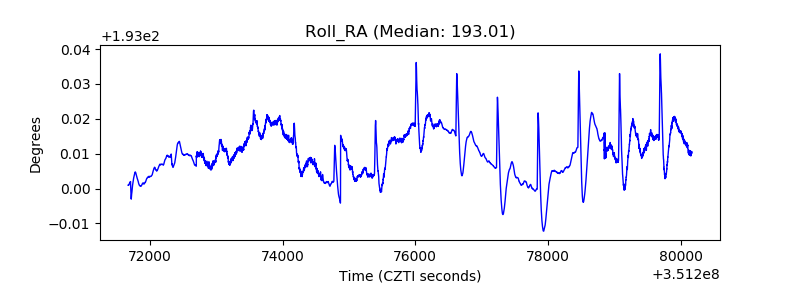 |
| Veto Counter | 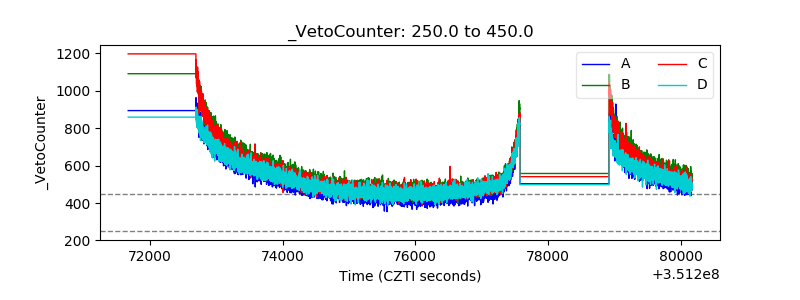 |