| Param | Original file | Final file |
|---|---|---|
| Filename | modeM0/AS1A10_099T01_9000004184_29155cztM0_level2.evt | modeM0/AS1A10_099T01_9000004184_29155cztM0_level2_quad_clean.evt |
| Size (bytes) | 592,030,080 | 104,613,120 |
| Size | 564.6 MB | 99.8 MB |
| Events in quadrant A | 3,576,755 | 688,400 |
| Events in quadrant B | 3,793,773 | 703,371 |
| Events in quadrant C | 3,639,743 | 663,643 |
| Events in quadrant D | 6,440,884 | 620,920 |
| Mode M9 | |||
|---|---|---|---|
| Quadrant | BADHDUFLAG | Total packets | Discarded packets |
| A | 0 | 23 | 0 |
| B | 0 | 23 | 0 |
| C | 0 | 23 | 0 |
| D | 0 | 23 | 0 |
| Mode SS | |||
|---|---|---|---|
| Quadrant | BADHDUFLAG | Total packets | Discarded packets |
| A | 0 | 144 | 0 |
| B | 0 | 144 | 0 |
| C | 0 | 144 | 0 |
| D | 0 | 144 | 0 |
| Mode M0 | |||
|---|---|---|---|
| Quadrant | BADHDUFLAG | Total packets | Discarded packets |
| A | 0 | 15111 | 2 |
| B | 0 | 15749 | 2 |
| C | 0 | 15183 | 2 |
| D | 0 | 24001 | 2 |
| Quadrant | Total seconds | Saturated seconds | Saturation percentage |
|---|---|---|---|
| A | 7066 | 108 | 1.528446% |
| B | 7066 | 165 | 2.335126% |
| C | 7065 | 155 | 2.193914% |
| D | 7065 | 675 | 9.554140% |
Noise dominated data is calculated using 1-second bins in cleaned event files. If a bin has >2000 counts, and if more than 50% of those come from <1% of pixels, then it is considered to be noise-dominated and hence unusable.
| Quadrant | # 1 sec bins | Bins with >0 counts | Bins with >2000 counts | High rate bins dominated by noise | Noise dominated (total time) | Noise dominated (detector-on time) | Marked lightcurve |
|---|---|---|---|---|---|---|---|
| A | 9326 | 7068 | 0 | 0 | 0.00% | 0.00% | 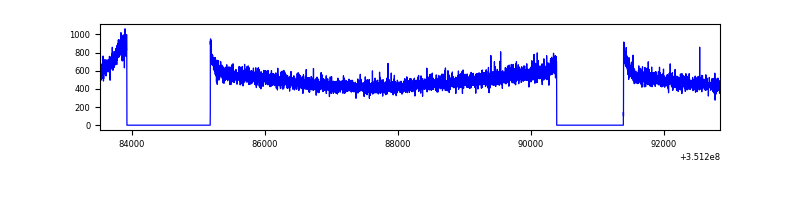 |
| B | 9326 | 7068 | 3 | 3 | 0.03% | 0.04% | 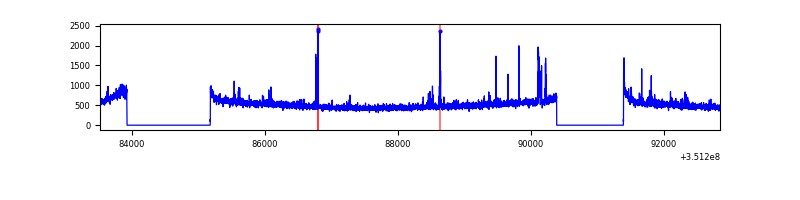 |
| C | 9325 | 7067 | 0 | 0 | 0.00% | 0.00% | 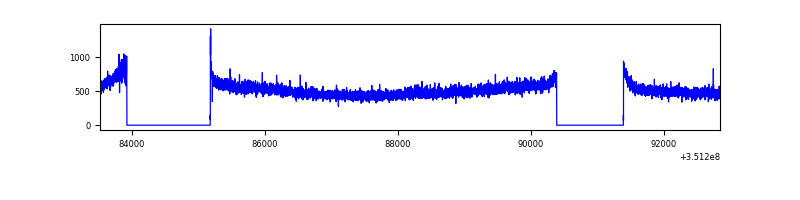 |
| D | 9325 | 7067 | 529 | 529 | 5.67% | 7.49% | 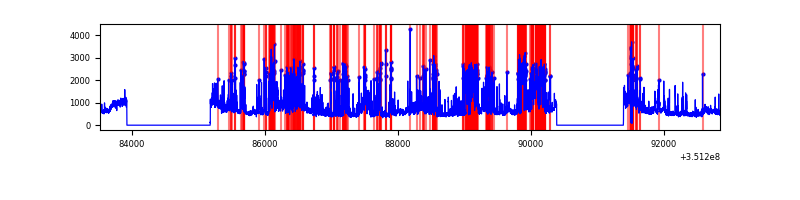 |
Top three noisy pixels from each quadrant. If the there are fewer than three noisy pixels in the level2.evt file, extra rows are filled as -1
| Pixel properties | Quadrant properties | ||||||
|---|---|---|---|---|---|---|---|
| Quadrant | DetID | PixID | Counts | Sigma | Mean | Median | Sigma |
| A | 13 | 254 | 13345 | 67.38 | 925 | 907 | 184.6 |
| A | 3 | 137 | 9136 | 44.58 | 925 | 907 | 184.6 |
| A | 0 | 226 | 7979 | 38.31 | 925 | 907 | 184.6 |
| B | 0 | 190 | 58639 | 326.58 | 920 | 898 | 176.8 |
| B | 0 | 183 | 32234 | 177.24 | 920 | 898 | 176.8 |
| B | 0 | 189 | 26939 | 147.29 | 920 | 898 | 176.8 |
| C | 14 | 238 | 144148 | 694.7 | 884 | 891 | 206.2 |
| C | 3 | 233 | 28824 | 135.45 | 884 | 891 | 206.2 |
| C | 2 | 114 | 17003 | 78.13 | 884 | 891 | 206.2 |
| D | 1 | 52 | 2344814 | 11418.5 | 857 | 836 | 205.3 |
| D | 8 | 195 | 700471 | 3408.22 | 857 | 836 | 205.3 |
| D | 10 | 33 | 112637 | 544.63 | 857 | 836 | 205.3 |
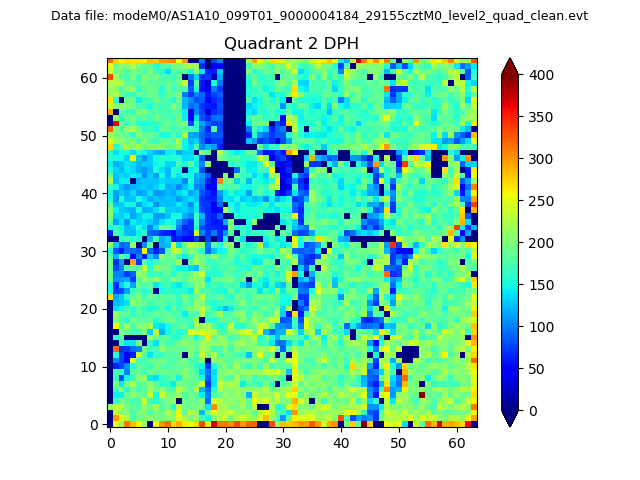
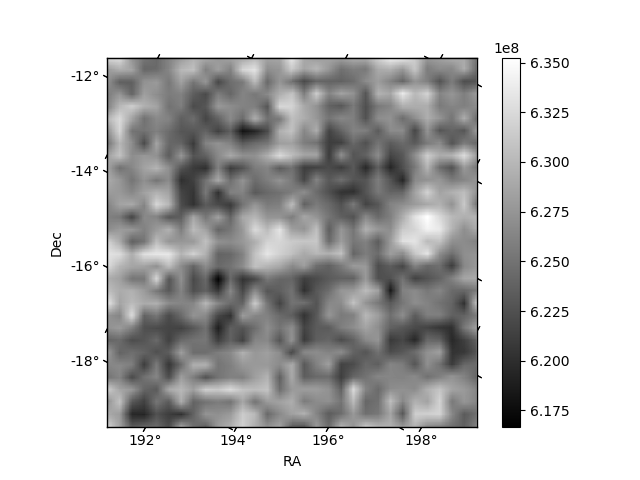
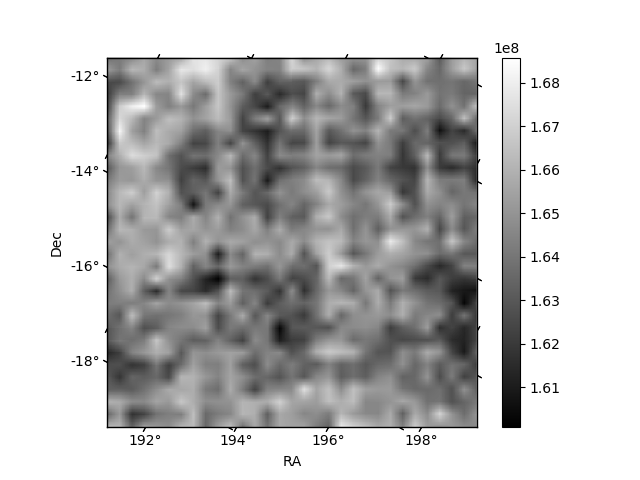
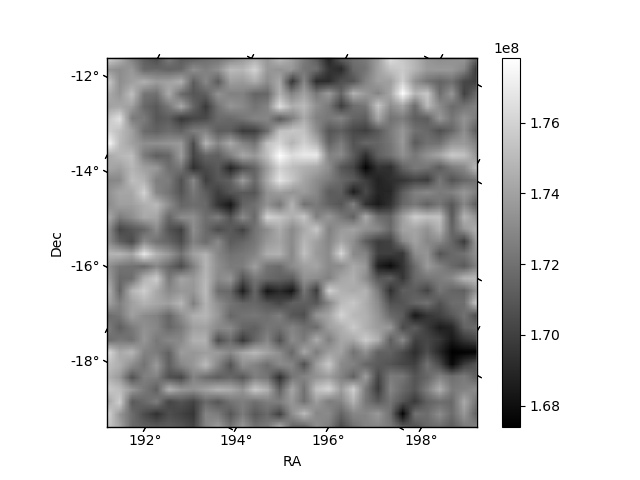
Histogram calculated using DETX and DETY for each event in the final _common_clean file
| Quadrant A | 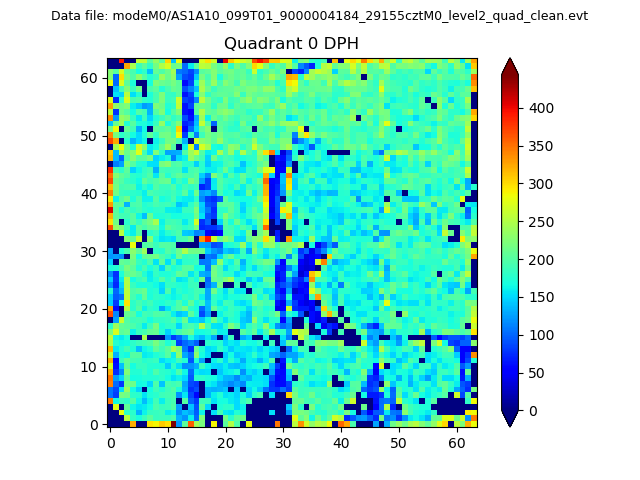 |
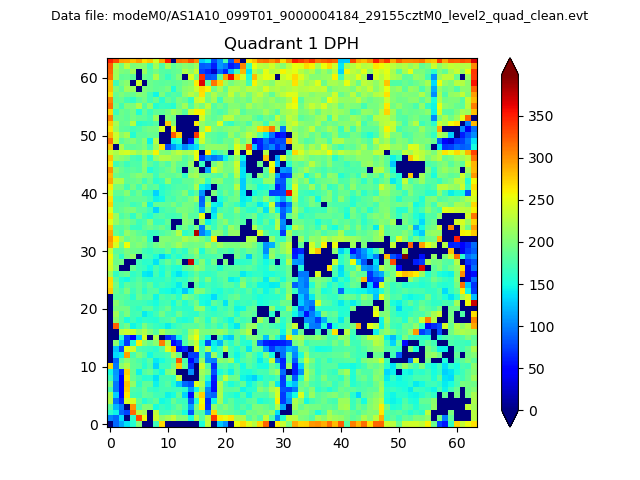 |
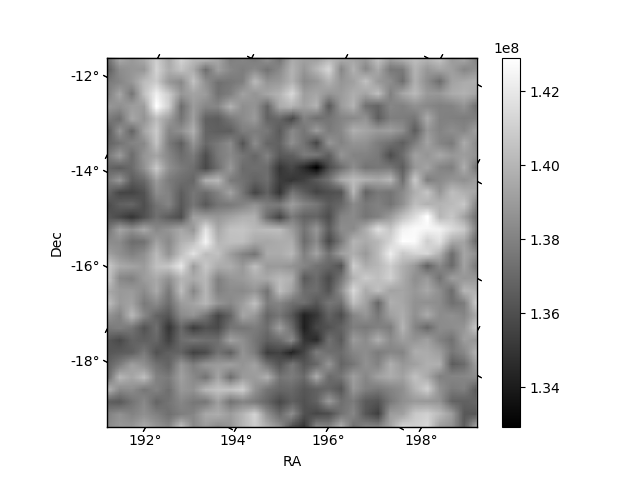
Quadrant B |
|---|---|---|---|
| Quadrant D | 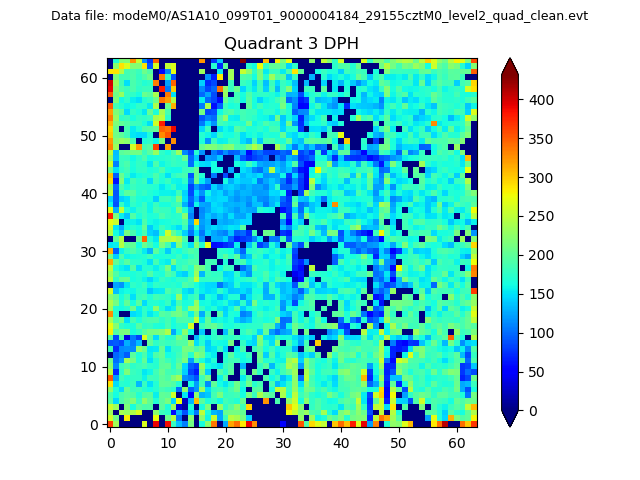 |
 |
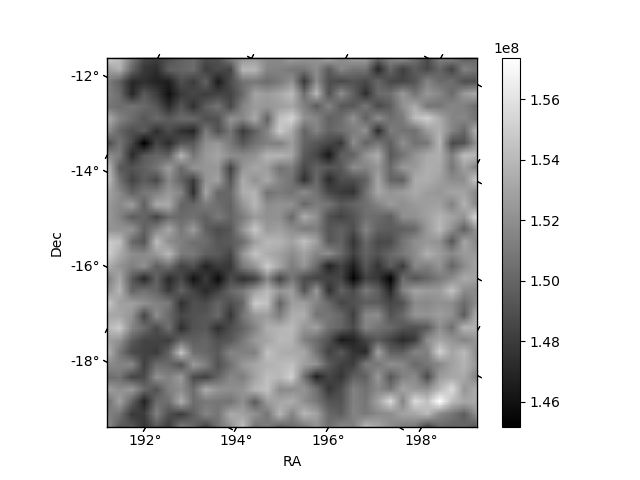
Quadrant C |
| Plot type | Count rate plots | Images |
|---|---|---|
| Comparison with Poisson distribution Blue bars denote a histogram of data divided into 1 sec bins. Red curve is a Poisson curve with rate = median count rate of data. |
 |
 |
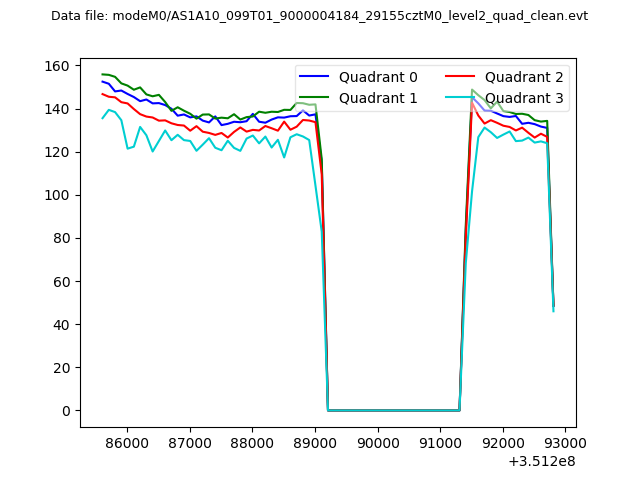
| Quadrant-wise count rates Data is divided into 100 sec bins |
 |
|
| Module-wise count rates for Quadrant A Data is divided into 100 sec bins |
 |
 |
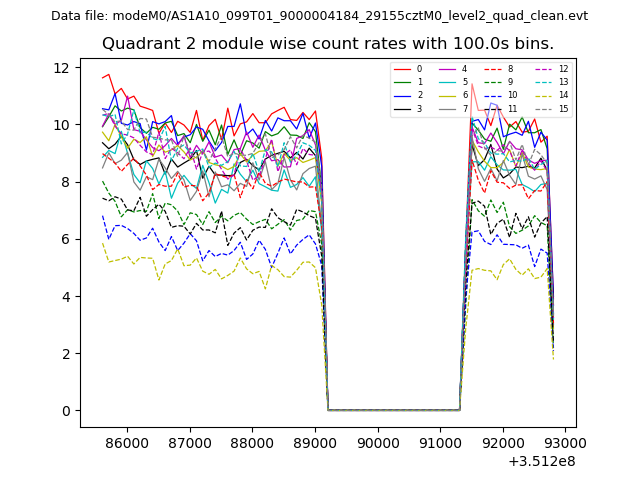
| Module-wise count rates for Quadrant B Data is divided into 100 sec bins |
 |
 |
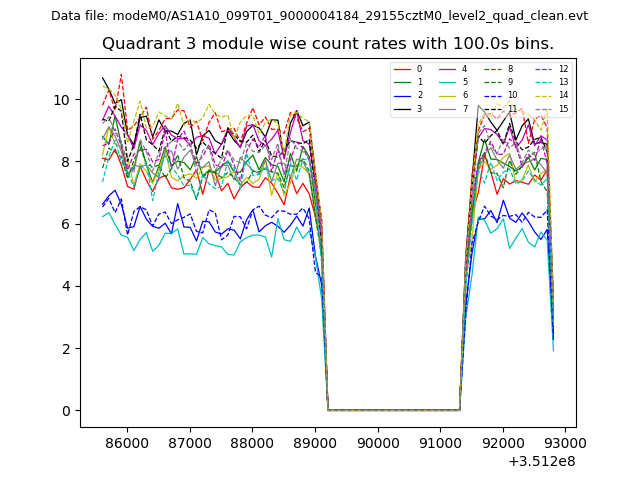
| Module-wise count rates for Quadrant C Data is divided into 100 sec bins |
 |
 |
| Module-wise count rates for Quadrant D Data is divided into 100 sec bins |
 |
 |
| Parameter | Plot |
|---|---|
| CZT HV Monitor |  |
| D_VDD | 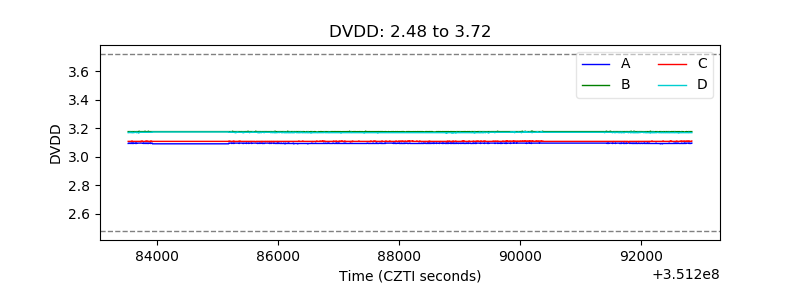 |
| Temperature 1 | 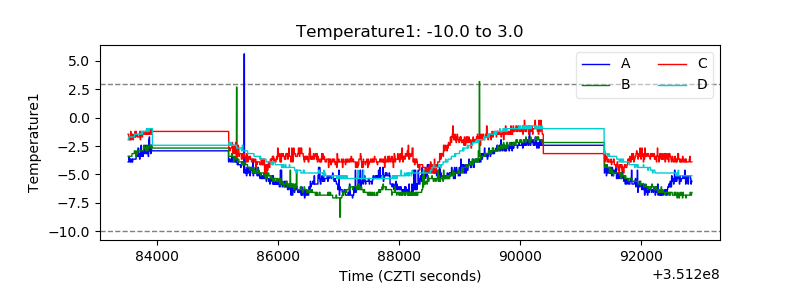 |
| Veto HV Monitor | 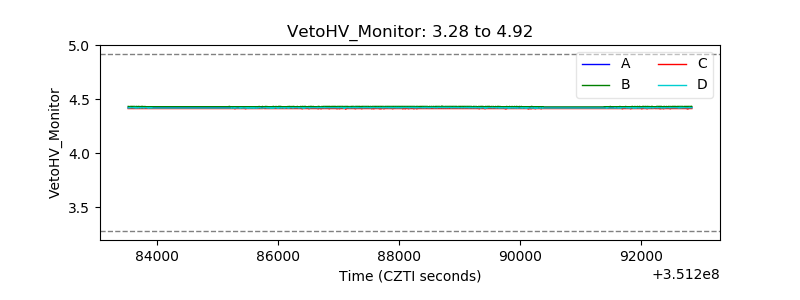 |
| Veto LLD | 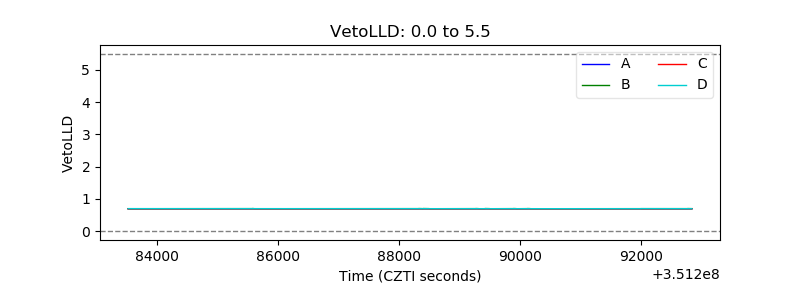 |
| Alpha Counter | 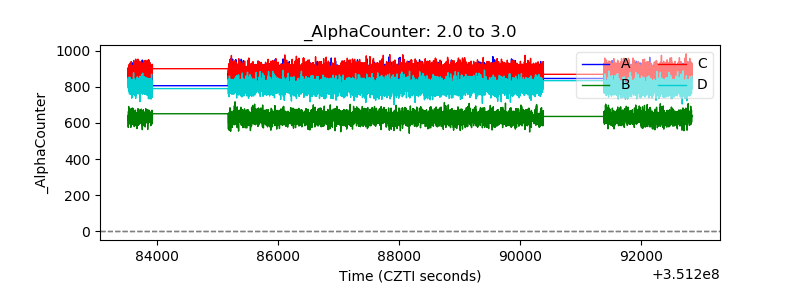 |
| _CPM_Rate | 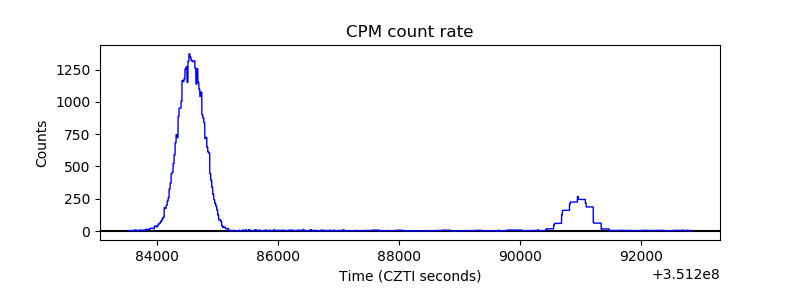 |
| CZT Counter |  |
| +2.5 Volts monitor |  |
| +5 Volts monitor |  |
| _ROLL_ROT | 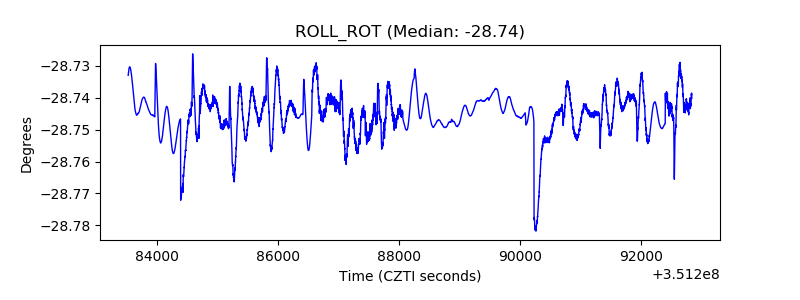 |
| _Roll_DEC | 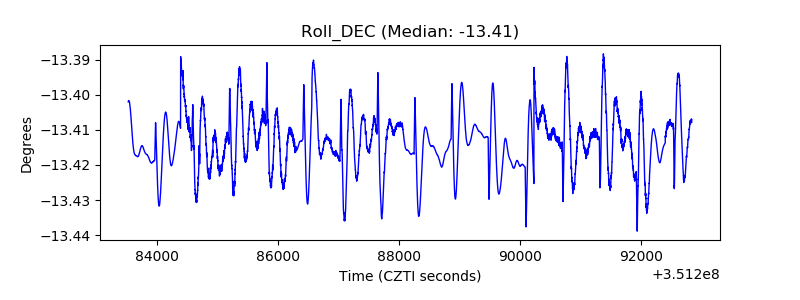 |
| _Roll_RA |  |
| Veto Counter | 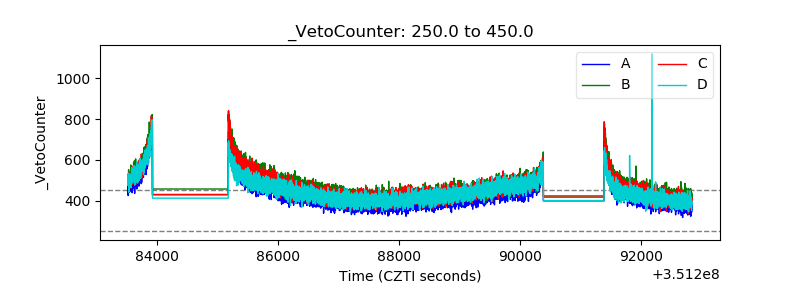 |