| Param | Original file | Final file |
|---|---|---|
| Filename | modeM0/AS1A10_099T01_9000004184_29156cztM0_level2.evt | modeM0/AS1A10_099T01_9000004184_29156cztM0_level2_quad_clean.evt |
| Size (bytes) | 610,505,280 | 109,224,000 |
| Size | 582.2 MB | 104.2 MB |
| Events in quadrant A | 3,833,633 | 704,344 |
| Events in quadrant B | 4,133,016 | 717,033 |
| Events in quadrant C | 3,902,250 | 684,852 |
| Events in quadrant D | 6,087,981 | 655,755 |
| Mode M9 | |||
|---|---|---|---|
| Quadrant | BADHDUFLAG | Total packets | Discarded packets |
| A | 0 | 15 | 0 |
| B | 0 | 15 | 0 |
| C | 0 | 15 | 0 |
| D | 0 | 15 | 0 |
| Mode SS | |||
|---|---|---|---|
| Quadrant | BADHDUFLAG | Total packets | Discarded packets |
| A | 0 | 160 | 0 |
| B | 0 | 160 | 0 |
| C | 0 | 160 | 0 |
| D | 0 | 160 | 0 |
| Mode M0 | |||
|---|---|---|---|
| Quadrant | BADHDUFLAG | Total packets | Discarded packets |
| A | 0 | 16502 | 2 |
| B | 0 | 17335 | 2 |
| C | 0 | 16574 | 2 |
| D | 0 | 23540 | 2 |
| Quadrant | Total seconds | Saturated seconds | Saturation percentage |
|---|---|---|---|
| A | 7855 | 34 | 0.432845% |
| B | 7855 | 139 | 1.769574% |
| C | 7855 | 114 | 1.451305% |
| D | 7855 | 514 | 6.543603% |
Noise dominated data is calculated using 1-second bins in cleaned event files. If a bin has >2000 counts, and if more than 50% of those come from <1% of pixels, then it is considered to be noise-dominated and hence unusable.
| Quadrant | # 1 sec bins | Bins with >0 counts | Bins with >2000 counts | High rate bins dominated by noise | Noise dominated (total time) | Noise dominated (detector-on time) | Marked lightcurve |
|---|---|---|---|---|---|---|---|
| A | 9345 | 7857 | 0 | 0 | 0.00% | 0.00% | 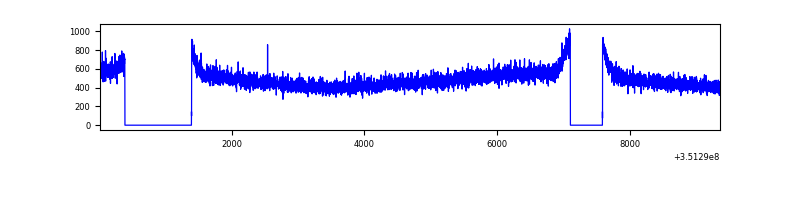 |
| B | 9345 | 7857 | 6 | 6 | 0.06% | 0.08% | 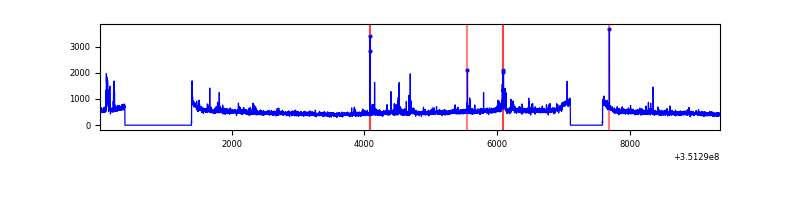 |
| C | 9345 | 7857 | 0 | 0 | 0.00% | 0.00% | 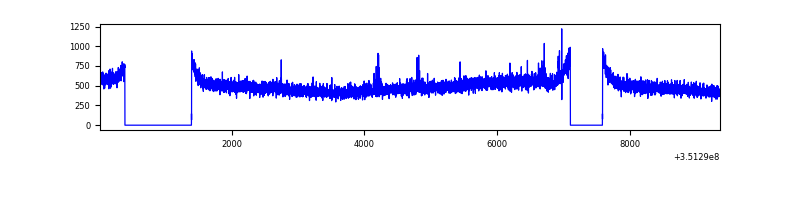 |
| D | 9345 | 7857 | 209 | 209 | 2.24% | 2.66% | 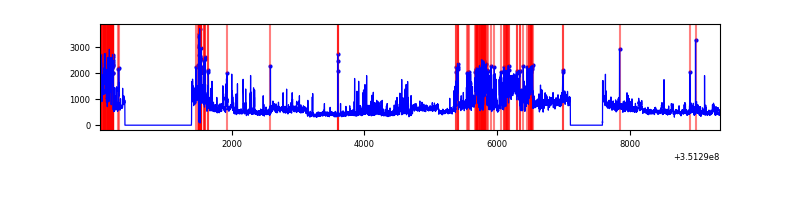 |
Top three noisy pixels from each quadrant. If the there are fewer than three noisy pixels in the level2.evt file, extra rows are filled as -1
| Pixel properties | Quadrant properties | ||||||
|---|---|---|---|---|---|---|---|
| Quadrant | DetID | PixID | Counts | Sigma | Mean | Median | Sigma |
| A | 13 | 254 | 15291 | 71.74 | 992 | 972 | 199.6 |
| A | 3 | 137 | 9773 | 44.09 | 992 | 972 | 199.6 |
| A | 0 | 226 | 8469 | 37.56 | 992 | 972 | 199.6 |
| B | 0 | 190 | 92796 | 485.14 | 985 | 959 | 189.3 |
| B | 10 | 246 | 55134 | 286.19 | 985 | 959 | 189.3 |
| B | 0 | 183 | 48788 | 252.66 | 985 | 959 | 189.3 |
| C | 14 | 238 | 161248 | 717.16 | 949 | 956 | 223.5 |
| C | 2 | 114 | 18872 | 80.16 | 949 | 956 | 223.5 |
| C | 14 | 254 | 15117 | 63.36 | 949 | 956 | 223.5 |
| D | 1 | 52 | 1597829 | 7263.51 | 929 | 903 | 219.9 |
| D | 8 | 195 | 811857 | 3688.57 | 929 | 903 | 219.9 |
| D | 10 | 33 | 59610 | 267.02 | 929 | 903 | 219.9 |
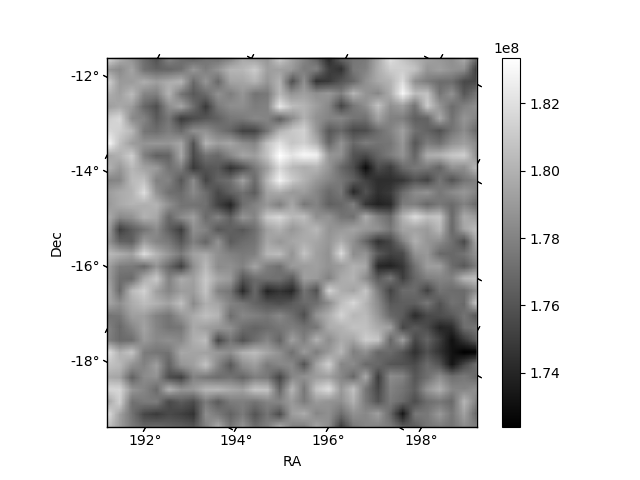
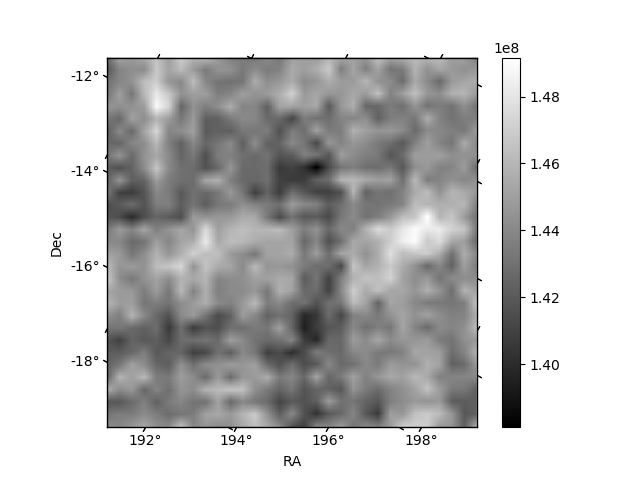
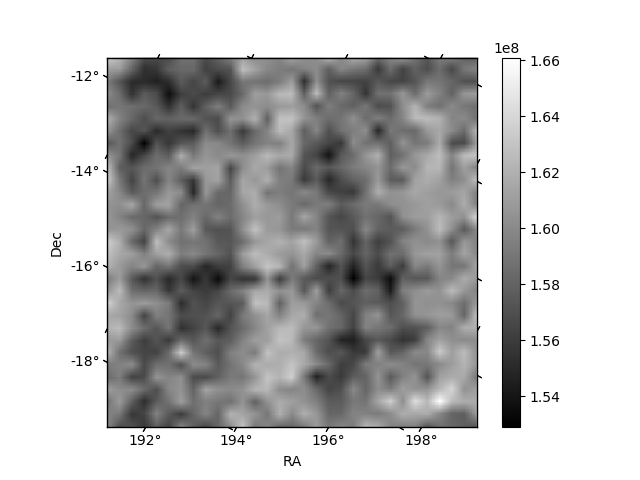
Histogram calculated using DETX and DETY for each event in the final _common_clean file
| Quadrant A |  |
 |
Quadrant B |
|---|---|---|---|
| Quadrant D |  |
 |
Quadrant C |
| Plot type | Count rate plots | Images |
|---|---|---|
| Comparison with Poisson distribution Blue bars denote a histogram of data divided into 1 sec bins. Red curve is a Poisson curve with rate = median count rate of data. |
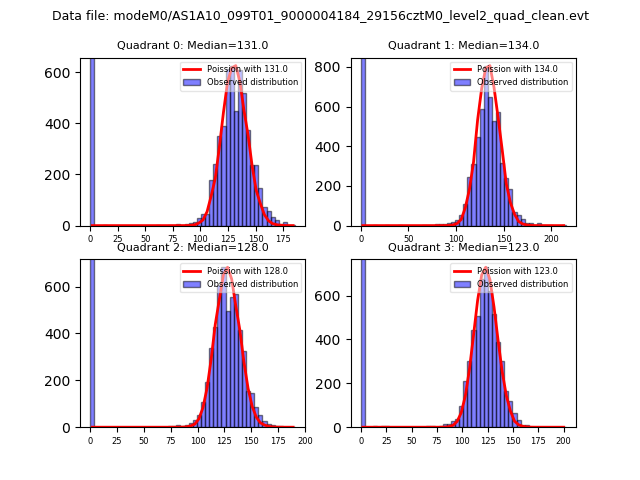 |
 |
| Quadrant-wise count rates Data is divided into 100 sec bins |
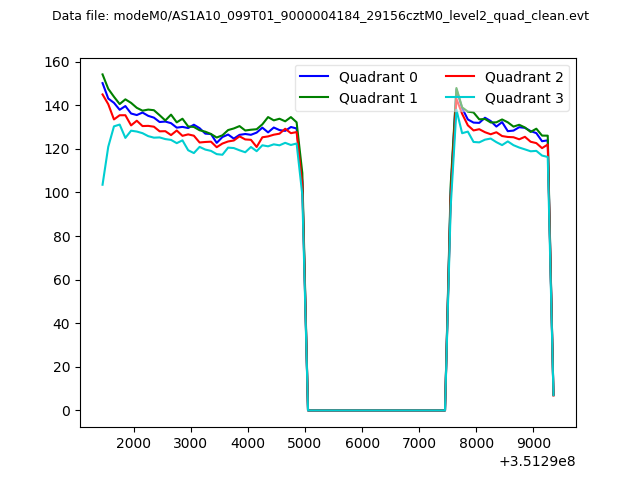 |
|
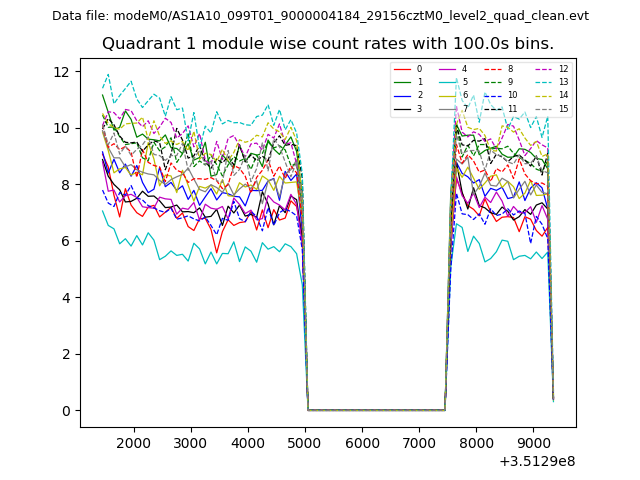
| Module-wise count rates for Quadrant A Data is divided into 100 sec bins |
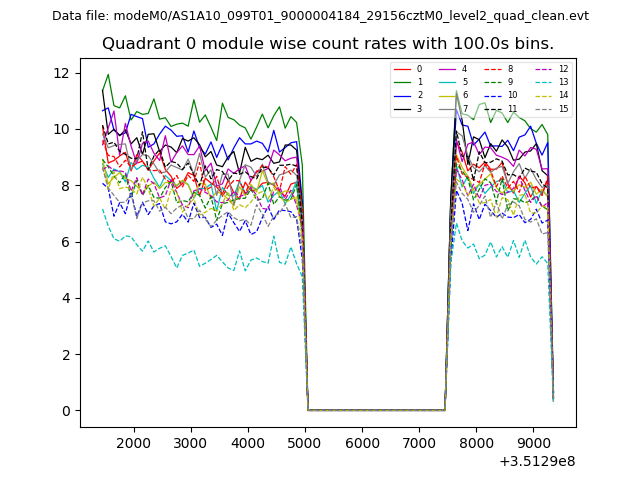 |
 |
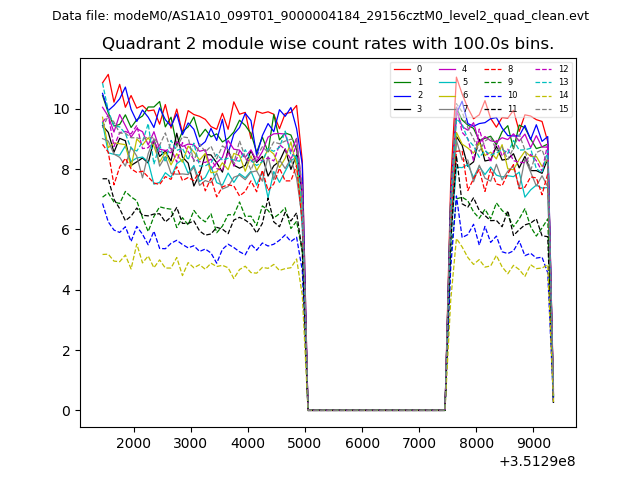
| Module-wise count rates for Quadrant B Data is divided into 100 sec bins |
 |
 |
| Module-wise count rates for Quadrant C Data is divided into 100 sec bins |
 |
 |
| Module-wise count rates for Quadrant D Data is divided into 100 sec bins |
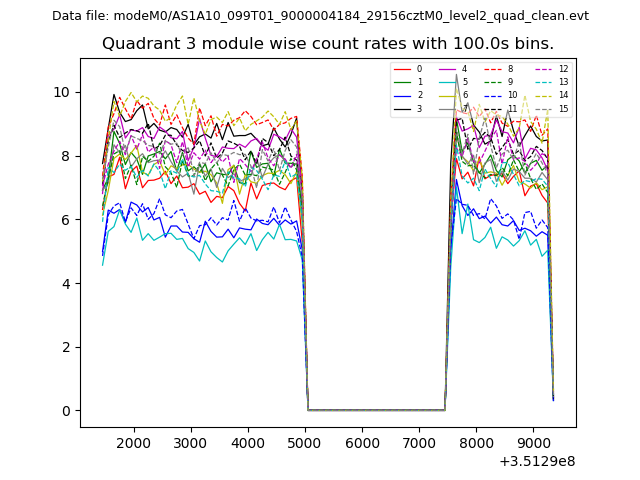 |
 |
| Parameter | Plot |
|---|---|
| CZT HV Monitor | 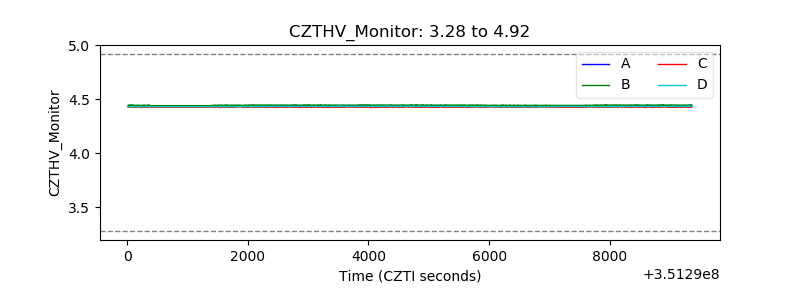 |
| D_VDD | 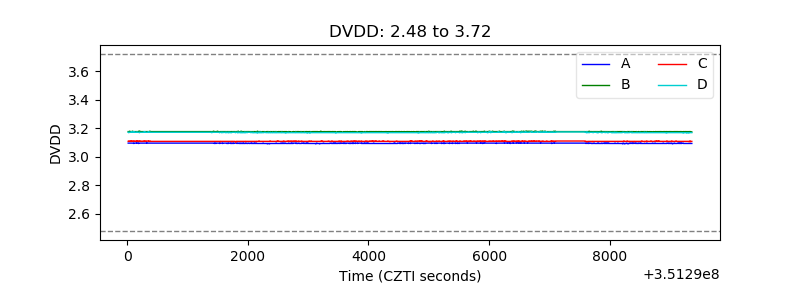 |
| Temperature 1 | 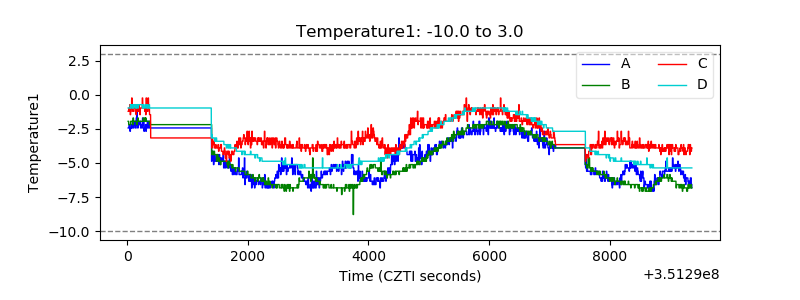 |
| Veto HV Monitor |  |
| Veto LLD | 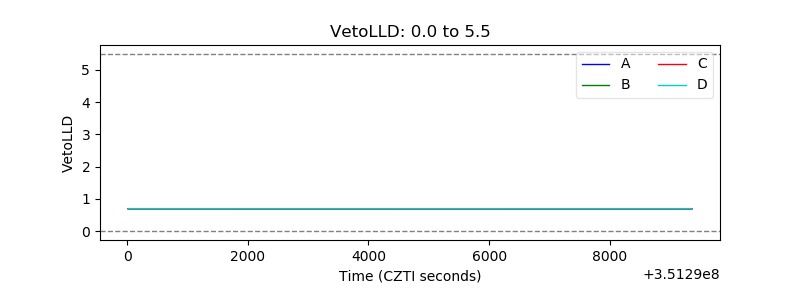 |
| Alpha Counter | 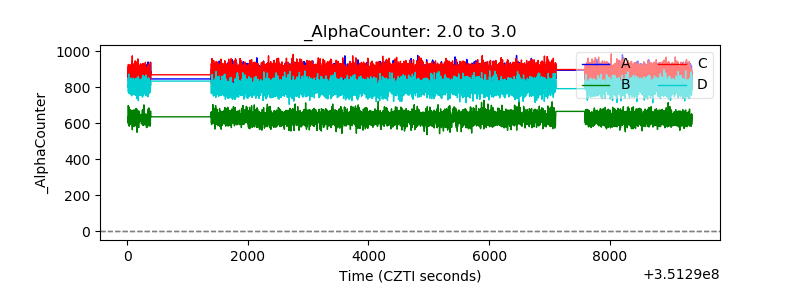 |
| _CPM_Rate | 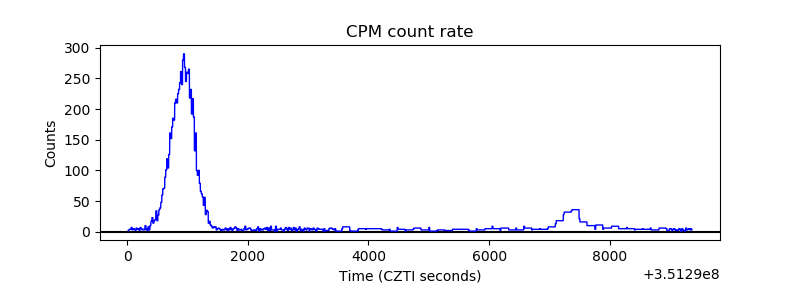 |
| CZT Counter |  |
| +2.5 Volts monitor |  |
| +5 Volts monitor | 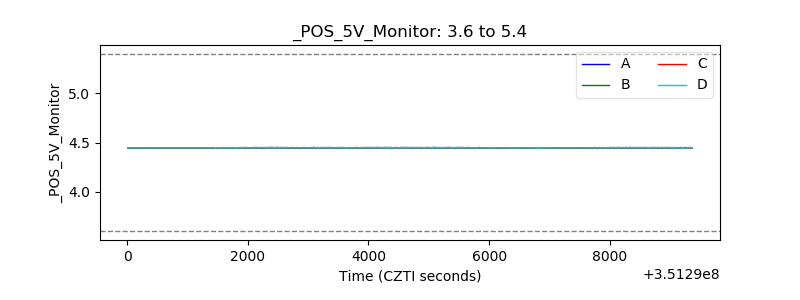 |
| _ROLL_ROT | 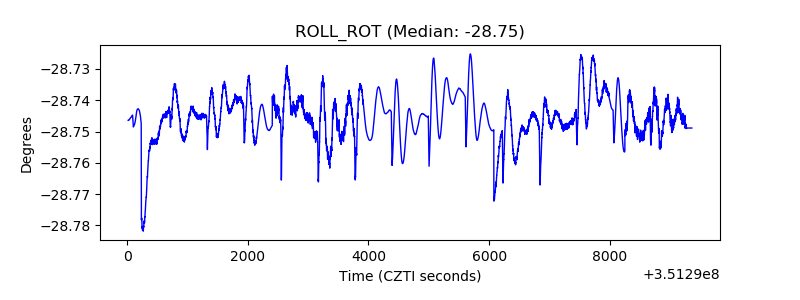 |
| _Roll_DEC |  |
| _Roll_RA |  |
| Veto Counter | 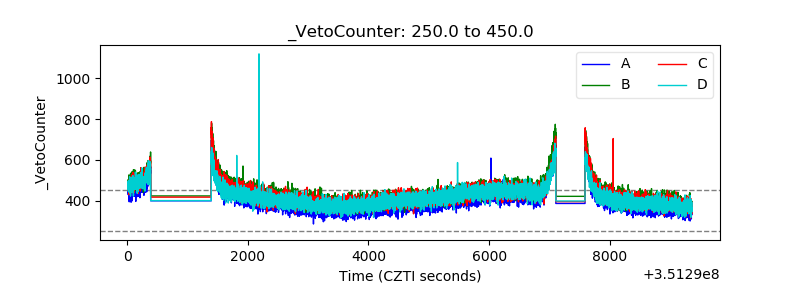 |