| Param | Original file | Final file |
|---|---|---|
| Filename | modeM0/AS1A10_099T01_9000004184_29157cztM0_level2.evt | modeM0/AS1A10_099T01_9000004184_29157cztM0_level2_quad_clean.evt |
| Size (bytes) | 612,984,960 | 112,294,080 |
| Size | 584.6 MB | 107.1 MB |
| Events in quadrant A | 4,057,577 | 719,552 |
| Events in quadrant B | 4,202,064 | 733,174 |
| Events in quadrant C | 4,128,691 | 701,093 |
| Events in quadrant D | 5,614,432 | 671,491 |
| Mode M9 | |||
|---|---|---|---|
| Quadrant | BADHDUFLAG | Total packets | Discarded packets |
| A | 0 | 7 | 0 |
| B | 0 | 7 | 0 |
| C | 0 | 7 | 0 |
| D | 0 | 7 | 0 |
| Mode SS | |||
|---|---|---|---|
| Quadrant | BADHDUFLAG | Total packets | Discarded packets |
| A | 0 | 170 | 0 |
| B | 0 | 170 | 0 |
| C | 0 | 170 | 0 |
| D | 0 | 170 | 0 |
| Mode M0 | |||
|---|---|---|---|
| Quadrant | BADHDUFLAG | Total packets | Discarded packets |
| A | 0 | 17463 | 2 |
| B | 0 | 17763 | 2 |
| C | 0 | 17523 | 2 |
| D | 0 | 22324 | 2 |
| Quadrant | Total seconds | Saturated seconds | Saturation percentage |
|---|---|---|---|
| A | 8288 | 87 | 1.049710% |
| B | 8288 | 197 | 2.376931% |
| C | 8288 | 170 | 2.051158% |
| D | 8289 | 240 | 2.895404% |
Noise dominated data is calculated using 1-second bins in cleaned event files. If a bin has >2000 counts, and if more than 50% of those come from <1% of pixels, then it is considered to be noise-dominated and hence unusable.
| Quadrant | # 1 sec bins | Bins with >0 counts | Bins with >2000 counts | High rate bins dominated by noise | Noise dominated (total time) | Noise dominated (detector-on time) | Marked lightcurve |
|---|---|---|---|---|---|---|---|
| A | 8908 | 8291 | 0 | 0 | 0.00% | 0.00% | 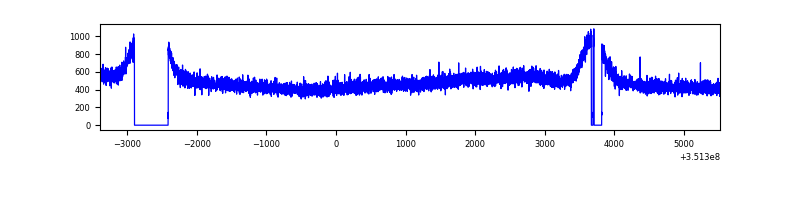 |
| B | 8908 | 8291 | 2 | 2 | 0.02% | 0.02% | 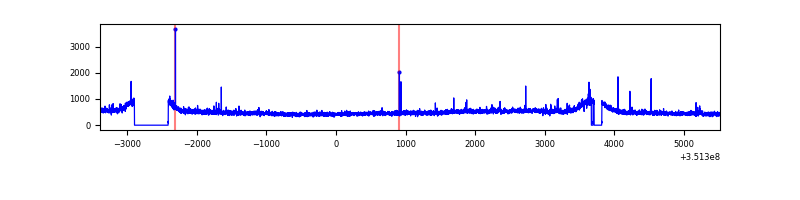 |
| C | 8908 | 8291 | 0 | 0 | 0.00% | 0.00% | 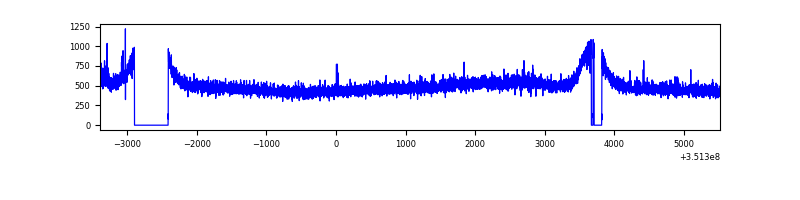 |
| D | 8909 | 8292 | 111 | 111 | 1.25% | 1.34% | 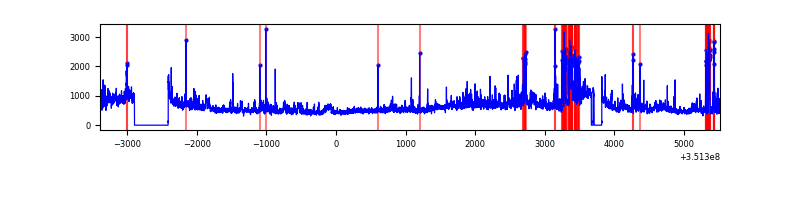 |
Top three noisy pixels from each quadrant. If the there are fewer than three noisy pixels in the level2.evt file, extra rows are filled as -1
| Pixel properties | Quadrant properties | ||||||
|---|---|---|---|---|---|---|---|
| Quadrant | DetID | PixID | Counts | Sigma | Mean | Median | Sigma |
| A | 13 | 254 | 14794 | 64.69 | 1050 | 1028 | 212.8 |
| A | 3 | 137 | 10806 | 45.95 | 1050 | 1028 | 212.8 |
| A | 0 | 226 | 8841 | 36.71 | 1050 | 1028 | 212.8 |
| B | 0 | 183 | 55499 | 269.47 | 1044 | 1018 | 202.2 |
| B | 12 | 111 | 25800 | 122.57 | 1044 | 1018 | 202.2 |
| B | 11 | 111 | 23483 | 111.11 | 1044 | 1018 | 202.2 |
| C | 14 | 238 | 168913 | 703.4 | 1006 | 1012 | 238.7 |
| C | 2 | 114 | 20140 | 80.13 | 1006 | 1012 | 238.7 |
| C | 14 | 254 | 14677 | 57.25 | 1006 | 1012 | 238.7 |
| D | 1 | 52 | 1078308 | 4498.16 | 1002 | 975 | 239.5 |
| D | 8 | 195 | 667211 | 2781.72 | 1002 | 975 | 239.5 |
| D | 2 | 234 | 36514 | 148.39 | 1002 | 975 | 239.5 |
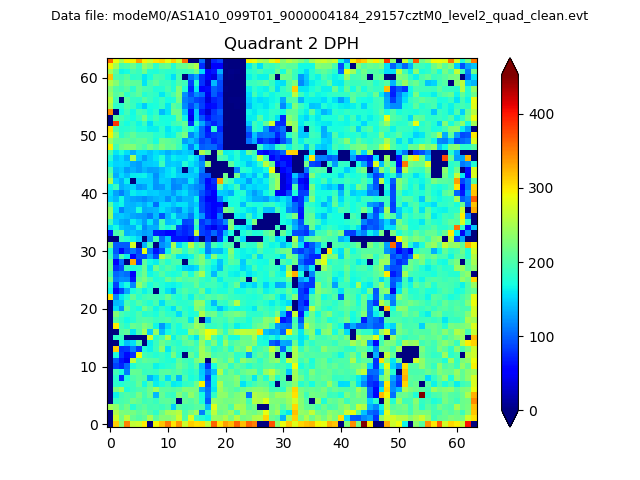
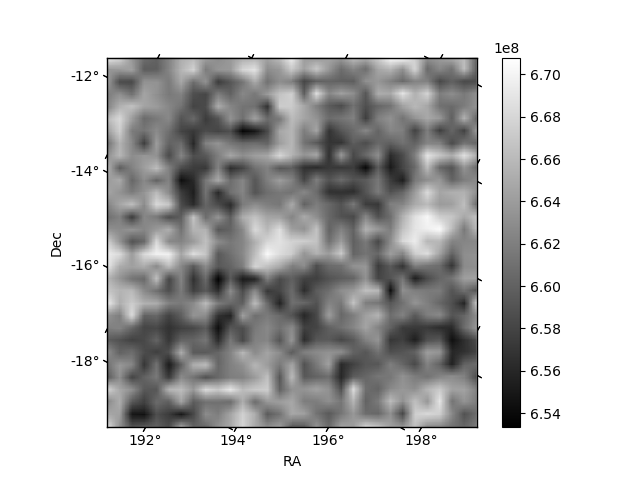
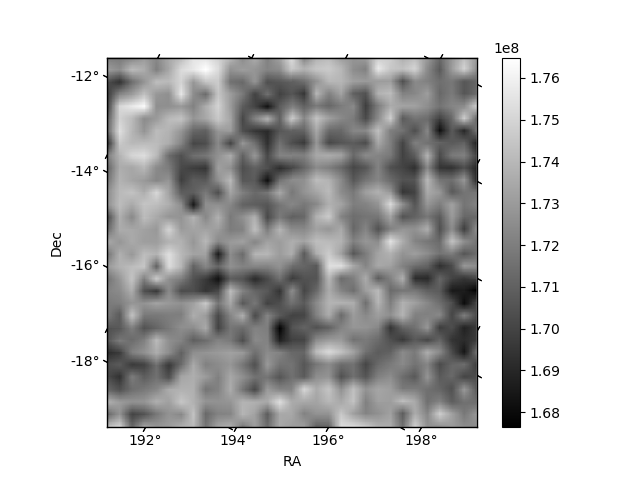
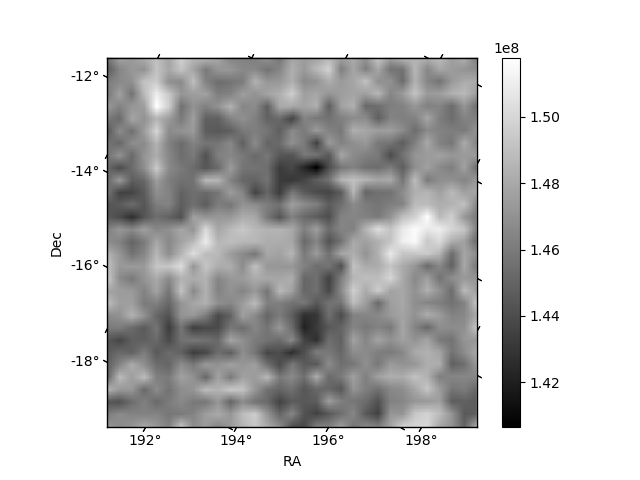
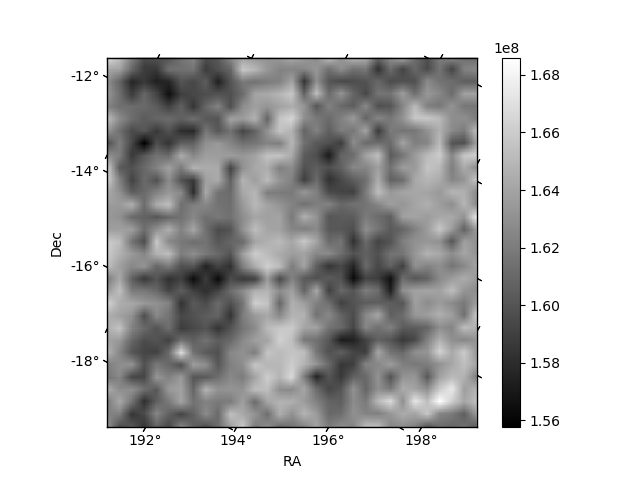
Histogram calculated using DETX and DETY for each event in the final _common_clean file
| Quadrant A | 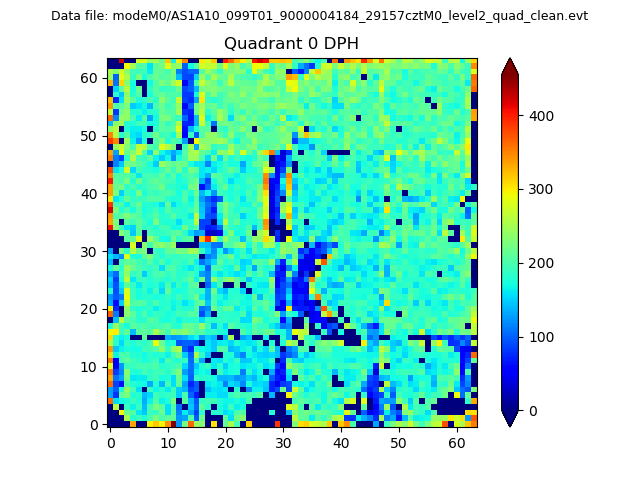 |
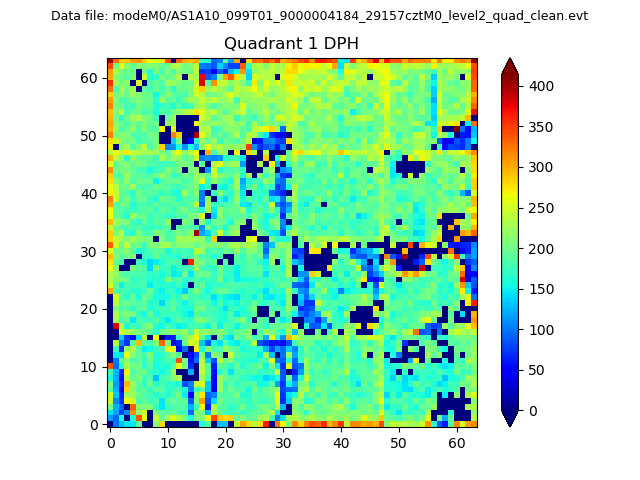 |
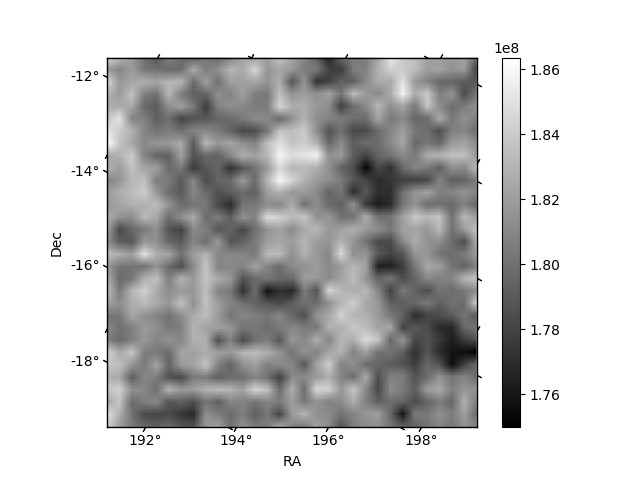
Quadrant B |
|---|---|---|---|
| Quadrant D | 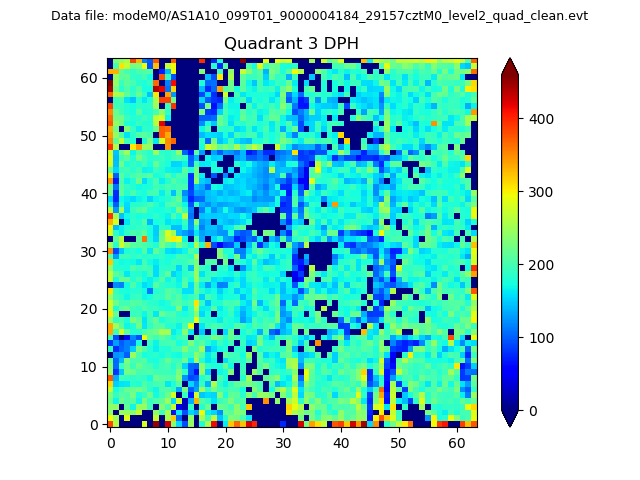 |
 |
Quadrant C |
| Plot type | Count rate plots | Images |
|---|---|---|
| Comparison with Poisson distribution Blue bars denote a histogram of data divided into 1 sec bins. Red curve is a Poisson curve with rate = median count rate of data. |
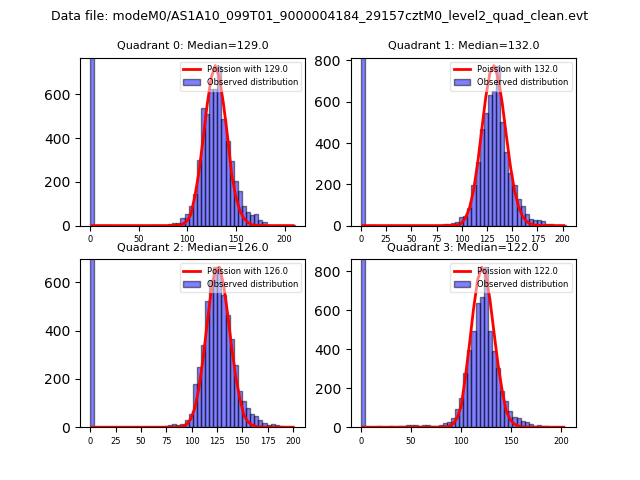 |
 |
| Quadrant-wise count rates Data is divided into 100 sec bins |
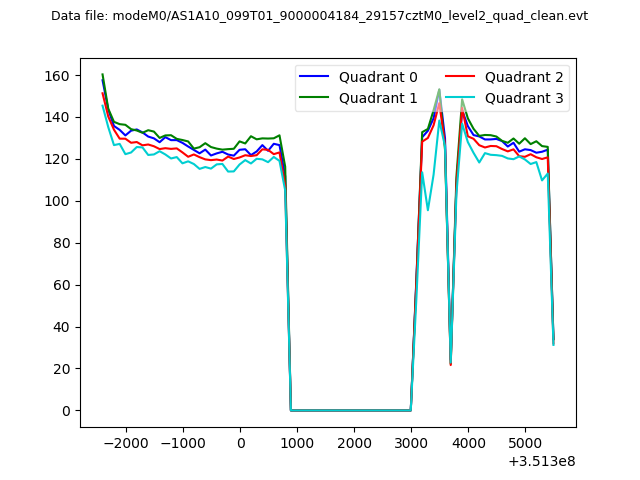 |
|
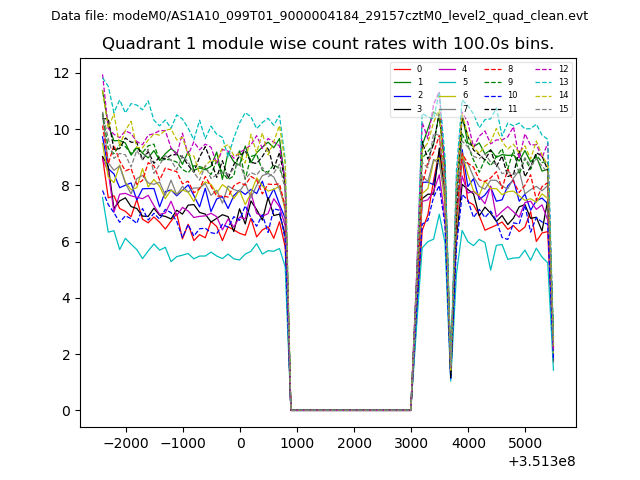
| Module-wise count rates for Quadrant A Data is divided into 100 sec bins |
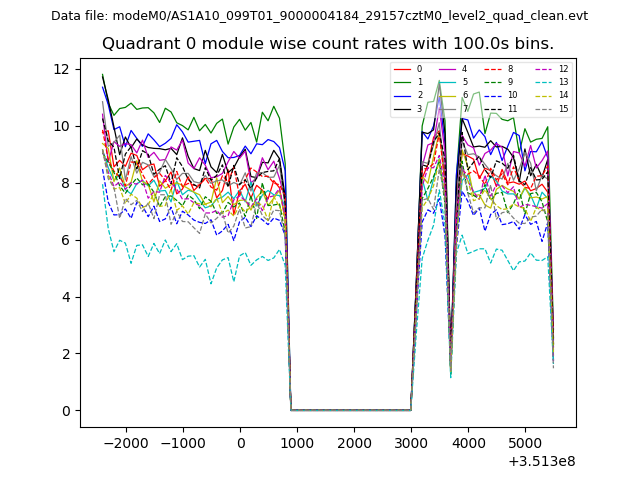 |
 |
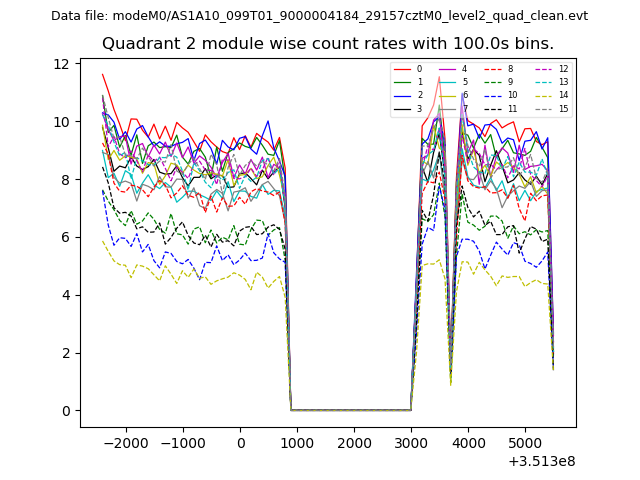
| Module-wise count rates for Quadrant B Data is divided into 100 sec bins |
 |
 |
| Module-wise count rates for Quadrant C Data is divided into 100 sec bins |
 |
 |
| Module-wise count rates for Quadrant D Data is divided into 100 sec bins |
 |
 |
| Parameter | Plot |
|---|---|
| CZT HV Monitor | 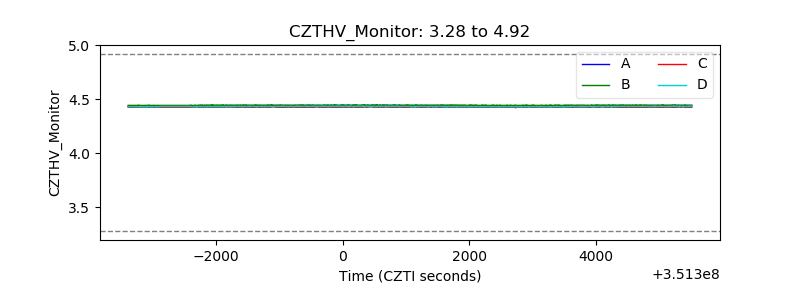 |
| D_VDD | 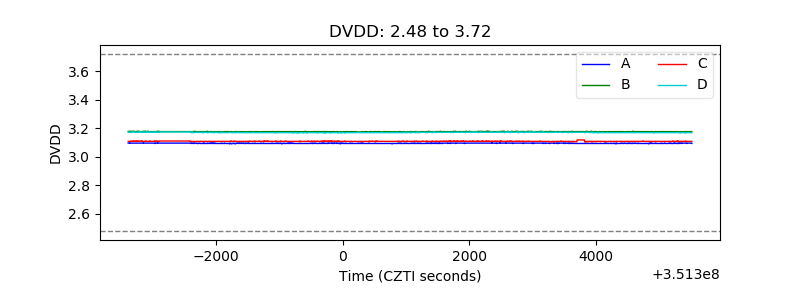 |
| Temperature 1 | 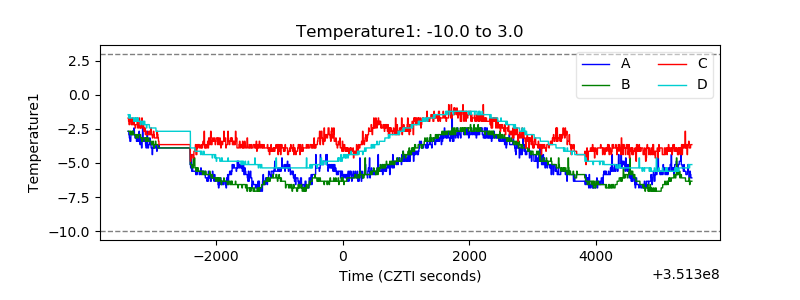 |
| Veto HV Monitor | 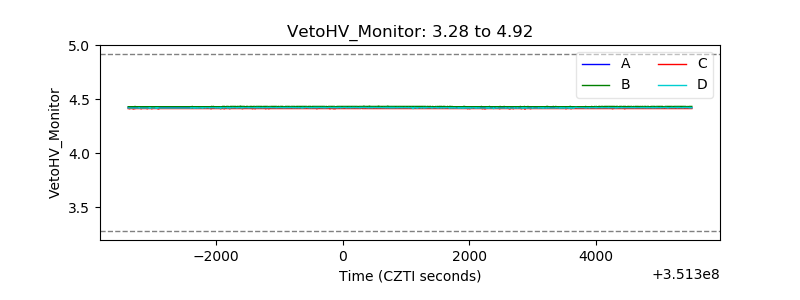 |
| Veto LLD | 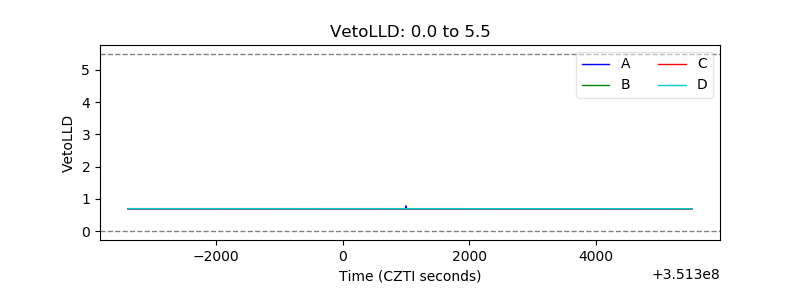 |
| Alpha Counter | 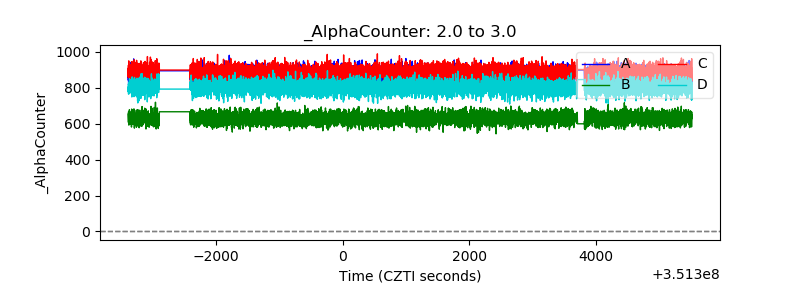 |
| _CPM_Rate | 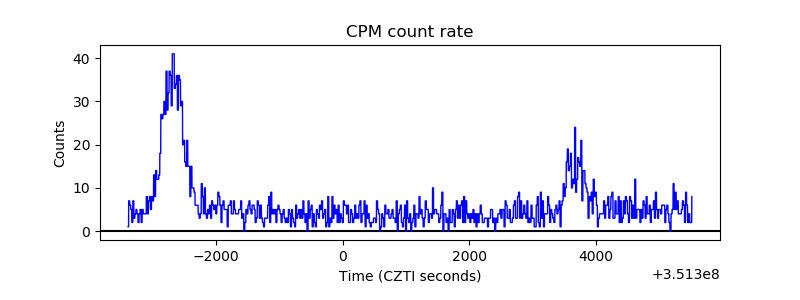 |
| CZT Counter | 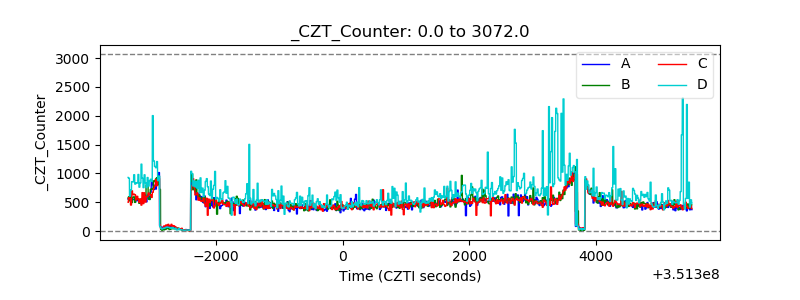 |
| +2.5 Volts monitor |  |
| +5 Volts monitor | 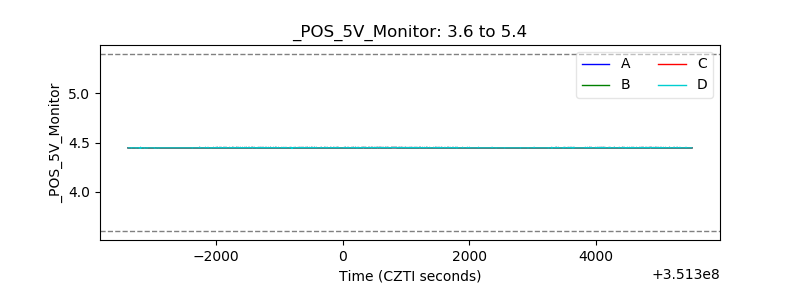 |
| _ROLL_ROT |  |
| _Roll_DEC | 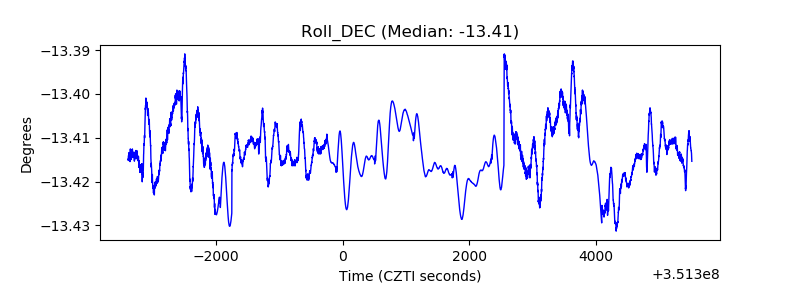 |
| _Roll_RA | 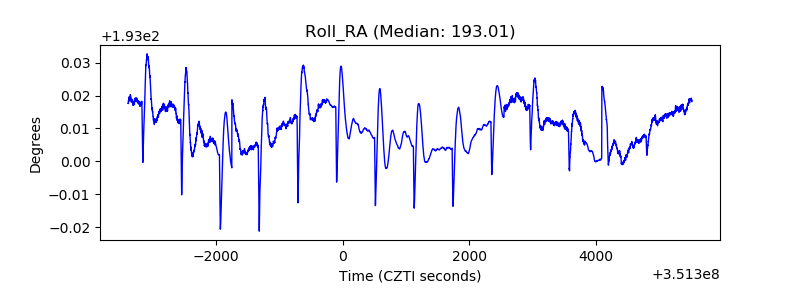 |
| Veto Counter |  |