| Param | Original file | Final file |
|---|---|---|
| Filename | modeM0/AS1A10_099T01_9000004184_29158cztM0_level2.evt | modeM0/AS1A10_099T01_9000004184_29158cztM0_level2_quad_clean.evt |
| Size (bytes) | 630,072,000 | 122,120,640 |
| Size | 600.9 MB | 116.5 MB |
| Events in quadrant A | 4,157,107 | 787,452 |
| Events in quadrant B | 4,330,638 | 802,781 |
| Events in quadrant C | 4,261,007 | 771,396 |
| Events in quadrant D | 5,750,239 | 740,036 |
| Mode M9 | |||
|---|---|---|---|
| Quadrant | BADHDUFLAG | Total packets | Discarded packets |
| A | 0 | 5 | 0 |
| B | 0 | 5 | 0 |
| C | 0 | 5 | 0 |
| D | 0 | 5 | 0 |
| Mode SS | |||
|---|---|---|---|
| Quadrant | BADHDUFLAG | Total packets | Discarded packets |
| A | 0 | 178 | 0 |
| B | 0 | 178 | 0 |
| C | 0 | 178 | 0 |
| D | 0 | 178 | 0 |
| Mode M0 | |||
|---|---|---|---|
| Quadrant | BADHDUFLAG | Total packets | Discarded packets |
| A | 0 | 17968 | 2 |
| B | 0 | 18335 | 2 |
| C | 0 | 18092 | 2 |
| D | 0 | 22981 | 2 |
| Quadrant | Total seconds | Saturated seconds | Saturation percentage |
|---|---|---|---|
| A | 8601 | 108 | 1.255668% |
| B | 8602 | 182 | 2.115787% |
| C | 8602 | 199 | 2.313415% |
| D | 8602 | 326 | 3.789816% |
Noise dominated data is calculated using 1-second bins in cleaned event files. If a bin has >2000 counts, and if more than 50% of those come from <1% of pixels, then it is considered to be noise-dominated and hence unusable.
| Quadrant | # 1 sec bins | Bins with >0 counts | Bins with >2000 counts | High rate bins dominated by noise | Noise dominated (total time) | Noise dominated (detector-on time) | Marked lightcurve |
|---|---|---|---|---|---|---|---|
| A | 8971 | 8605 | 0 | 0 | 0.00% | 0.00% | 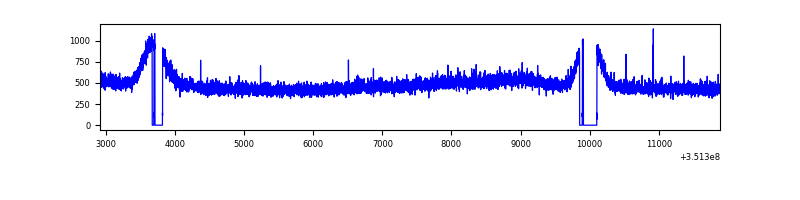 |
| B | 8972 | 8606 | 2 | 2 | 0.02% | 0.02% | 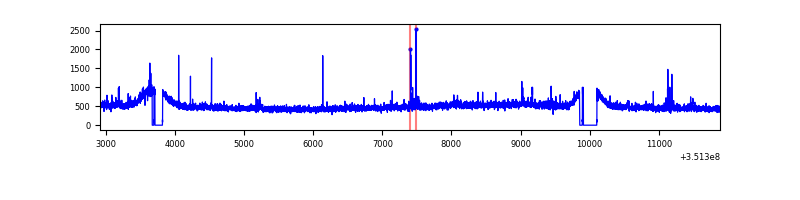 |
| C | 8972 | 8606 | 0 | 0 | 0.00% | 0.00% | 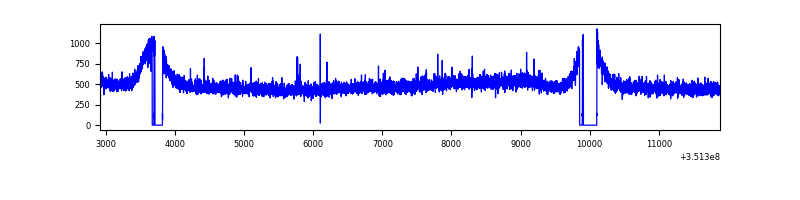 |
| D | 8972 | 8606 | 178 | 178 | 1.98% | 2.07% | 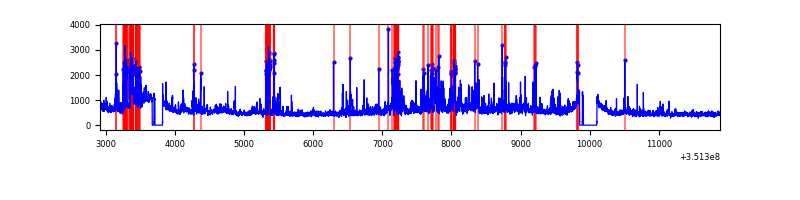 |
Top three noisy pixels from each quadrant. If the there are fewer than three noisy pixels in the level2.evt file, extra rows are filled as -1
| Pixel properties | Quadrant properties | ||||||
|---|---|---|---|---|---|---|---|
| Quadrant | DetID | PixID | Counts | Sigma | Mean | Median | Sigma |
| A | 13 | 254 | 15244 | 64.89 | 1076 | 1051 | 218.7 |
| A | 3 | 137 | 11242 | 46.59 | 1076 | 1051 | 218.7 |
| A | 0 | 226 | 9141 | 36.98 | 1076 | 1051 | 218.7 |
| B | 0 | 183 | 56308 | 263.97 | 1070 | 1042 | 209.4 |
| B | 0 | 189 | 33643 | 155.71 | 1070 | 1042 | 209.4 |
| B | 12 | 111 | 26289 | 120.59 | 1070 | 1042 | 209.4 |
| C | 14 | 238 | 170799 | 688.68 | 1037 | 1045 | 246.5 |
| C | 3 | 233 | 23381 | 90.62 | 1037 | 1045 | 246.5 |
| C | 2 | 114 | 20300 | 78.12 | 1037 | 1045 | 246.5 |
| D | 1 | 52 | 1375957 | 5560.2 | 1031 | 1004 | 247.3 |
| D | 8 | 195 | 389564 | 1571.31 | 1031 | 1004 | 247.3 |
| D | 2 | 250 | 44213 | 174.73 | 1031 | 1004 | 247.3 |
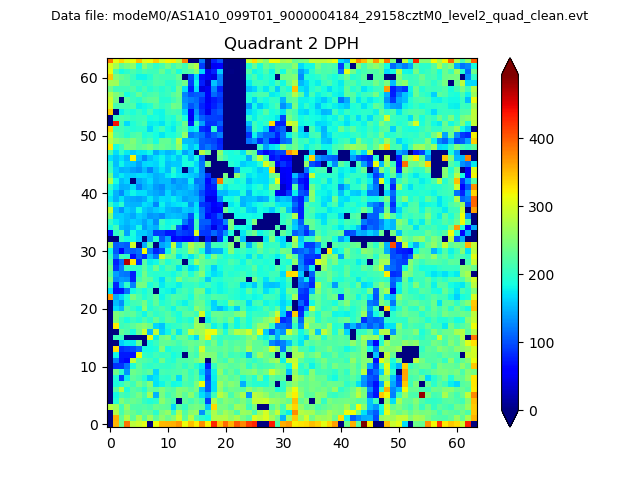
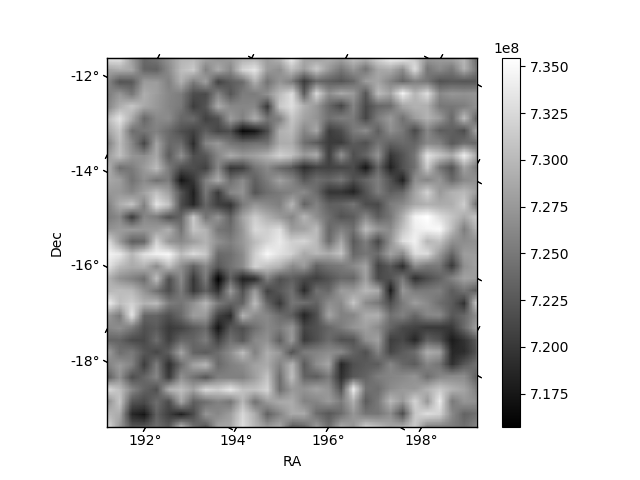
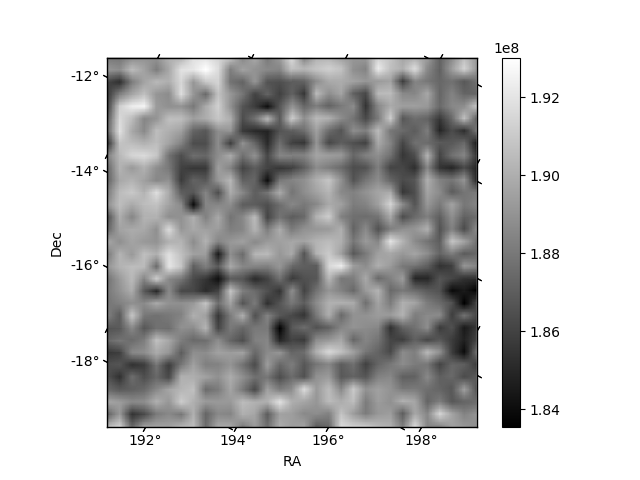
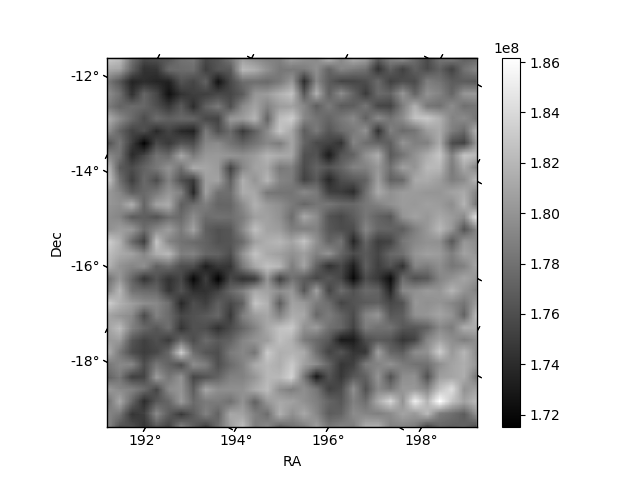
Histogram calculated using DETX and DETY for each event in the final _common_clean file
| Quadrant A | 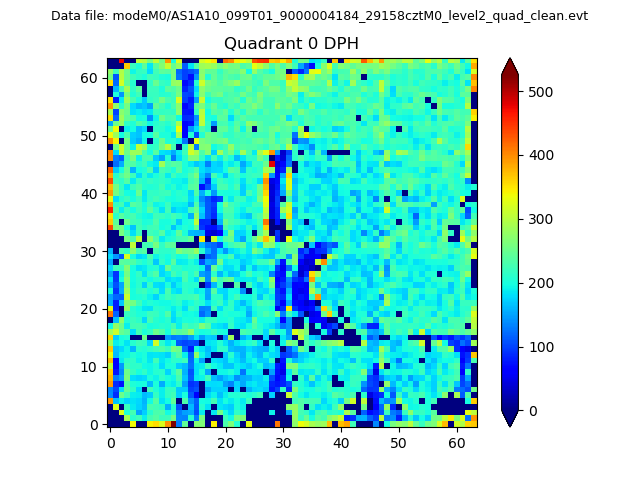 |
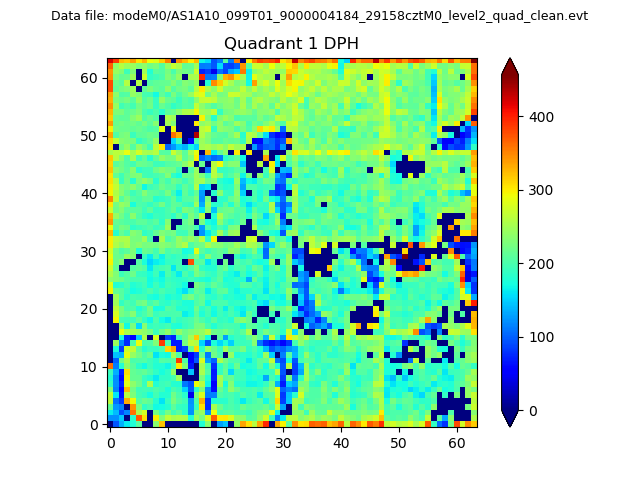 |
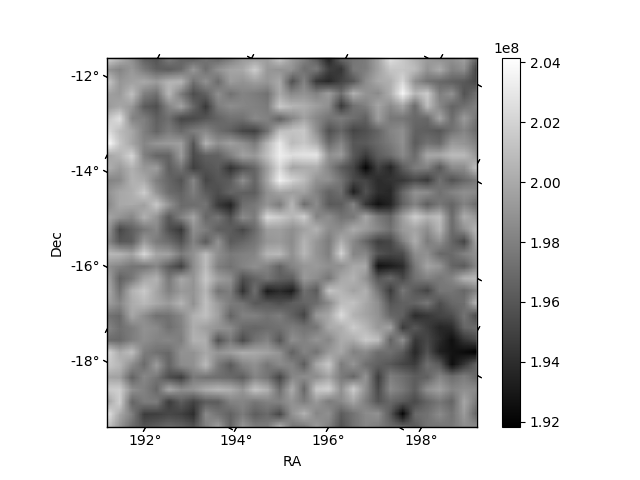
Quadrant B |
|---|---|---|---|
| Quadrant D | 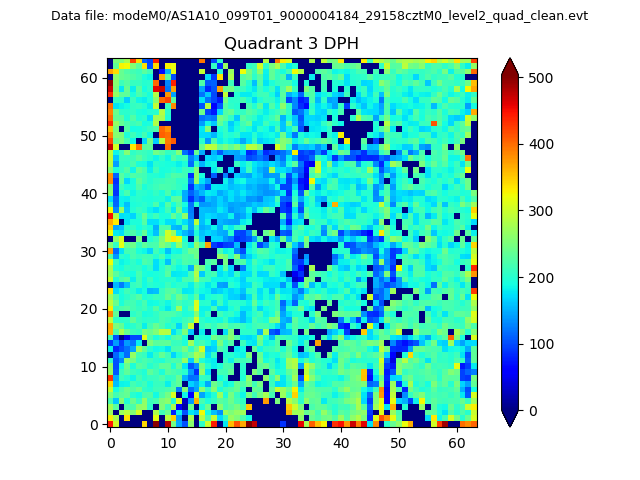 |
 |
Quadrant C |
| Plot type | Count rate plots | Images |
|---|---|---|
| Comparison with Poisson distribution Blue bars denote a histogram of data divided into 1 sec bins. Red curve is a Poisson curve with rate = median count rate of data. |
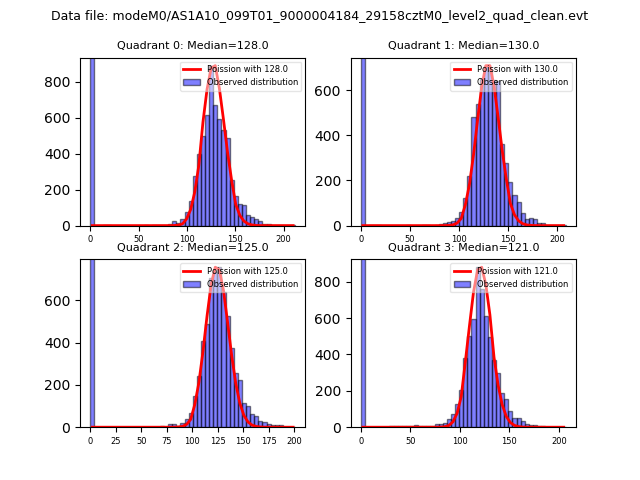 |
 |
| Quadrant-wise count rates Data is divided into 100 sec bins |
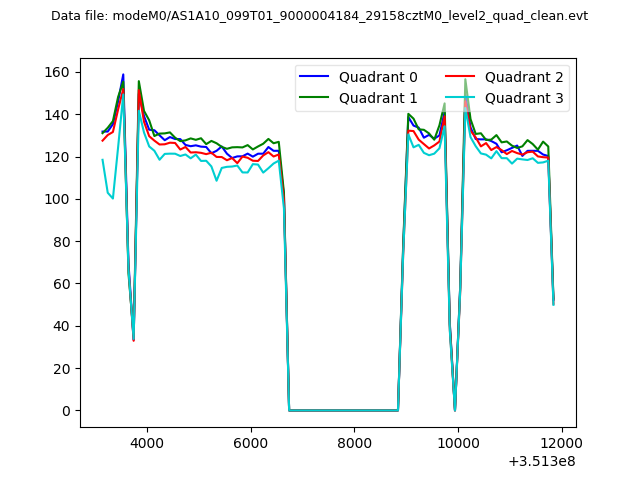 |
|
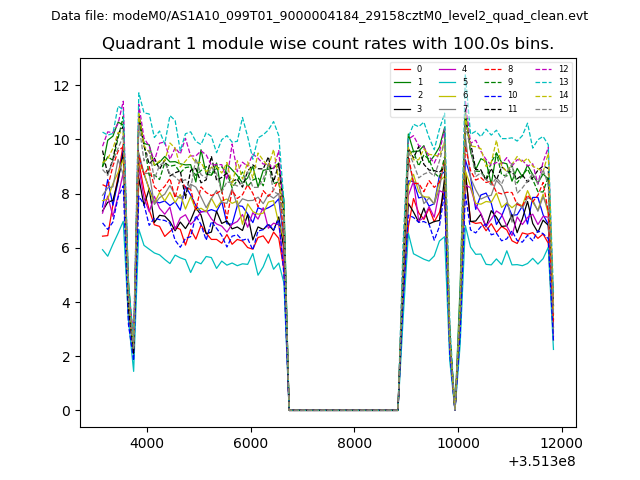
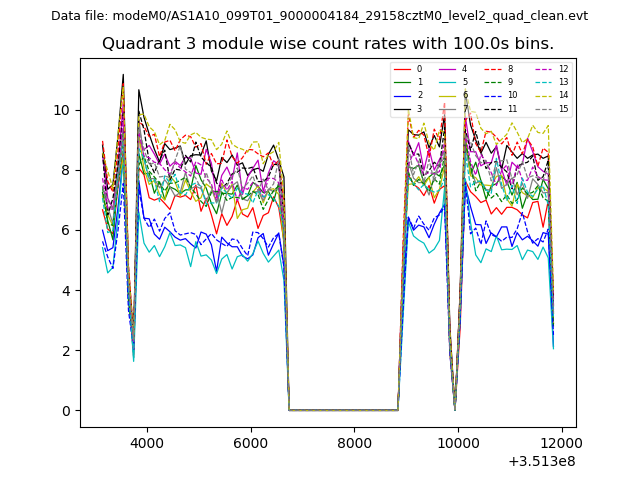
| Module-wise count rates for Quadrant A Data is divided into 100 sec bins |
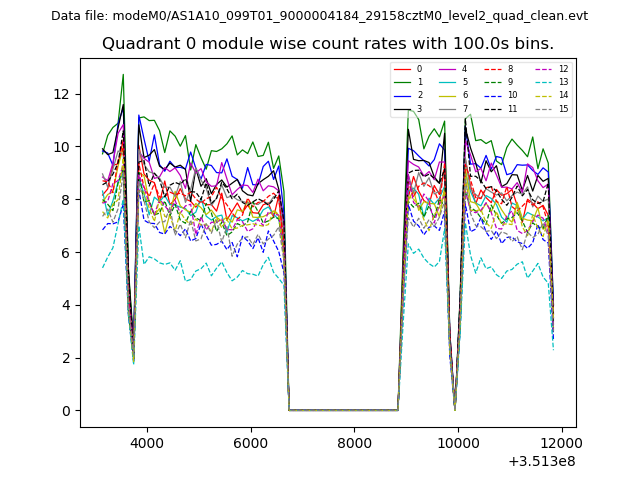 |
 |
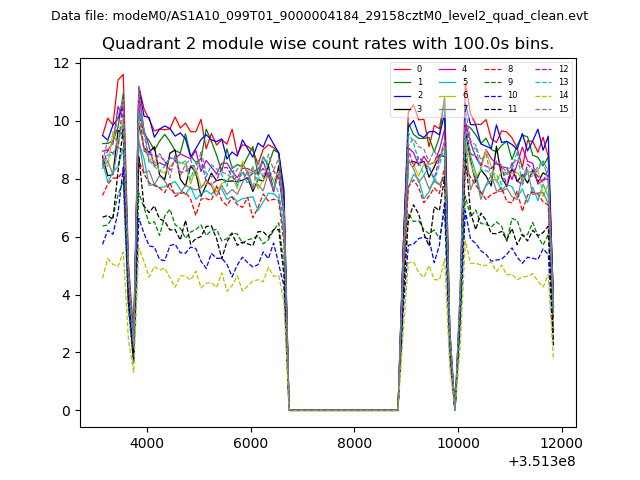
| Module-wise count rates for Quadrant B Data is divided into 100 sec bins |
 |
 |
| Module-wise count rates for Quadrant C Data is divided into 100 sec bins |
 |
 |
| Module-wise count rates for Quadrant D Data is divided into 100 sec bins |
 |
 |
| Parameter | Plot |
|---|---|
| CZT HV Monitor | 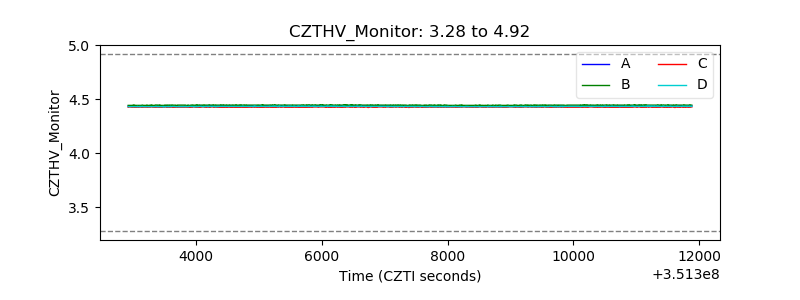 |
| D_VDD | 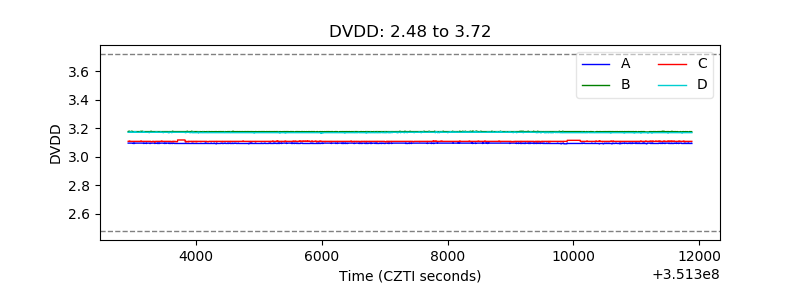 |
| Temperature 1 | 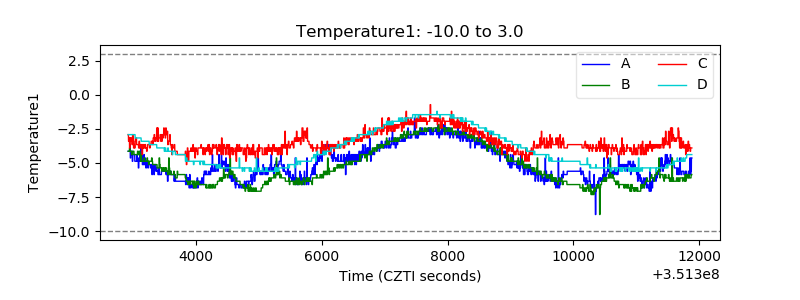 |
| Veto HV Monitor | 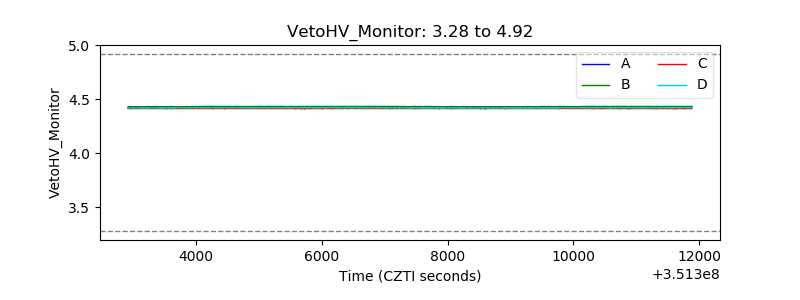 |
| Veto LLD | 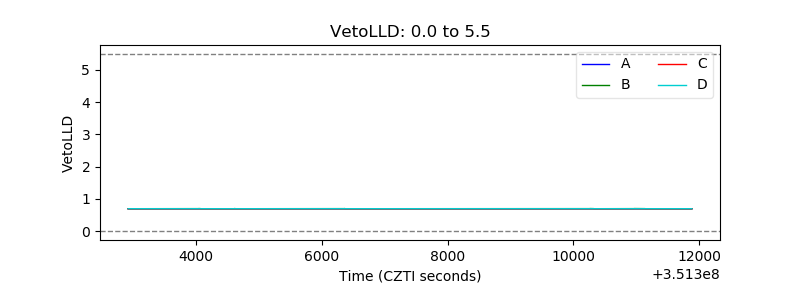 |
| Alpha Counter | 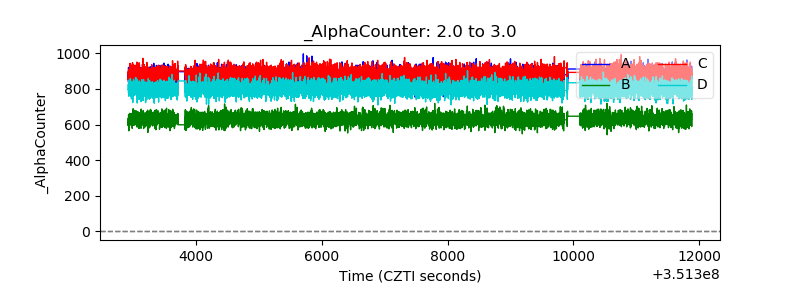 |
| _CPM_Rate | 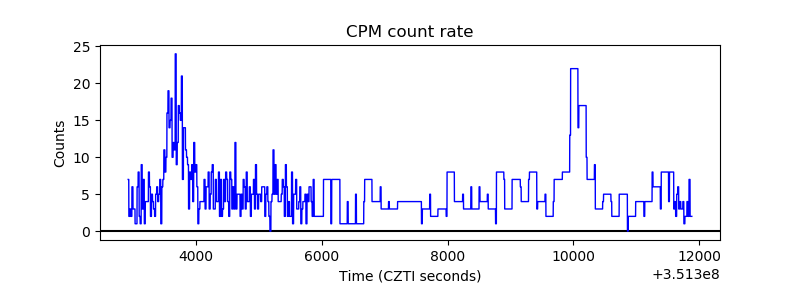 |
| CZT Counter | 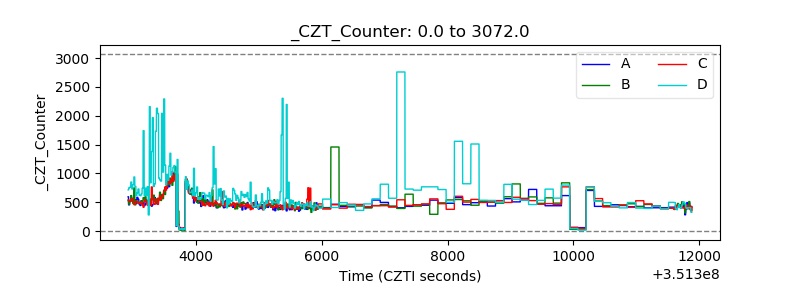 |
| +2.5 Volts monitor |  |
| +5 Volts monitor |  |
| _ROLL_ROT | 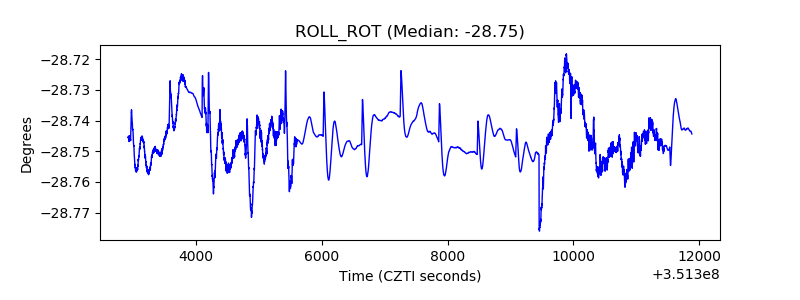 |
| _Roll_DEC | 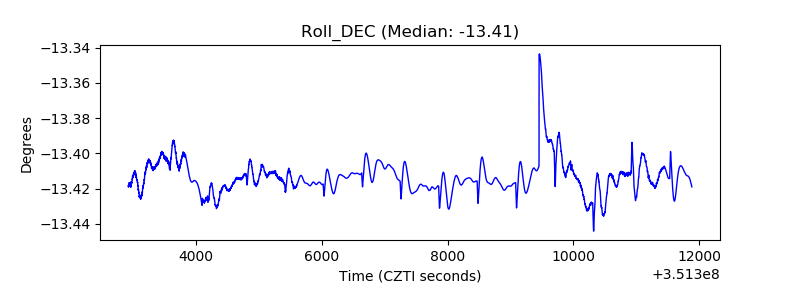 |
| _Roll_RA | 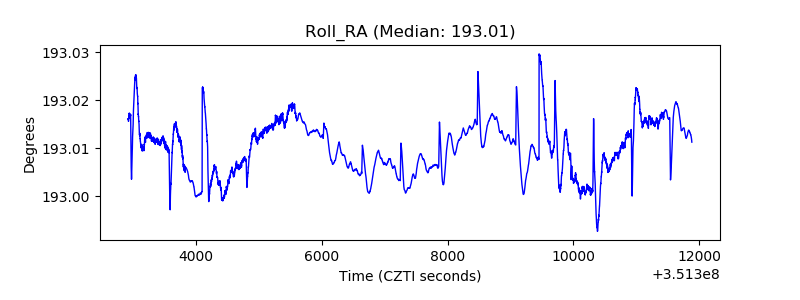 |
| Veto Counter | 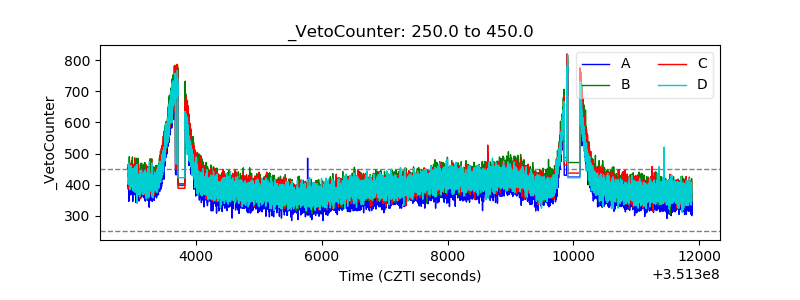 |