| Param | Original file | Final file |
|---|---|---|
| Filename | modeM0/AS1A10_099T01_9000004184_29162cztM0_level2.evt | modeM0/AS1A10_099T01_9000004184_29162cztM0_level2_quad_clean.evt |
| Size (bytes) | 518,218,560 | 76,210,560 |
| Size | 494.2 MB | 72.7 MB |
| Events in quadrant A | 3,182,651 | 473,646 |
| Events in quadrant B | 3,270,010 | 482,796 |
| Events in quadrant C | 3,243,000 | 462,084 |
| Events in quadrant D | 5,557,015 | 434,816 |
| Mode M9 | |||
|---|---|---|---|
| Quadrant | BADHDUFLAG | Total packets | Discarded packets |
| A | 0 | 10 | 0 |
| B | 0 | 10 | 0 |
| C | 0 | 10 | 0 |
| D | 0 | 10 | 0 |
| Mode SS | |||
|---|---|---|---|
| Quadrant | BADHDUFLAG | Total packets | Discarded packets |
| A | 0 | 130 | 0 |
| B | 0 | 130 | 0 |
| C | 0 | 130 | 0 |
| D | 0 | 130 | 0 |
| Mode M0 | |||
|---|---|---|---|
| Quadrant | BADHDUFLAG | Total packets | Discarded packets |
| A | 0 | 13452 | 1 |
| B | 0 | 13584 | 1 |
| C | 0 | 13509 | 1 |
| D | 0 | 20932 | 1 |
| Quadrant | Total seconds | Saturated seconds | Saturation percentage |
|---|---|---|---|
| A | 6518 | 51 | 0.782449% |
| B | 6519 | 61 | 0.935726% |
| C | 6519 | 80 | 1.227182% |
| D | 6519 | 464 | 7.117656% |
Noise dominated data is calculated using 1-second bins in cleaned event files. If a bin has >2000 counts, and if more than 50% of those come from <1% of pixels, then it is considered to be noise-dominated and hence unusable.
| Quadrant | # 1 sec bins | Bins with >0 counts | Bins with >2000 counts | High rate bins dominated by noise | Noise dominated (total time) | Noise dominated (detector-on time) | Marked lightcurve |
|---|---|---|---|---|---|---|---|
| A | 7479 | 6519 | 0 | 0 | 0.00% | 0.00% | 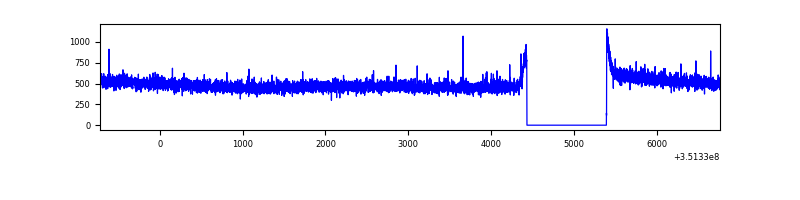 |
| B | 7480 | 6520 | 0 | 0 | 0.00% | 0.00% | 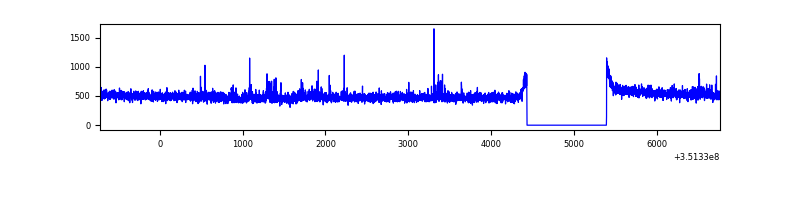 |
| C | 7480 | 6520 | 0 | 0 | 0.00% | 0.00% | 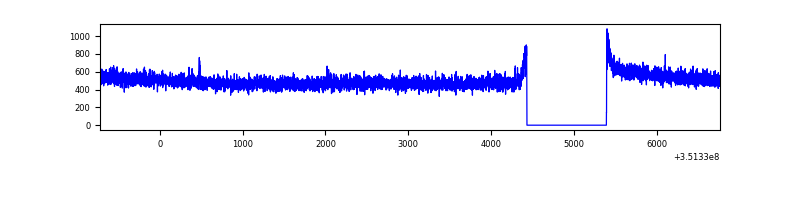 |
| D | 7480 | 6520 | 407 | 407 | 5.44% | 6.24% | 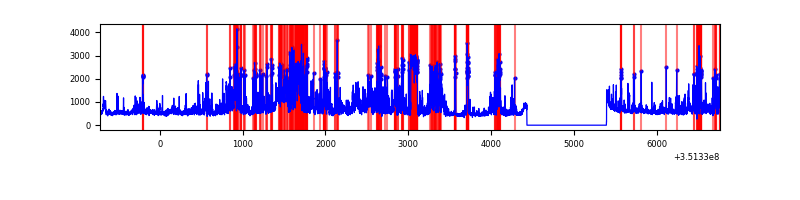 |
Top three noisy pixels from each quadrant. If the there are fewer than three noisy pixels in the level2.evt file, extra rows are filled as -1
| Pixel properties | Quadrant properties | ||||||
|---|---|---|---|---|---|---|---|
| Quadrant | DetID | PixID | Counts | Sigma | Mean | Median | Sigma |
| A | 13 | 254 | 12015 | 67.41 | 823 | 806 | 166.3 |
| A | 3 | 137 | 8109 | 43.92 | 823 | 806 | 166.3 |
| A | 0 | 226 | 7020 | 37.37 | 823 | 806 | 166.3 |
| B | 0 | 183 | 57697 | 364.85 | 811 | 790 | 156.0 |
| B | 12 | 111 | 19325 | 118.83 | 811 | 790 | 156.0 |
| B | 11 | 111 | 17807 | 109.1 | 811 | 790 | 156.0 |
| C | 14 | 238 | 127122 | 679.94 | 792 | 797 | 185.8 |
| C | 3 | 233 | 18192 | 93.63 | 792 | 797 | 185.8 |
| C | 2 | 114 | 14953 | 76.19 | 792 | 797 | 185.8 |
| D | 1 | 52 | 1879510 | 10174.74 | 781 | 761 | 184.6 |
| D | 13 | 104 | 352391 | 1904.32 | 781 | 761 | 184.6 |
| D | 8 | 195 | 344486 | 1861.51 | 781 | 761 | 184.6 |
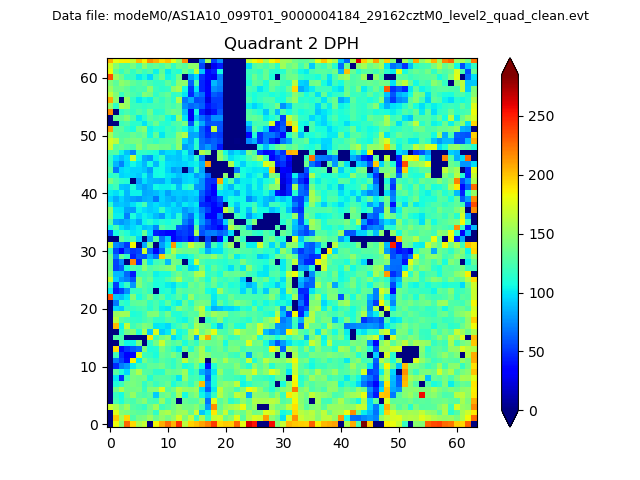
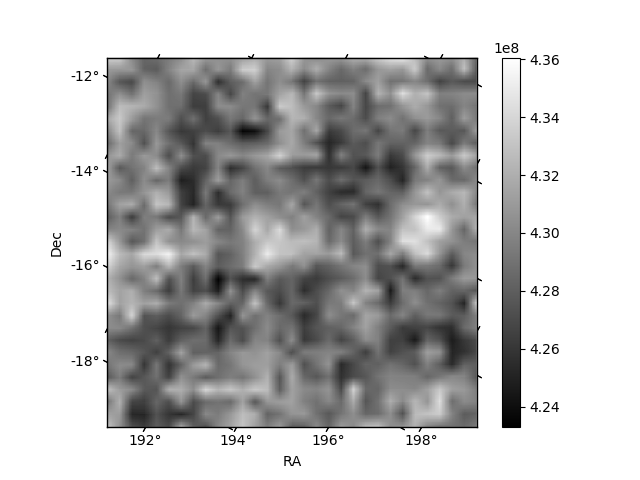
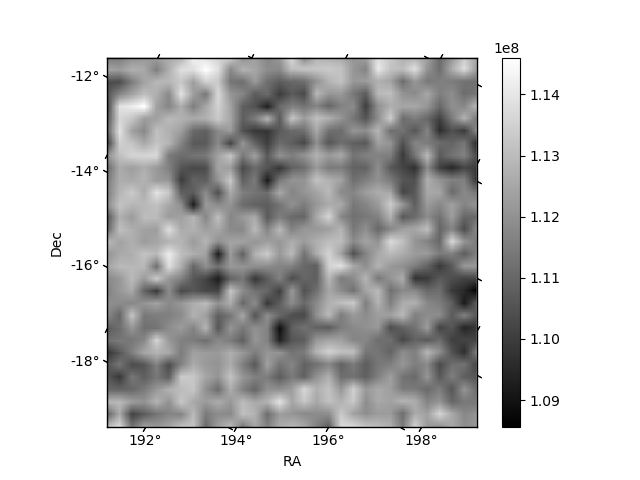
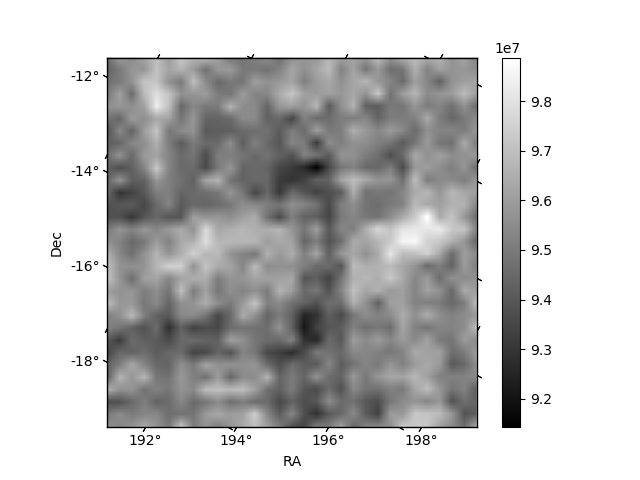
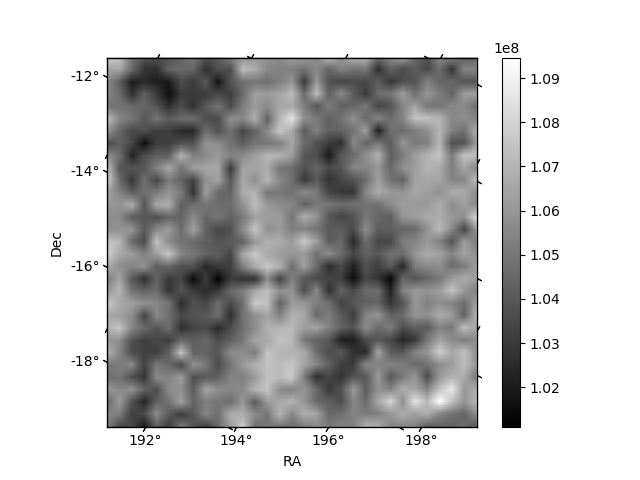
Histogram calculated using DETX and DETY for each event in the final _common_clean file
| Quadrant A | 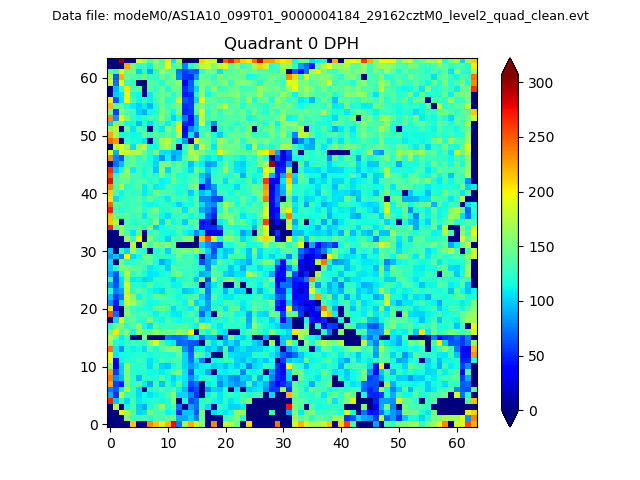 |
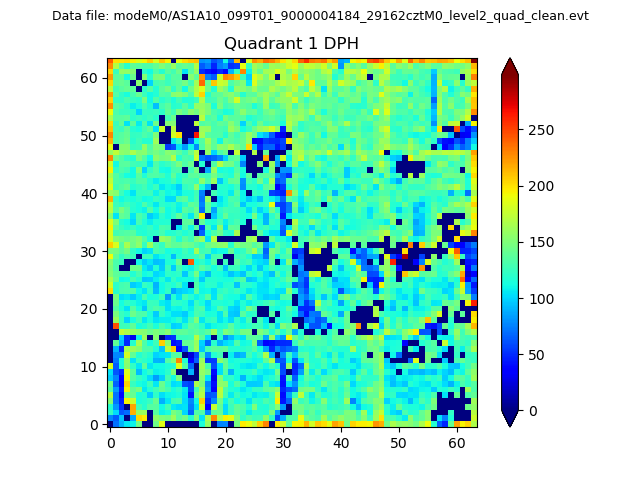 |
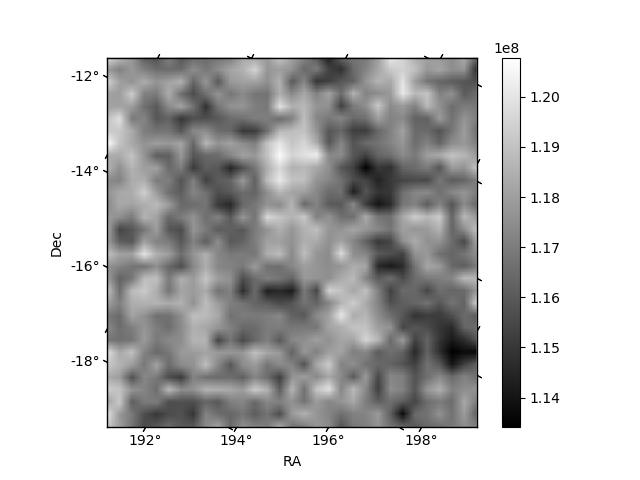
Quadrant B |
|---|---|---|---|
| Quadrant D | 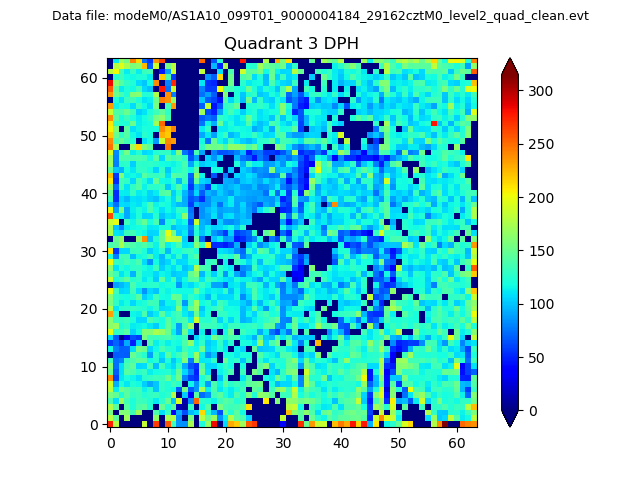 |
 |
Quadrant C |
| Plot type | Count rate plots | Images |
|---|---|---|
| Comparison with Poisson distribution Blue bars denote a histogram of data divided into 1 sec bins. Red curve is a Poisson curve with rate = median count rate of data. |
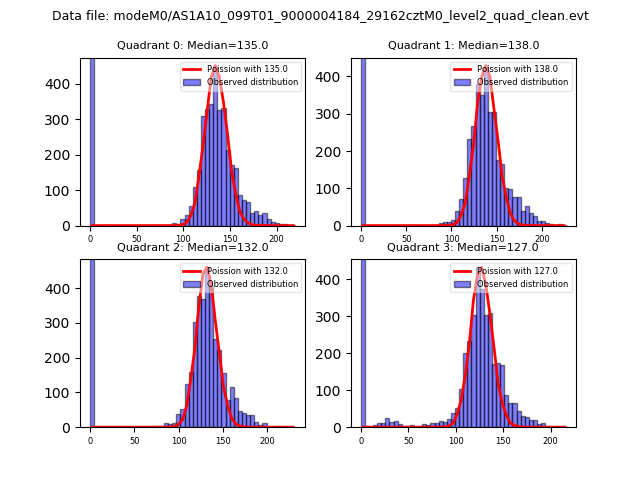 |
 |
| Quadrant-wise count rates Data is divided into 100 sec bins |
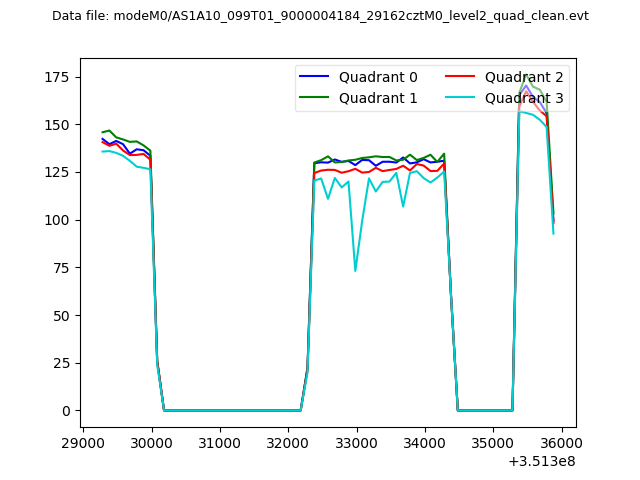 |
|
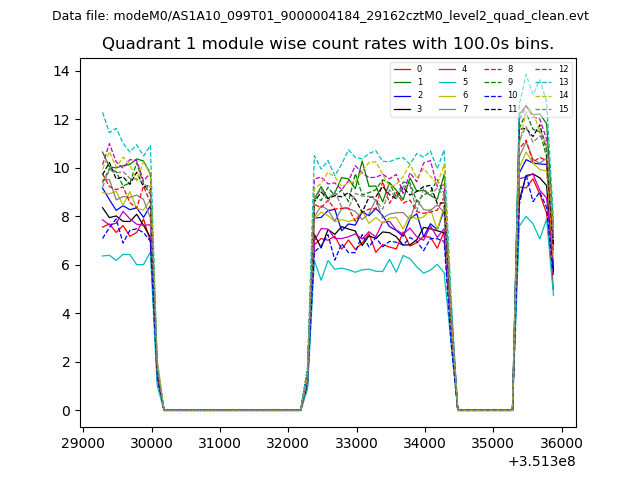
| Module-wise count rates for Quadrant A Data is divided into 100 sec bins |
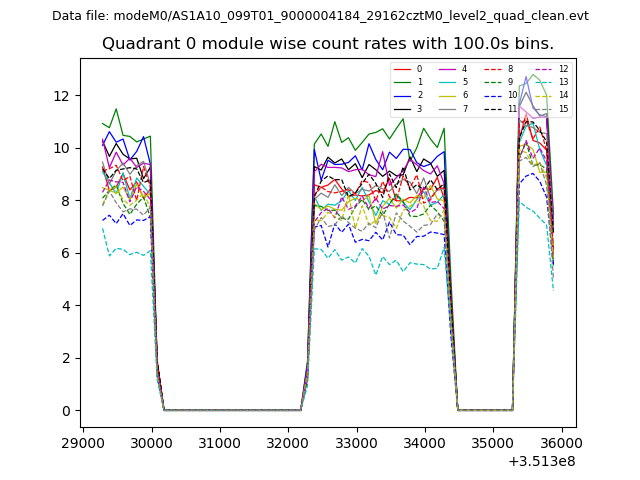 |
 |
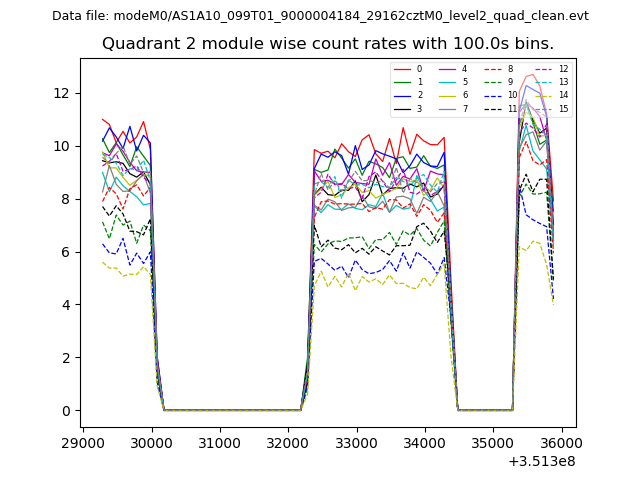
| Module-wise count rates for Quadrant B Data is divided into 100 sec bins |
 |
 |
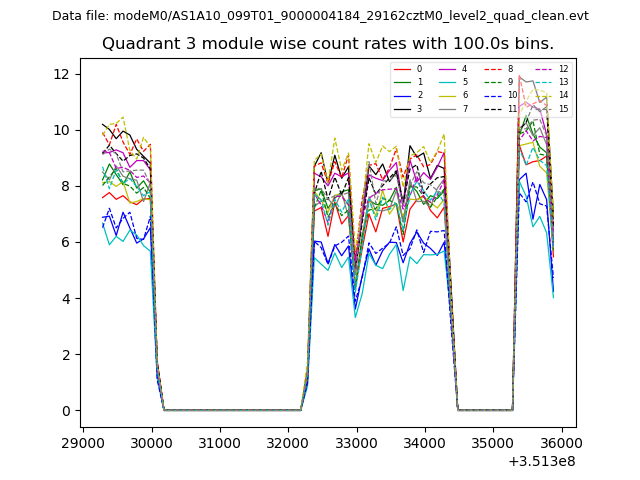
| Module-wise count rates for Quadrant C Data is divided into 100 sec bins |
 |
 |
| Module-wise count rates for Quadrant D Data is divided into 100 sec bins |
 |
 |
| Parameter | Plot |
|---|---|
| CZT HV Monitor | 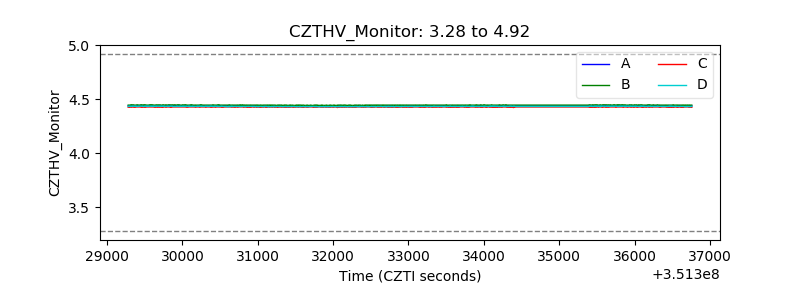 |
| D_VDD | 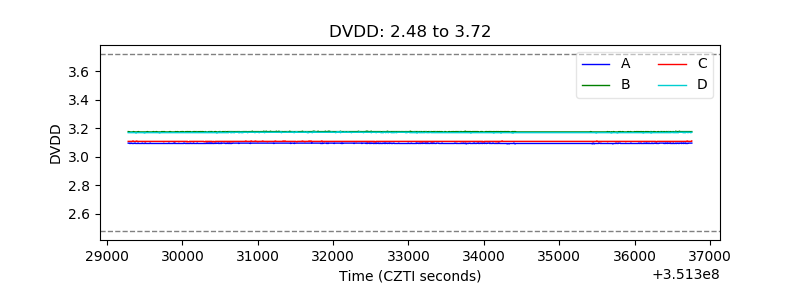 |
| Temperature 1 | 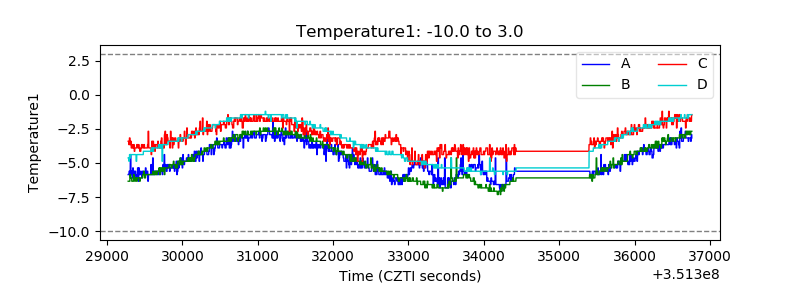 |
| Veto HV Monitor |  |
| Veto LLD | 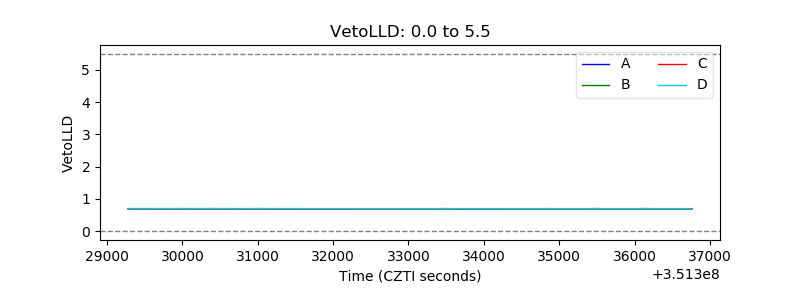 |
| Alpha Counter | 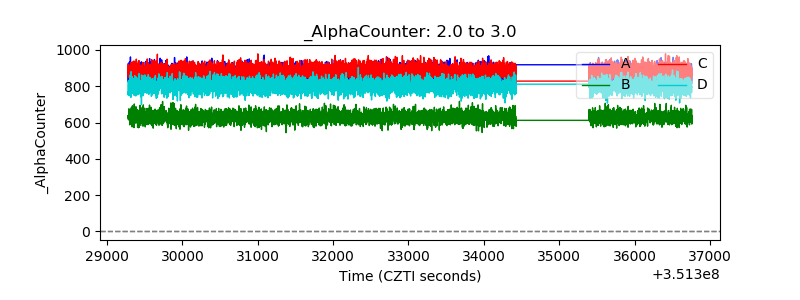 |
| _CPM_Rate | 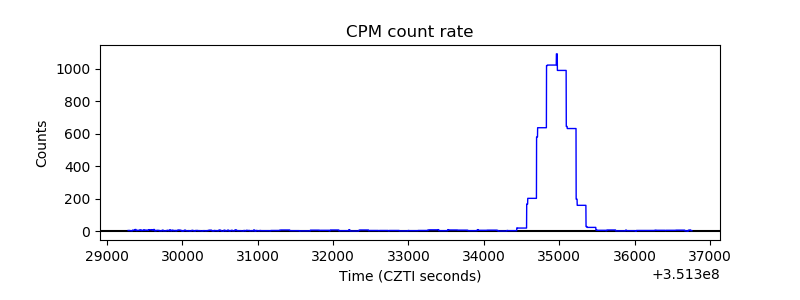 |
| CZT Counter | 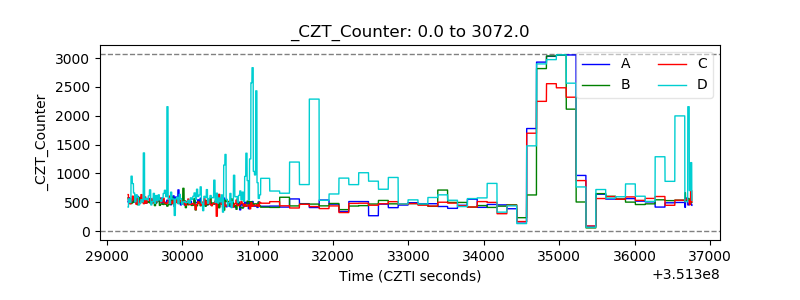 |
| +2.5 Volts monitor | 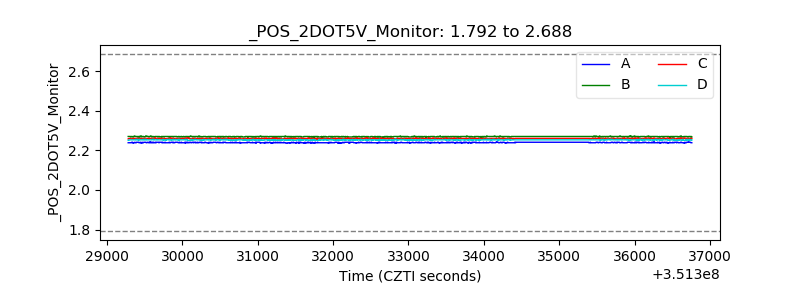 |
| +5 Volts monitor |  |
| _ROLL_ROT | 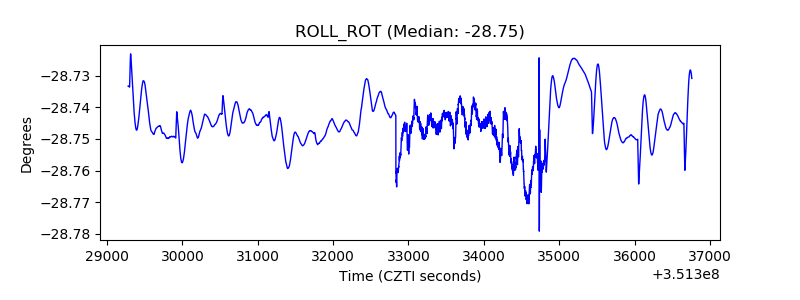 |
| _Roll_DEC | 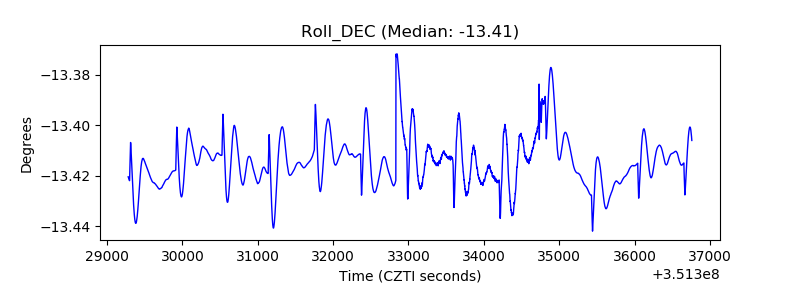 |
| _Roll_RA |  |
| Veto Counter | 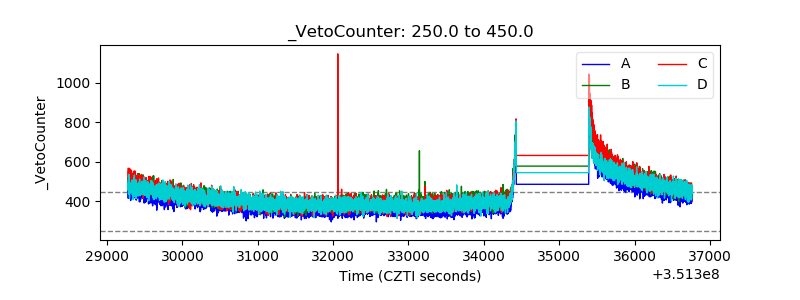 |