| Param | Original file | Final file |
|---|---|---|
| Filename | modeM0/AS1A10_099T01_9000004184_29165cztM0_level2.evt | modeM0/AS1A10_099T01_9000004184_29165cztM0_level2_quad_clean.evt |
| Size (bytes) | 548,519,040 | 66,703,680 |
| Size | 523.1 MB | 63.6 MB |
| Events in quadrant A | 3,641,493 | 397,483 |
| Events in quadrant B | 3,727,624 | 401,967 |
| Events in quadrant C | 3,793,494 | 384,753 |
| Events in quadrant D | 4,996,974 | 369,845 |
| Mode M9 | |||
|---|---|---|---|
| Quadrant | BADHDUFLAG | Total packets | Discarded packets |
| A | 0 | 17 | 0 |
| B | 0 | 18 | 0 |
| C | 0 | 18 | 0 |
| D | 0 | 18 | 0 |
| Mode SS | |||
|---|---|---|---|
| Quadrant | BADHDUFLAG | Total packets | Discarded packets |
| A | 0 | 136 | 0 |
| B | 0 | 136 | 0 |
| C | 0 | 136 | 0 |
| D | 0 | 136 | 0 |
| Mode M0 | |||
|---|---|---|---|
| Quadrant | BADHDUFLAG | Total packets | Discarded packets |
| A | 0 | 15176 | 2 |
| B | 0 | 15314 | 2 |
| C | 0 | 15555 | 2 |
| D | 0 | 19548 | 2 |
| Quadrant | Total seconds | Saturated seconds | Saturation percentage |
|---|---|---|---|
| A | 6675 | 91 | 1.363296% |
| B | 6675 | 88 | 1.318352% |
| C | 6675 | 149 | 2.232210% |
| D | 6675 | 278 | 4.164794% |
Noise dominated data is calculated using 1-second bins in cleaned event files. If a bin has >2000 counts, and if more than 50% of those come from <1% of pixels, then it is considered to be noise-dominated and hence unusable.
| Quadrant | # 1 sec bins | Bins with >0 counts | Bins with >2000 counts | High rate bins dominated by noise | Noise dominated (total time) | Noise dominated (detector-on time) | Marked lightcurve |
|---|---|---|---|---|---|---|---|
| A | 7900 | 6676 | 0 | 0 | 0.00% | 0.00% | 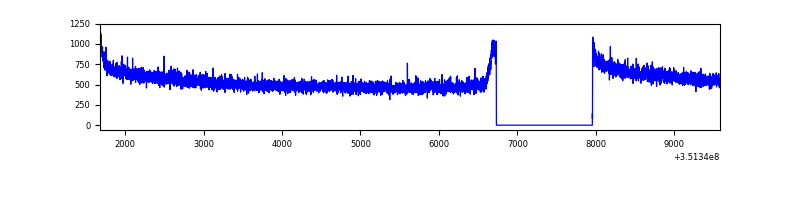 |
| B | 7900 | 6676 | 0 | 0 | 0.00% | 0.00% | 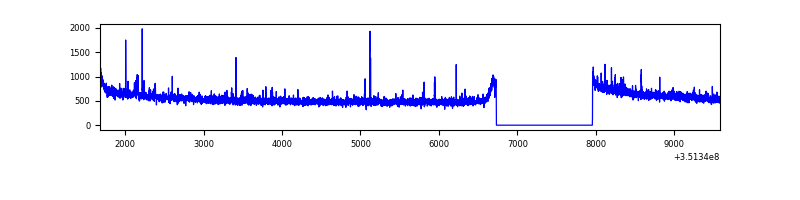 |
| C | 7900 | 6676 | 1 | 1 | 0.01% | 0.01% | 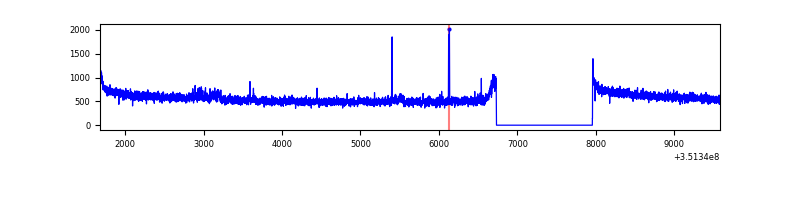 |
| D | 7900 | 6676 | 167 | 167 | 2.11% | 2.50% | 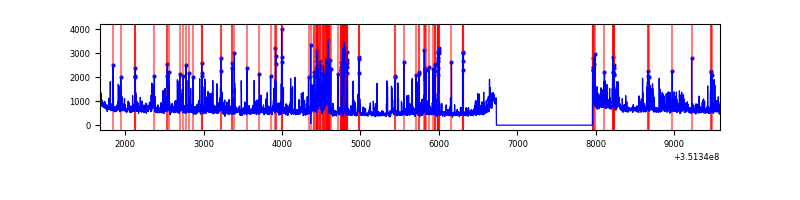 |
Top three noisy pixels from each quadrant. If the there are fewer than three noisy pixels in the level2.evt file, extra rows are filled as -1
| Pixel properties | Quadrant properties | ||||||
|---|---|---|---|---|---|---|---|
| Quadrant | DetID | PixID | Counts | Sigma | Mean | Median | Sigma |
| A | 13 | 254 | 11853 | 58.57 | 943 | 928 | 186.5 |
| A | 3 | 137 | 8618 | 41.23 | 943 | 928 | 186.5 |
| A | 0 | 226 | 8246 | 39.24 | 943 | 928 | 186.5 |
| B | 0 | 183 | 43521 | 244.54 | 928 | 905 | 174.3 |
| B | 0 | 190 | 22272 | 122.61 | 928 | 905 | 174.3 |
| B | 12 | 111 | 20632 | 113.2 | 928 | 905 | 174.3 |
| C | 14 | 238 | 146338 | 701.54 | 898 | 908 | 207.3 |
| C | 3 | 233 | 79722 | 380.19 | 898 | 908 | 207.3 |
| C | 14 | 241 | 52902 | 250.82 | 898 | 908 | 207.3 |
| D | 1 | 52 | 1276200 | 6079.84 | 899 | 878 | 209.8 |
| D | 8 | 195 | 294609 | 1400.3 | 899 | 878 | 209.8 |
| D | 2 | 234 | 26191 | 120.67 | 899 | 878 | 209.8 |
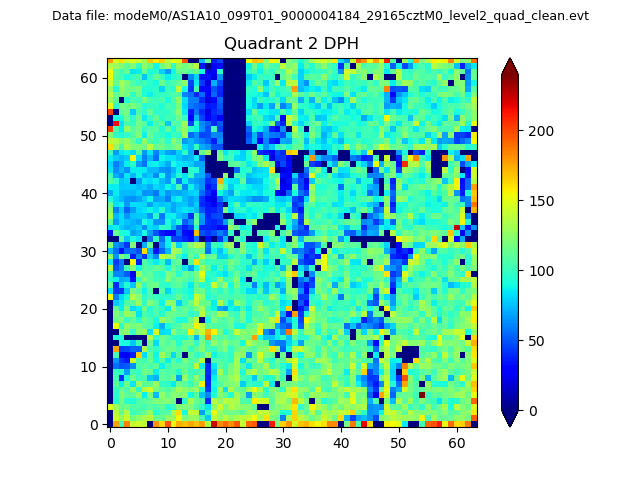
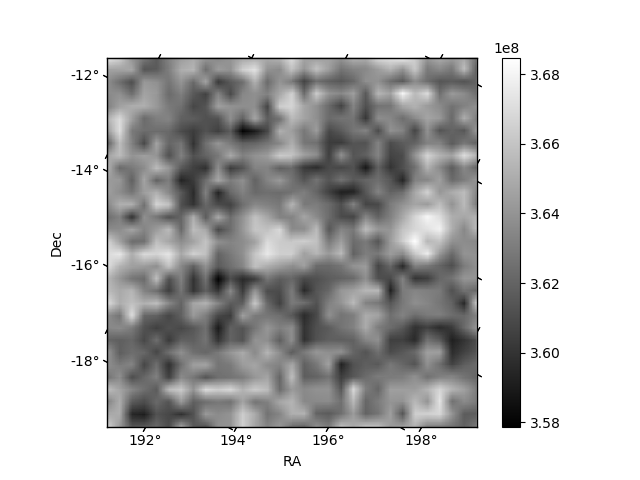
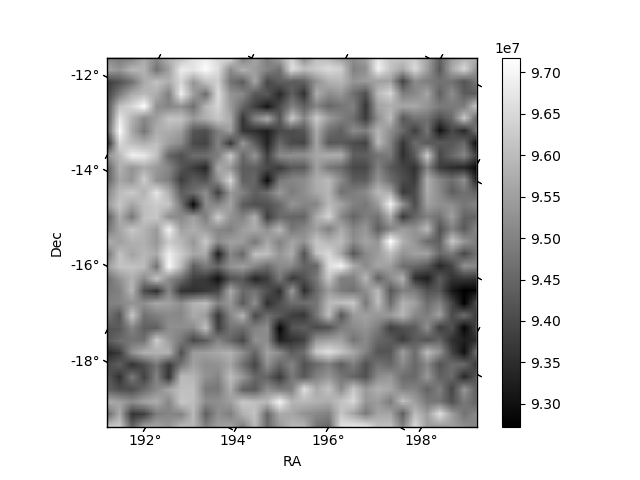
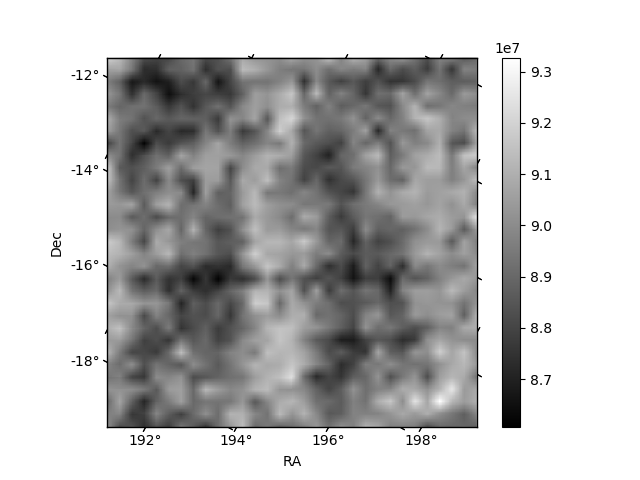
Histogram calculated using DETX and DETY for each event in the final _common_clean file
| Quadrant A | 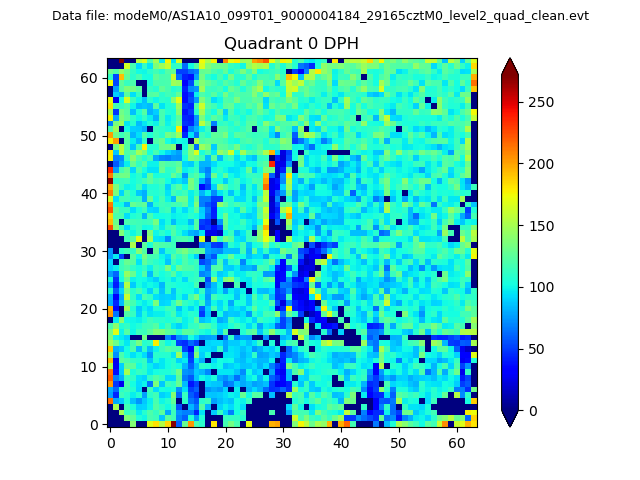 |
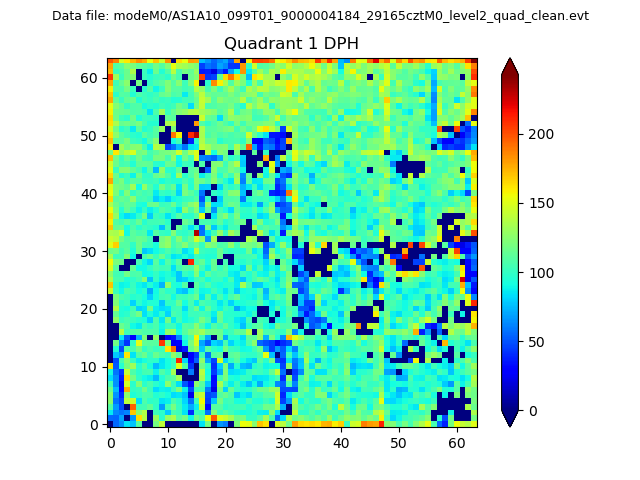 |
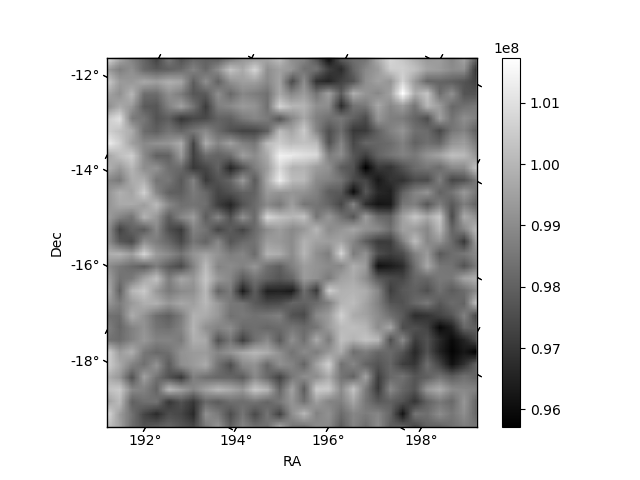
Quadrant B |
|---|---|---|---|
| Quadrant D | 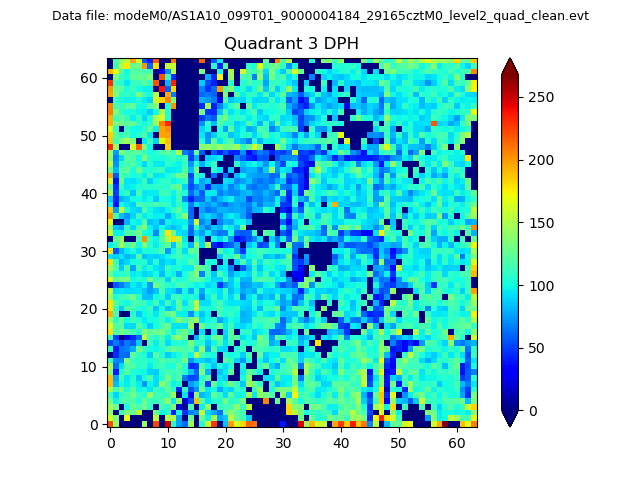 |
 |
Quadrant C |
| Plot type | Count rate plots | Images |
|---|---|---|
| Comparison with Poisson distribution Blue bars denote a histogram of data divided into 1 sec bins. Red curve is a Poisson curve with rate = median count rate of data. |
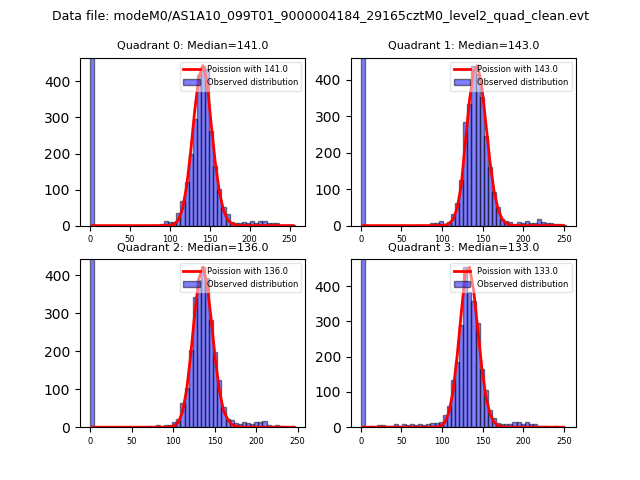 |
 |
| Quadrant-wise count rates Data is divided into 100 sec bins |
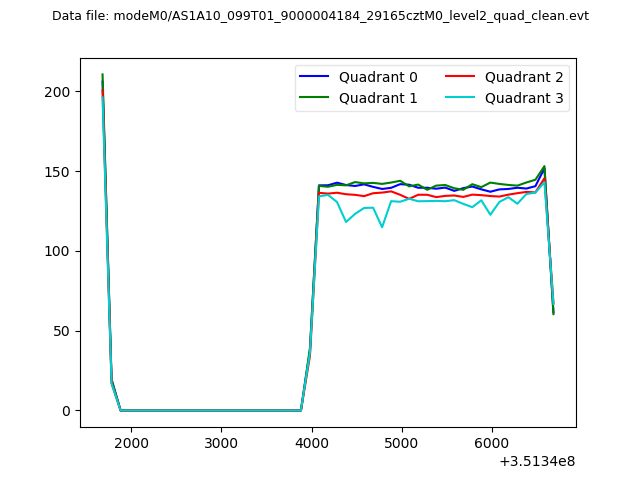 |
|
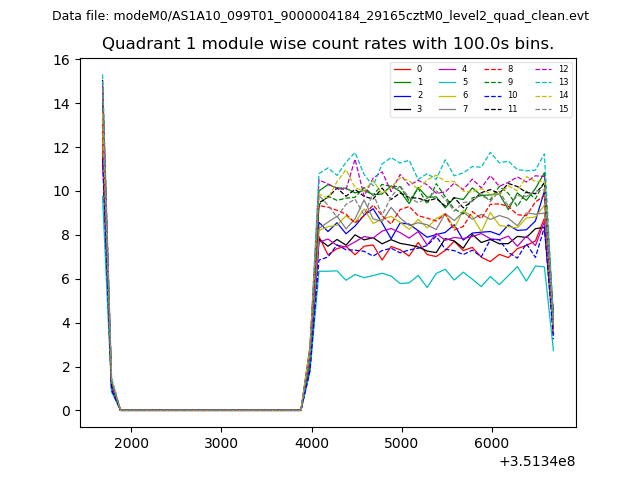
| Module-wise count rates for Quadrant A Data is divided into 100 sec bins |
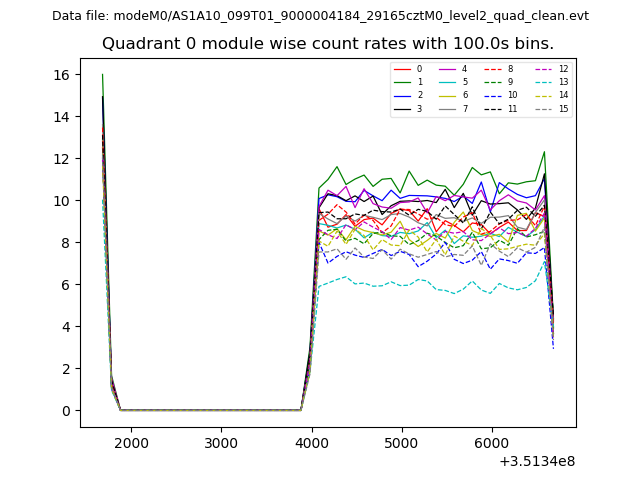 |
 |
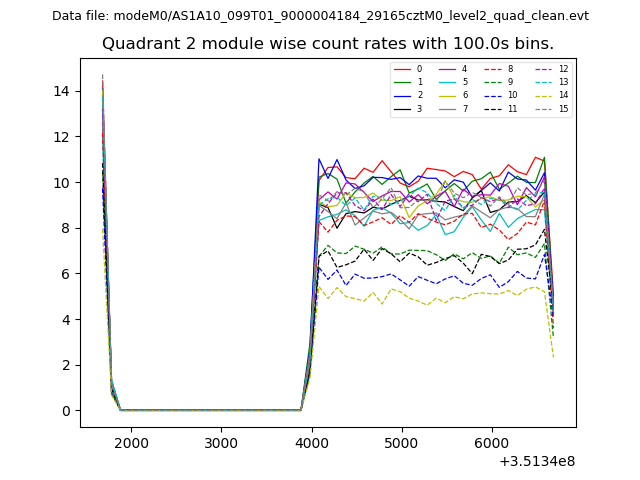
| Module-wise count rates for Quadrant B Data is divided into 100 sec bins |
 |
 |
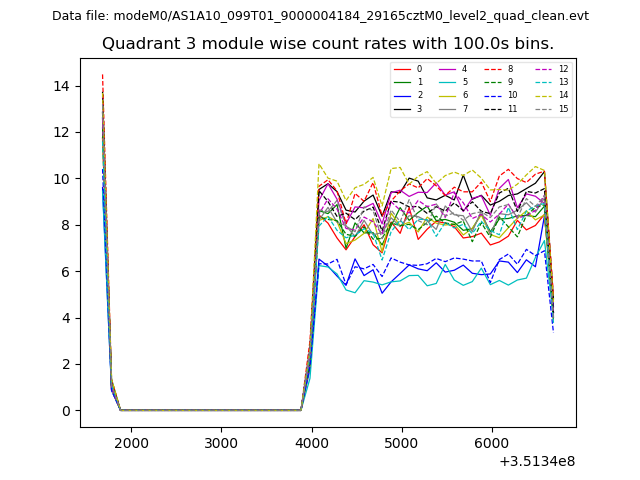
| Module-wise count rates for Quadrant C Data is divided into 100 sec bins |
 |
 |
| Module-wise count rates for Quadrant D Data is divided into 100 sec bins |
 |
 |
| Parameter | Plot |
|---|---|
| CZT HV Monitor | 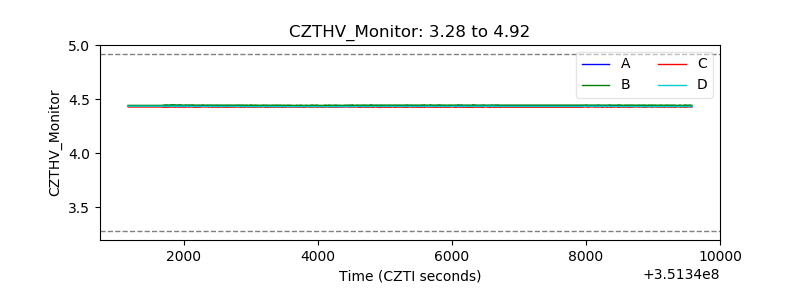 |
| D_VDD | 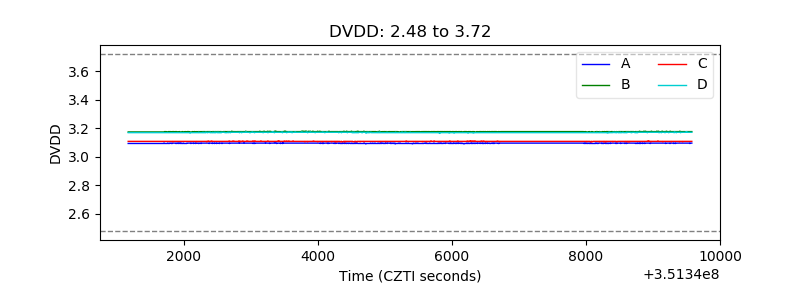 |
| Temperature 1 | 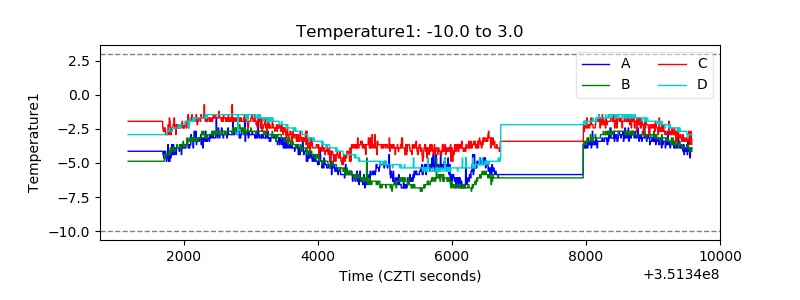 |
| Veto HV Monitor | 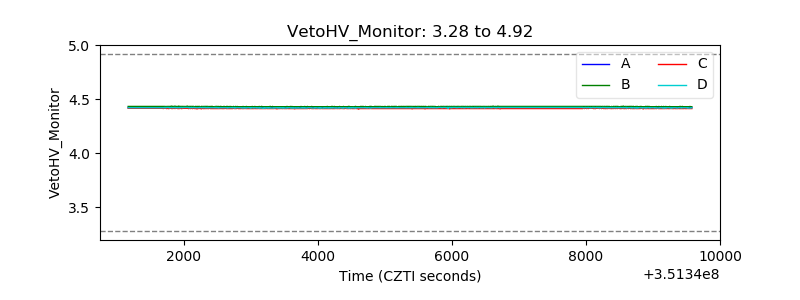 |
| Veto LLD | 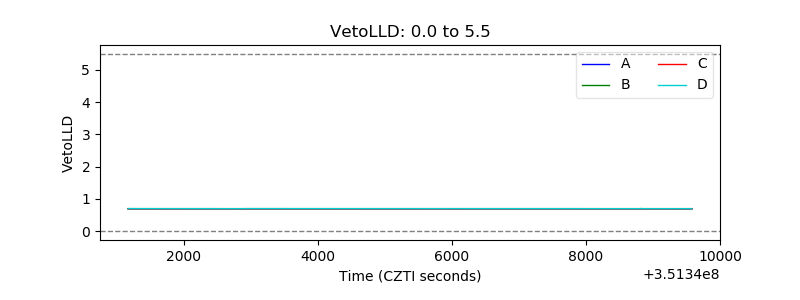 |
| Alpha Counter | 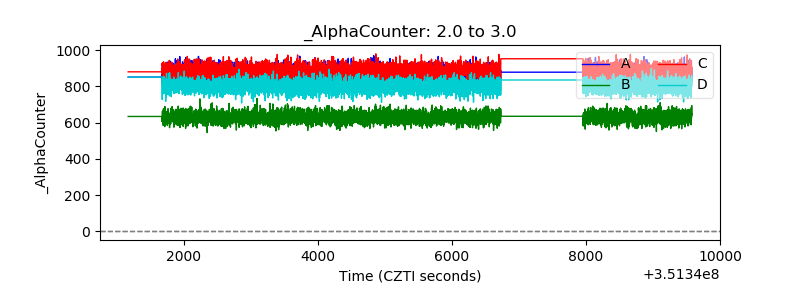 |
| _CPM_Rate | 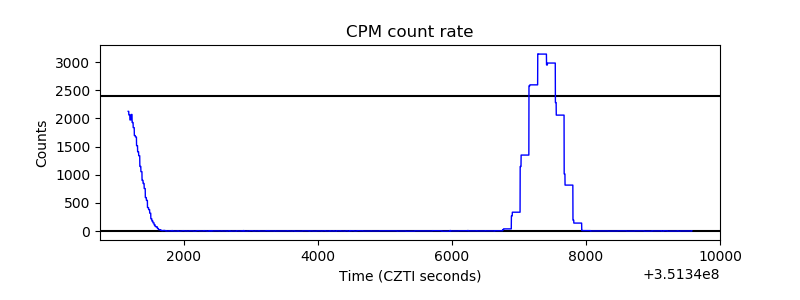 |
| CZT Counter | 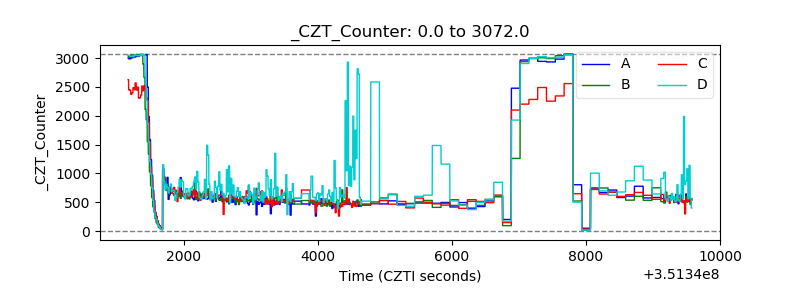 |
| +2.5 Volts monitor |  |
| +5 Volts monitor |  |
| _ROLL_ROT | 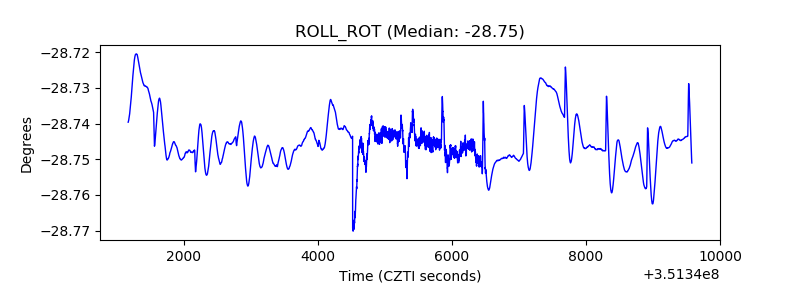 |
| _Roll_DEC | 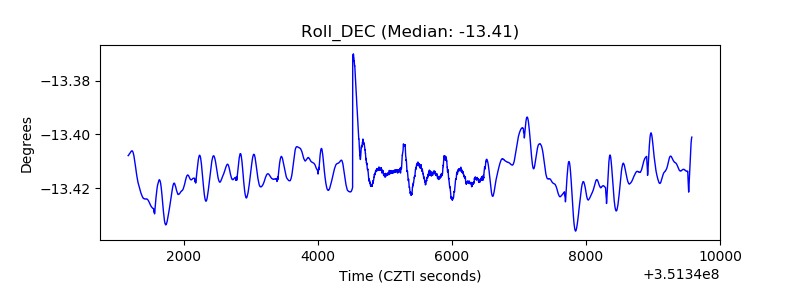 |
| _Roll_RA | 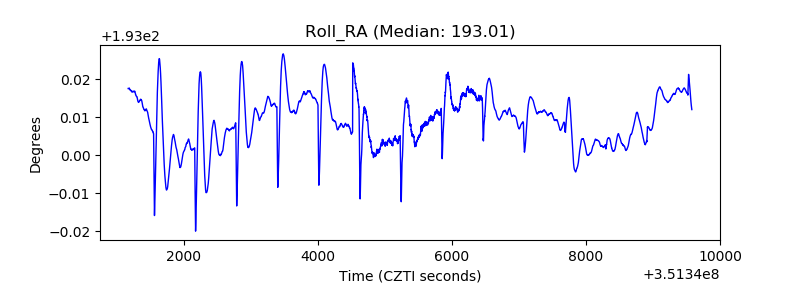 |
| Veto Counter | 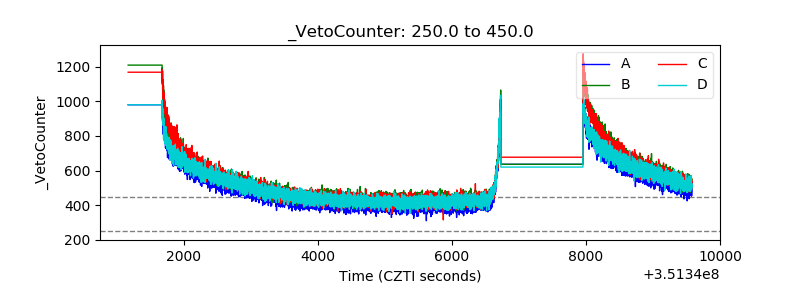 |