| Param | Original file | Final file |
|---|---|---|
| Filename | modeM0/AS1A10_099T01_9000004184_29166cztM0_level2.evt | modeM0/AS1A10_099T01_9000004184_29166cztM0_level2_quad_clean.evt |
| Size (bytes) | 536,788,800 | 72,276,480 |
| Size | 511.9 MB | 68.9 MB |
| Events in quadrant A | 3,622,584 | 445,079 |
| Events in quadrant B | 3,745,315 | 451,805 |
| Events in quadrant C | 3,657,168 | 428,941 |
| Events in quadrant D | 4,799,481 | 417,826 |
| Mode M9 | |||
|---|---|---|---|
| Quadrant | BADHDUFLAG | Total packets | Discarded packets |
| A | 0 | 16 | 0 |
| B | 0 | 17 | 0 |
| C | 0 | 17 | 0 |
| D | 0 | 17 | 0 |
| Mode SS | |||
|---|---|---|---|
| Quadrant | BADHDUFLAG | Total packets | Discarded packets |
| A | 0 | 130 | 0 |
| B | 0 | 130 | 0 |
| C | 0 | 130 | 0 |
| D | 0 | 130 | 0 |
| Mode M0 | |||
|---|---|---|---|
| Quadrant | BADHDUFLAG | Total packets | Discarded packets |
| A | 0 | 14975 | 2 |
| B | 0 | 15299 | 2 |
| C | 0 | 14996 | 2 |
| D | 0 | 18645 | 2 |
| Quadrant | Total seconds | Saturated seconds | Saturation percentage |
|---|---|---|---|
| A | 6375 | 98 | 1.537255% |
| B | 6375 | 136 | 2.133333% |
| C | 6375 | 180 | 2.823529% |
| D | 6375 | 299 | 4.690196% |
Noise dominated data is calculated using 1-second bins in cleaned event files. If a bin has >2000 counts, and if more than 50% of those come from <1% of pixels, then it is considered to be noise-dominated and hence unusable.
| Quadrant | # 1 sec bins | Bins with >0 counts | Bins with >2000 counts | High rate bins dominated by noise | Noise dominated (total time) | Noise dominated (detector-on time) | Marked lightcurve |
|---|---|---|---|---|---|---|---|
| A | 7680 | 6376 | 0 | 0 | 0.00% | 0.00% | 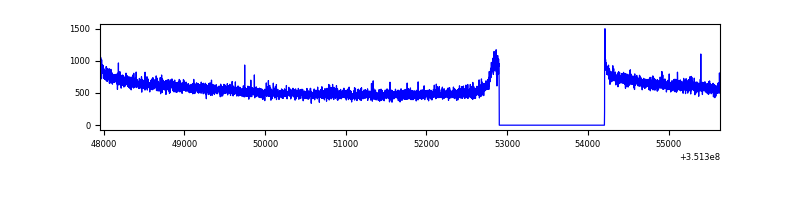 |
| B | 7680 | 6376 | 11 | 11 | 0.14% | 0.17% | 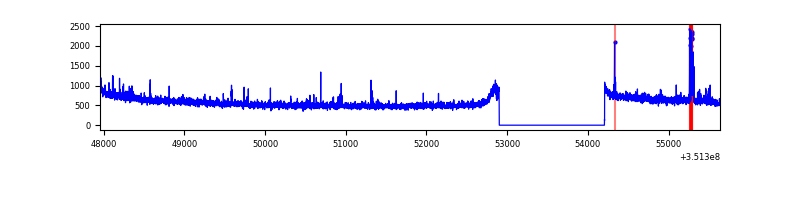 |
| C | 7680 | 6376 | 0 | 0 | 0.00% | 0.00% | 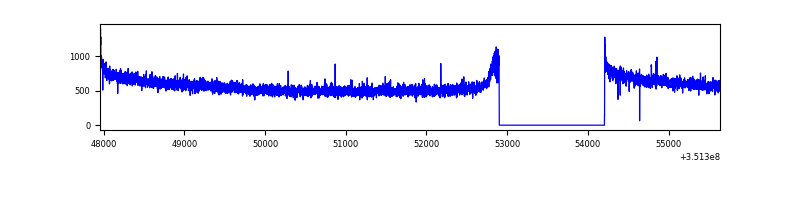 |
| D | 7680 | 6376 | 144 | 144 | 1.88% | 2.26% | 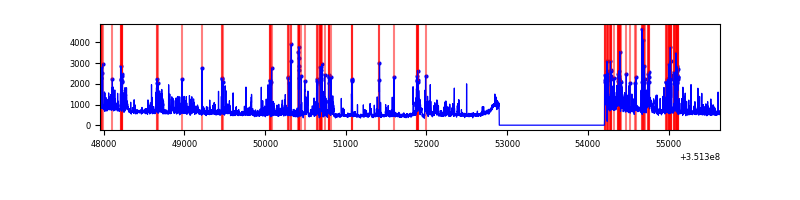 |
Top three noisy pixels from each quadrant. If the there are fewer than three noisy pixels in the level2.evt file, extra rows are filled as -1
| Pixel properties | Quadrant properties | ||||||
|---|---|---|---|---|---|---|---|
| Quadrant | DetID | PixID | Counts | Sigma | Mean | Median | Sigma |
| A | 13 | 254 | 11856 | 59.37 | 938 | 924 | 184.1 |
| A | 3 | 137 | 8582 | 41.59 | 938 | 924 | 184.1 |
| A | 0 | 226 | 7962 | 38.22 | 938 | 924 | 184.1 |
| B | 0 | 183 | 96097 | 556.4 | 924 | 905 | 171.1 |
| B | 12 | 111 | 20119 | 112.31 | 924 | 905 | 171.1 |
| B | 11 | 111 | 18813 | 104.67 | 924 | 905 | 171.1 |
| C | 14 | 238 | 147379 | 726.67 | 886 | 895 | 201.6 |
| C | 3 | 233 | 37485 | 181.51 | 886 | 895 | 201.6 |
| C | 2 | 114 | 15237 | 71.15 | 886 | 895 | 201.6 |
| D | 1 | 52 | 1217815 | 5891.09 | 883 | 864 | 206.6 |
| D | 8 | 195 | 202554 | 976.35 | 883 | 864 | 206.6 |
| D | 2 | 234 | 25596 | 119.72 | 883 | 864 | 206.6 |
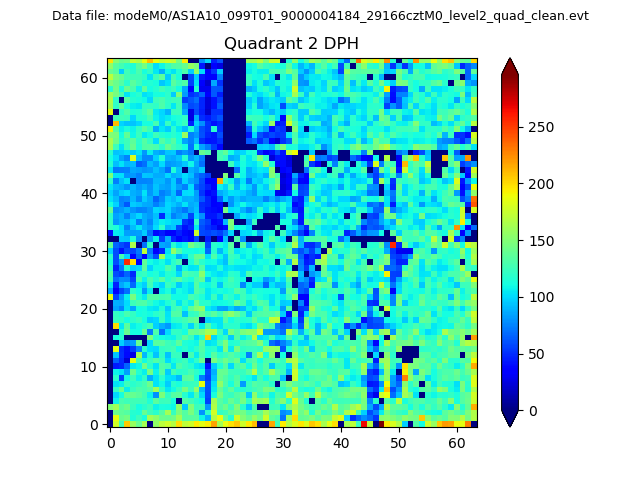
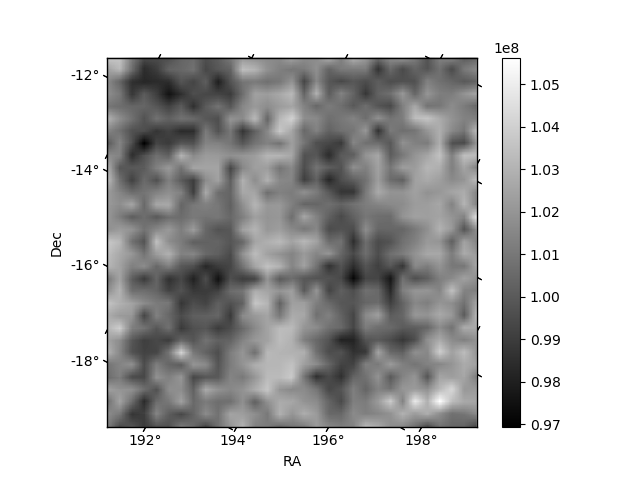
Histogram calculated using DETX and DETY for each event in the final _common_clean file
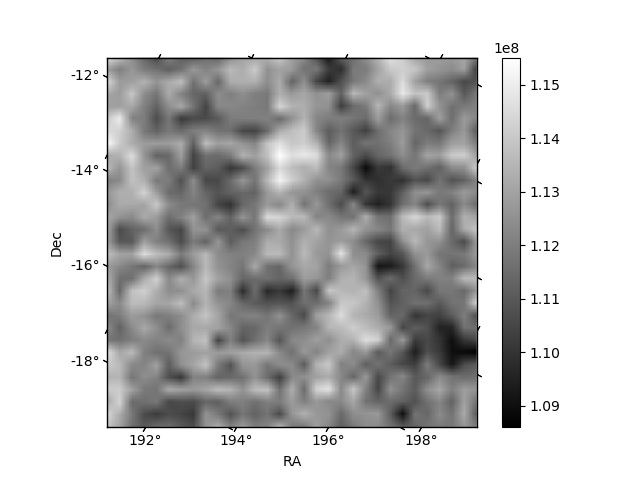
| Quadrant A | 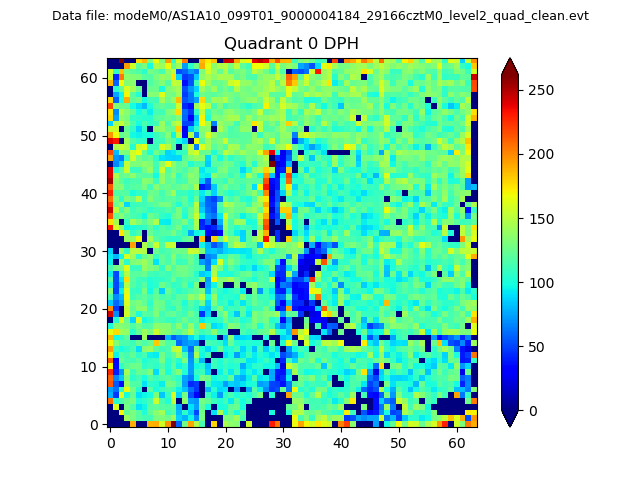 |
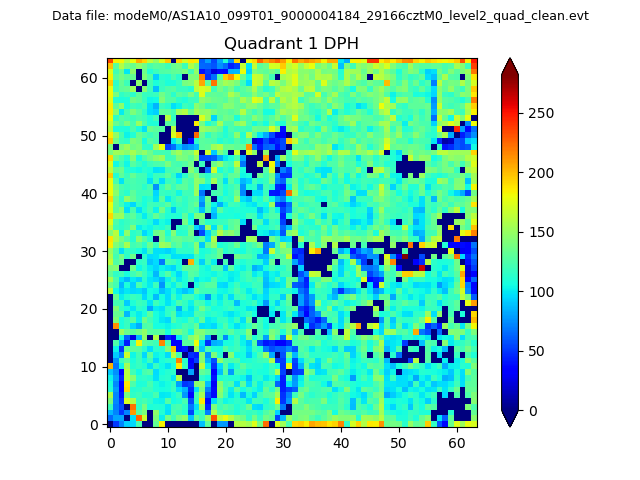 |
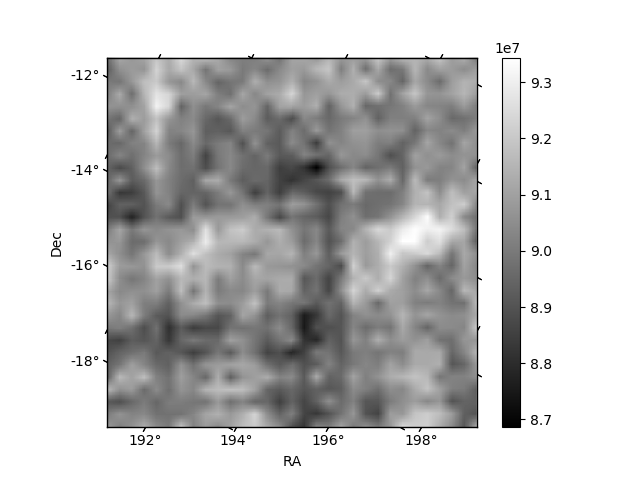
Quadrant B |
|---|---|---|---|
| Quadrant D | 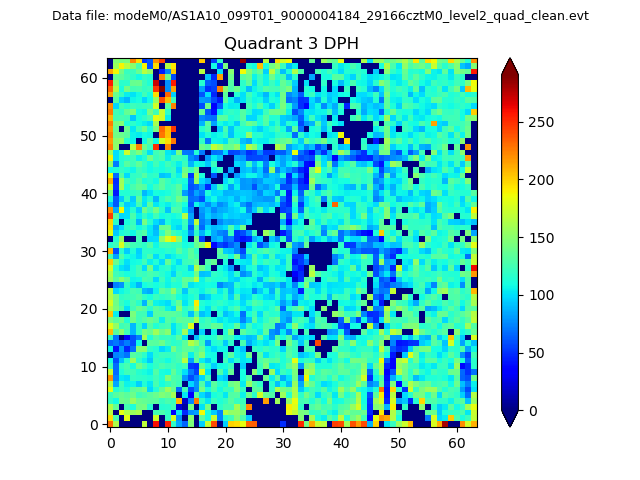 |
 |
Quadrant C |
| Plot type | Count rate plots | Images |
|---|---|---|
| Comparison with Poisson distribution Blue bars denote a histogram of data divided into 1 sec bins. Red curve is a Poisson curve with rate = median count rate of data. |
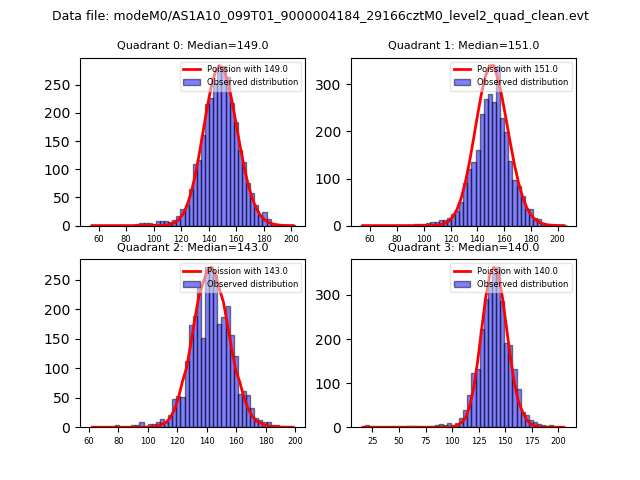 |
 |
| Quadrant-wise count rates Data is divided into 100 sec bins |
 |
|
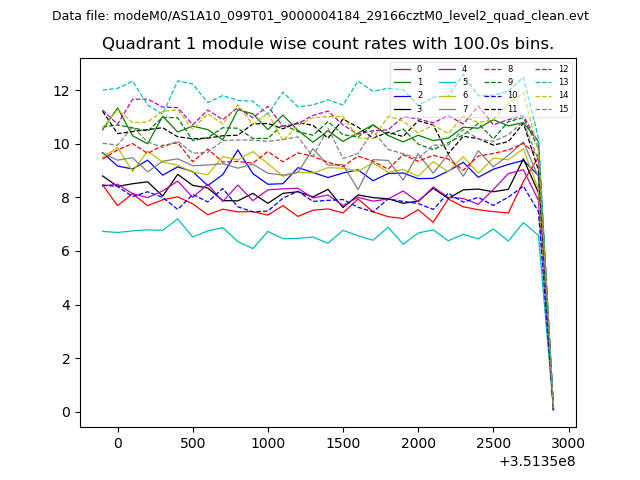
| Module-wise count rates for Quadrant A Data is divided into 100 sec bins |
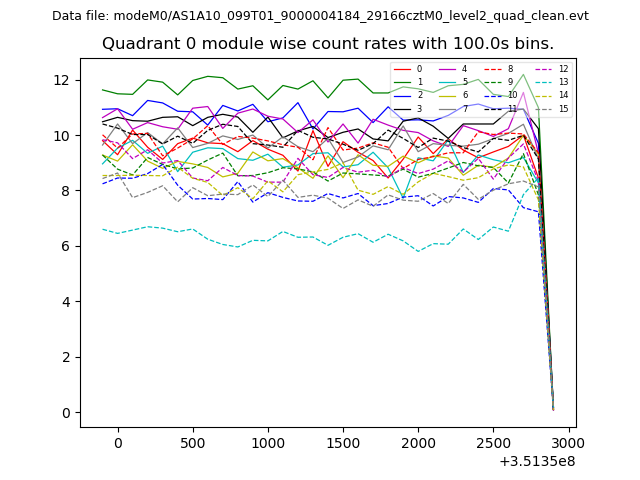 |
 |
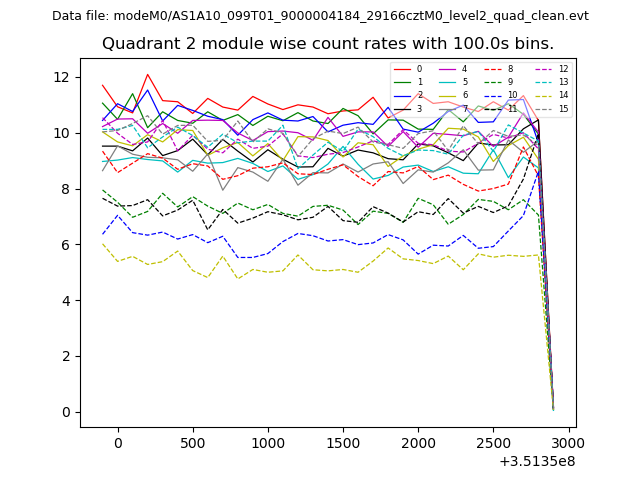
| Module-wise count rates for Quadrant B Data is divided into 100 sec bins |
 |
 |
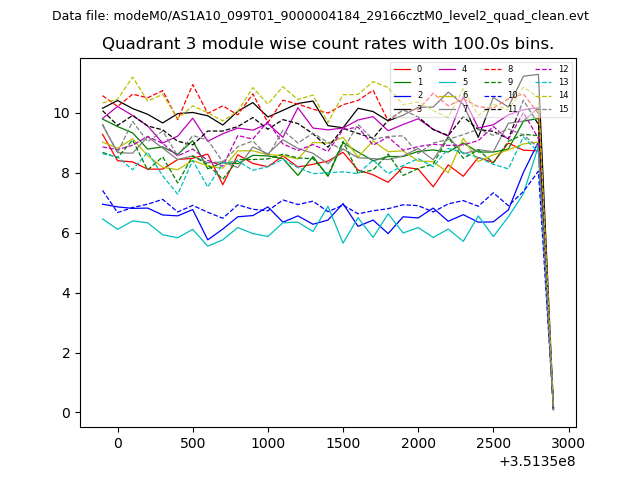
| Module-wise count rates for Quadrant C Data is divided into 100 sec bins |
 |
 |
| Module-wise count rates for Quadrant D Data is divided into 100 sec bins |
 |
 |
| Parameter | Plot |
|---|---|
| CZT HV Monitor | 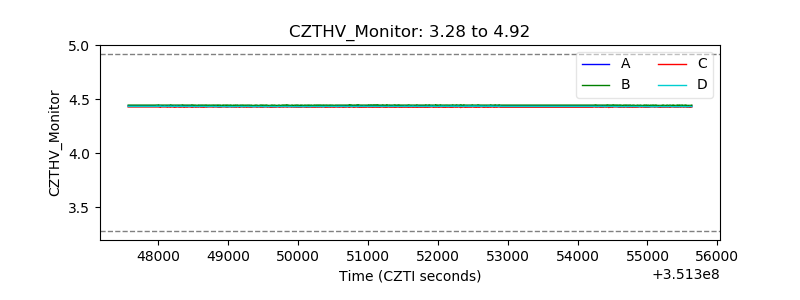 |
| D_VDD | 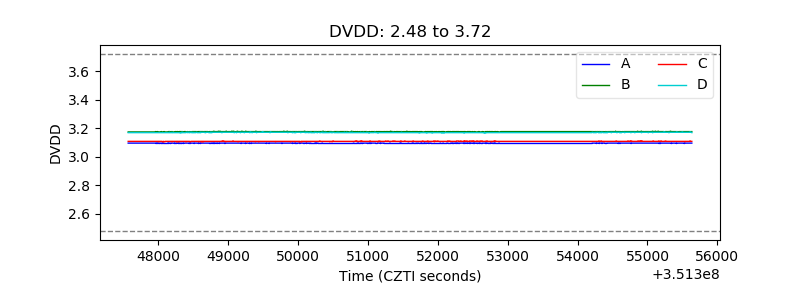 |
| Temperature 1 | 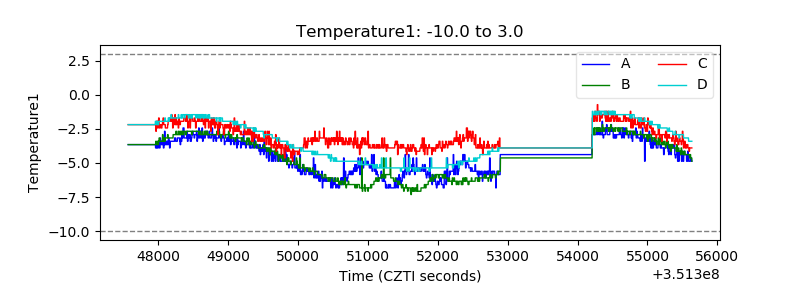 |
| Veto HV Monitor | 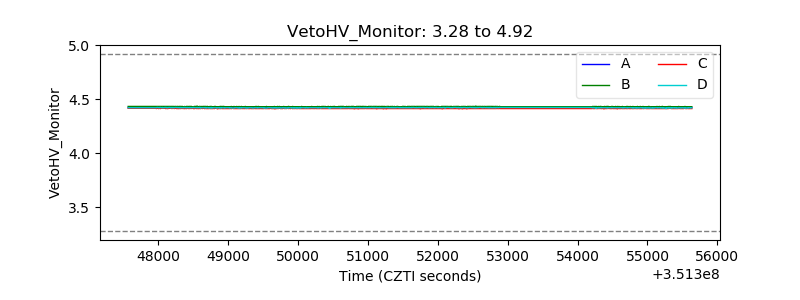 |
| Veto LLD |  |
| Alpha Counter | 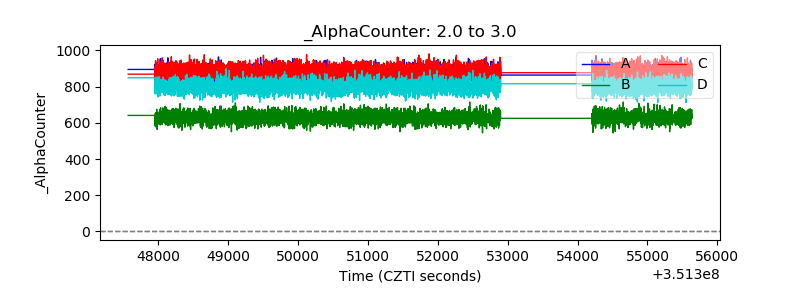 |
| _CPM_Rate |  |
| CZT Counter | 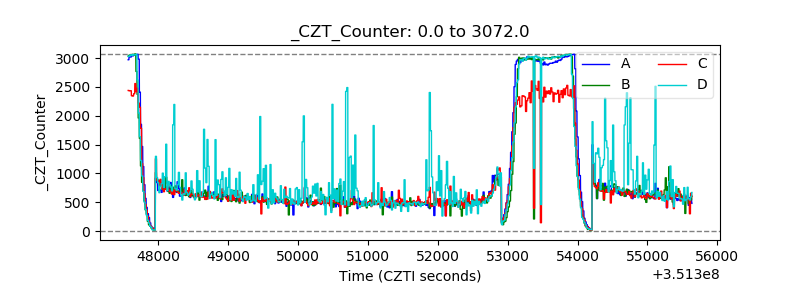 |
| +2.5 Volts monitor |  |
| +5 Volts monitor |  |
| _ROLL_ROT | 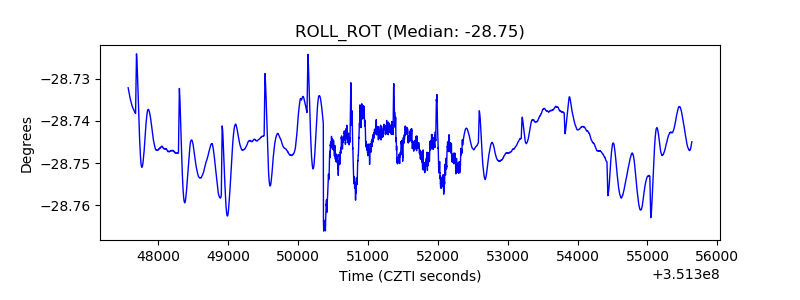 |
| _Roll_DEC | 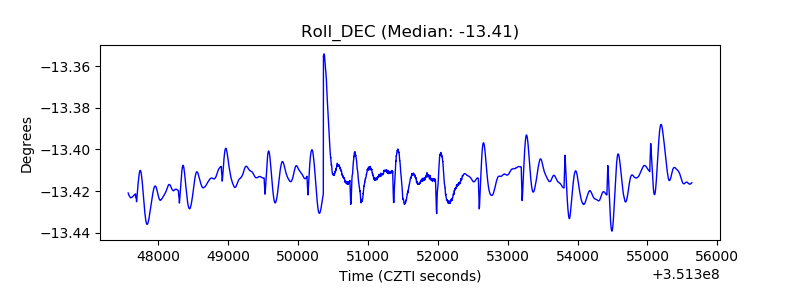 |
| _Roll_RA | 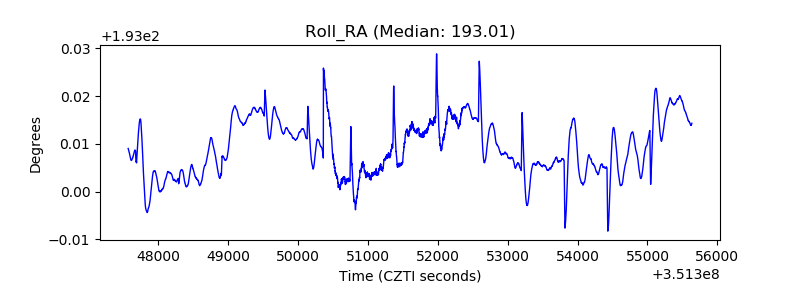 |
| Veto Counter | 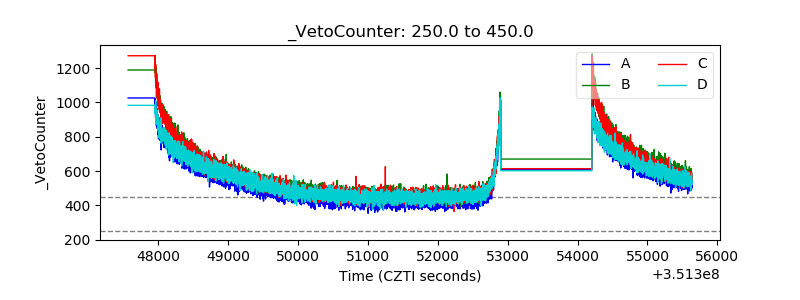 |