| Param | Original file | Final file |
|---|---|---|
| Filename | modeM0/AS1A10_099T01_9000004184_29167cztM0_level2.evt | modeM0/AS1A10_099T01_9000004184_29167cztM0_level2_quad_clean.evt |
| Size (bytes) | 516,216,960 | 82,771,200 |
| Size | 492.3 MB | 78.9 MB |
| Events in quadrant A | 3,485,321 | 531,450 |
| Events in quadrant B | 3,610,287 | 541,234 |
| Events in quadrant C | 3,582,251 | 509,454 |
| Events in quadrant D | 4,540,278 | 496,433 |
| Mode M9 | |||
|---|---|---|---|
| Quadrant | BADHDUFLAG | Total packets | Discarded packets |
| A | 0 | 24 | 0 |
| B | 0 | 25 | 0 |
| C | 0 | 25 | 0 |
| D | 0 | 25 | 0 |
| Mode SS | |||
|---|---|---|---|
| Quadrant | BADHDUFLAG | Total packets | Discarded packets |
| A | 0 | 126 | 0 |
| B | 0 | 126 | 0 |
| C | 0 | 126 | 0 |
| D | 0 | 126 | 0 |
| Mode M0 | |||
|---|---|---|---|
| Quadrant | BADHDUFLAG | Total packets | Discarded packets |
| A | 0 | 14372 | 2 |
| B | 0 | 14794 | 2 |
| C | 0 | 14690 | 2 |
| D | 0 | 17580 | 2 |
| Quadrant | Total seconds | Saturated seconds | Saturation percentage |
|---|---|---|---|
| A | 6125 | 111 | 1.812245% |
| B | 6124 | 152 | 2.482038% |
| C | 6124 | 159 | 2.596342% |
| D | 6124 | 375 | 6.123449% |
Noise dominated data is calculated using 1-second bins in cleaned event files. If a bin has >2000 counts, and if more than 50% of those come from <1% of pixels, then it is considered to be noise-dominated and hence unusable.
| Quadrant | # 1 sec bins | Bins with >0 counts | Bins with >2000 counts | High rate bins dominated by noise | Noise dominated (total time) | Noise dominated (detector-on time) | Marked lightcurve |
|---|---|---|---|---|---|---|---|
| A | 7475 | 6126 | 0 | 0 | 0.00% | 0.00% | 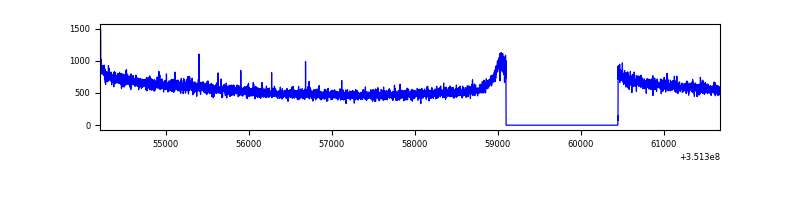 |
| B | 7474 | 6125 | 14 | 14 | 0.19% | 0.23% | 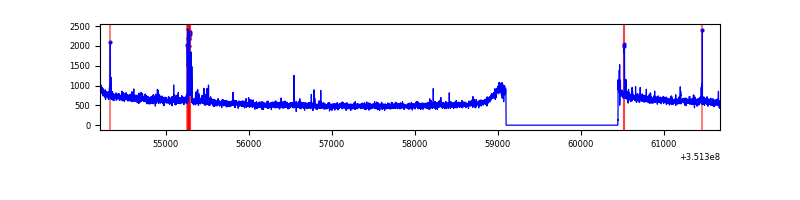 |
| C | 7474 | 6125 | 0 | 0 | 0.00% | 0.00% | 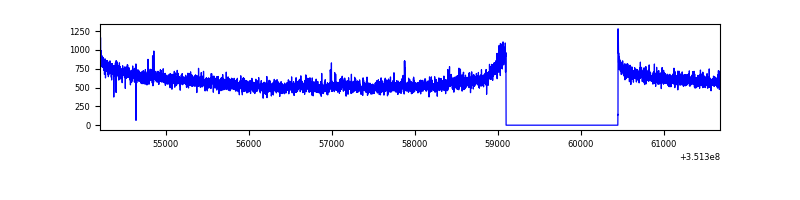 |
| D | 7474 | 6125 | 197 | 197 | 2.64% | 3.22% | 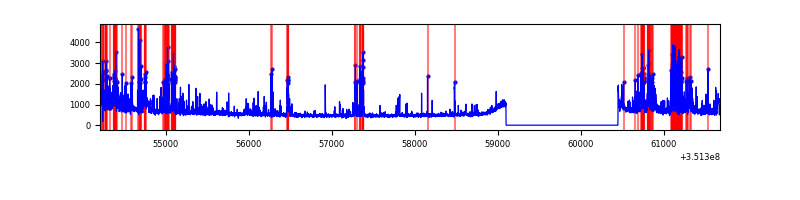 |
Top three noisy pixels from each quadrant. If the there are fewer than three noisy pixels in the level2.evt file, extra rows are filled as -1
| Pixel properties | Quadrant properties | ||||||
|---|---|---|---|---|---|---|---|
| Quadrant | DetID | PixID | Counts | Sigma | Mean | Median | Sigma |
| A | 13 | 254 | 11549 | 59.81 | 903 | 888 | 178.2 |
| A | 3 | 137 | 8071 | 40.3 | 903 | 888 | 178.2 |
| A | 0 | 226 | 7681 | 38.11 | 903 | 888 | 178.2 |
| B | 0 | 183 | 86184 | 514.08 | 893 | 875 | 165.9 |
| B | 12 | 111 | 19543 | 112.5 | 893 | 875 | 165.9 |
| B | 11 | 111 | 17549 | 100.48 | 893 | 875 | 165.9 |
| C | 14 | 238 | 141624 | 719.55 | 851 | 859 | 195.6 |
| C | 3 | 233 | 95087 | 481.67 | 851 | 859 | 195.6 |
| C | 2 | 114 | 14930 | 71.93 | 851 | 859 | 195.6 |
| D | 1 | 52 | 1053131 | 5412.4 | 835 | 818 | 194.4 |
| D | 8 | 195 | 207678 | 1063.95 | 835 | 818 | 194.4 |
| D | 13 | 104 | 55701 | 282.28 | 835 | 818 | 194.4 |
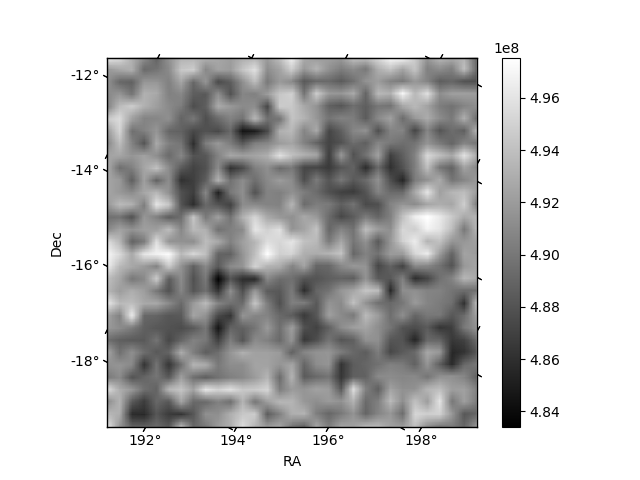
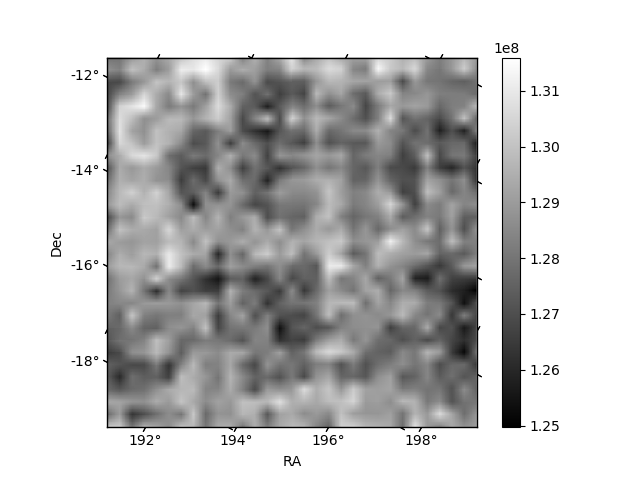
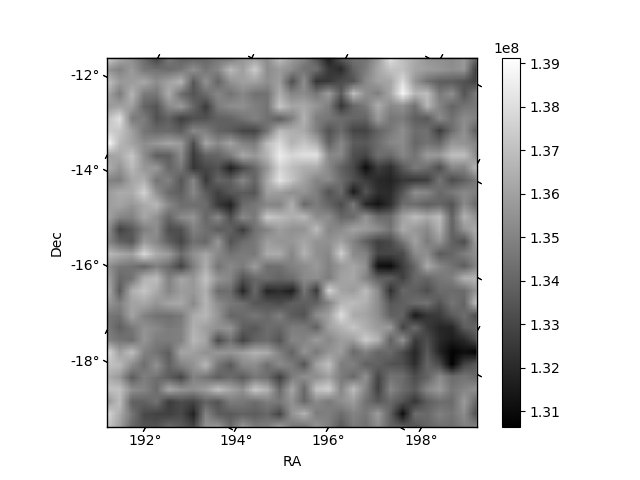
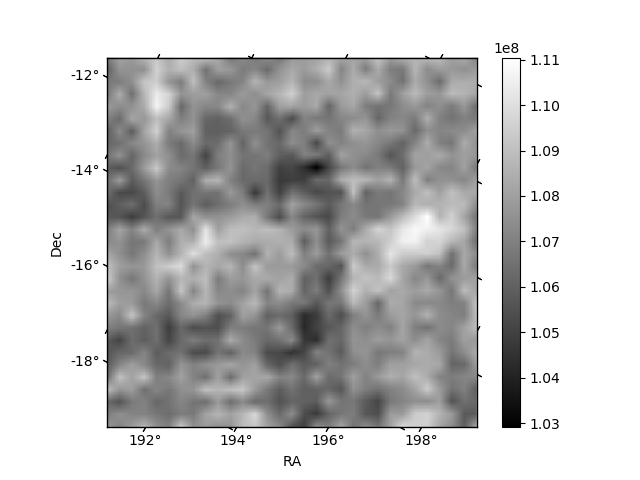
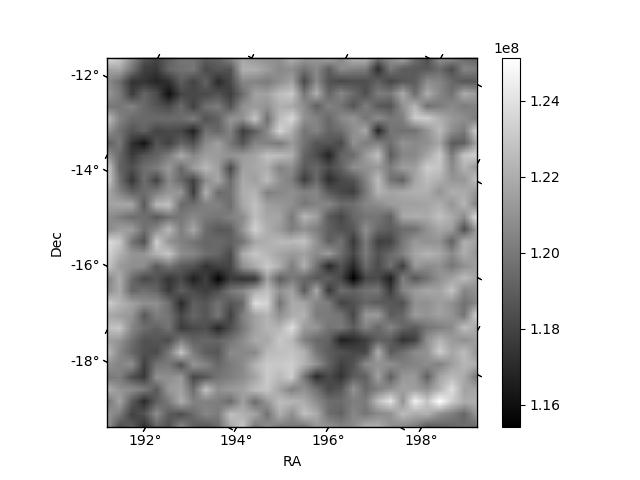
Histogram calculated using DETX and DETY for each event in the final _common_clean file
| Quadrant A | 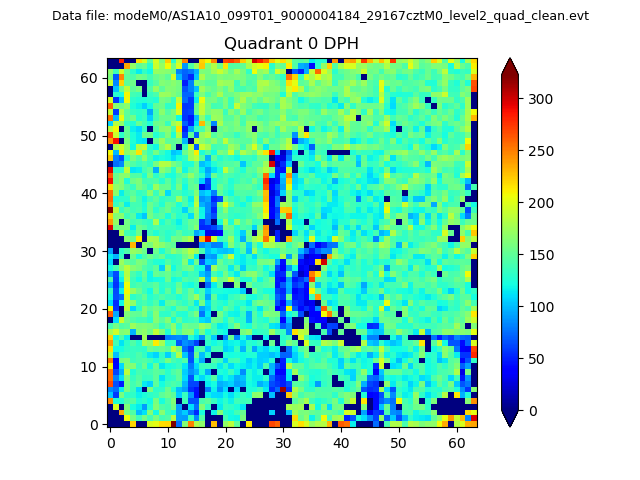 |
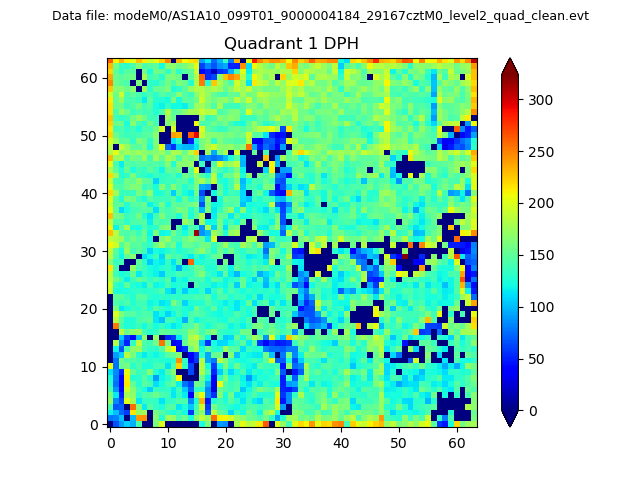 |
Quadrant B |
|---|---|---|---|
| Quadrant D |  |
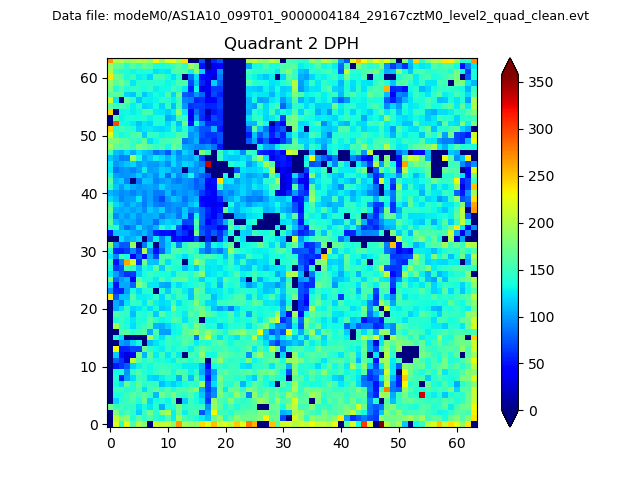 |
Quadrant C |
| Plot type | Count rate plots | Images |
|---|---|---|
| Comparison with Poisson distribution Blue bars denote a histogram of data divided into 1 sec bins. Red curve is a Poisson curve with rate = median count rate of data. |
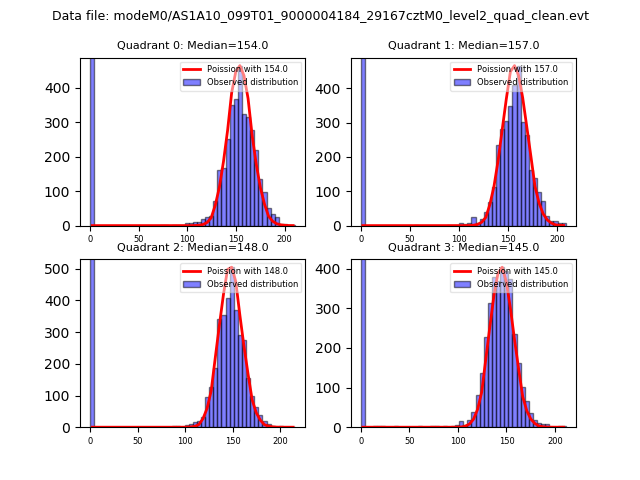 |
 |
| Quadrant-wise count rates Data is divided into 100 sec bins |
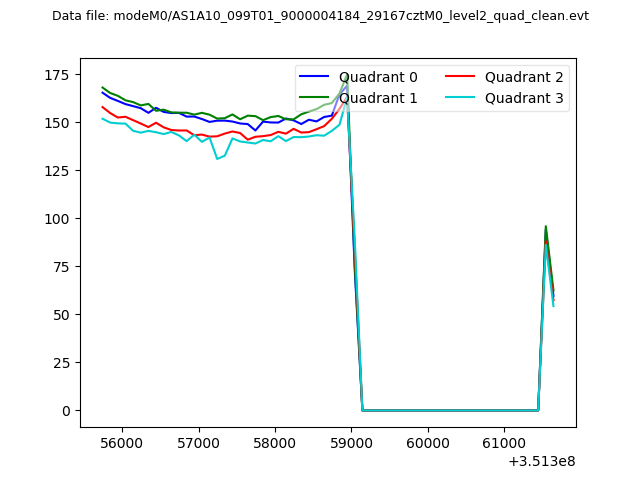 |
|
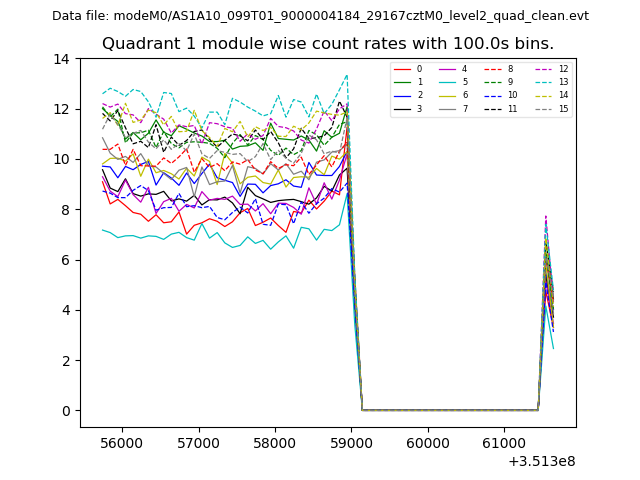
| Module-wise count rates for Quadrant A Data is divided into 100 sec bins |
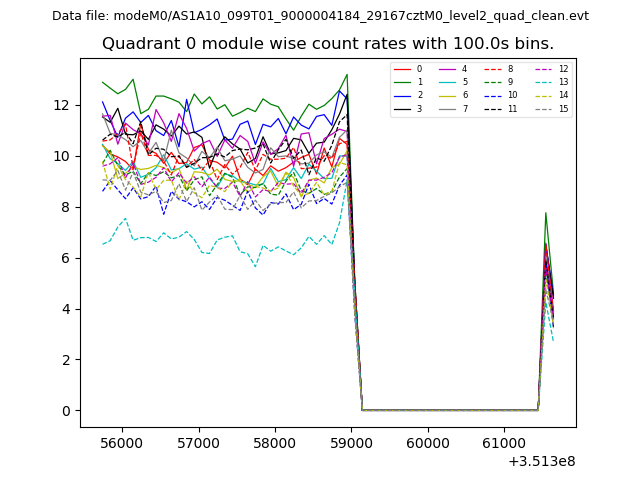 |
 |
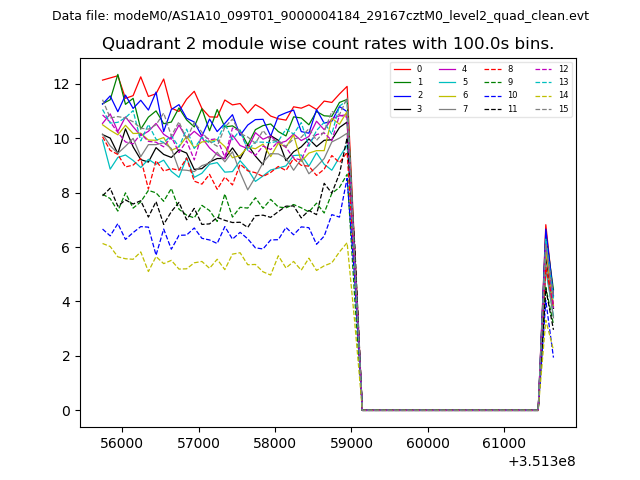
| Module-wise count rates for Quadrant B Data is divided into 100 sec bins |
 |
 |
| Module-wise count rates for Quadrant C Data is divided into 100 sec bins |
 |
 |
| Module-wise count rates for Quadrant D Data is divided into 100 sec bins |
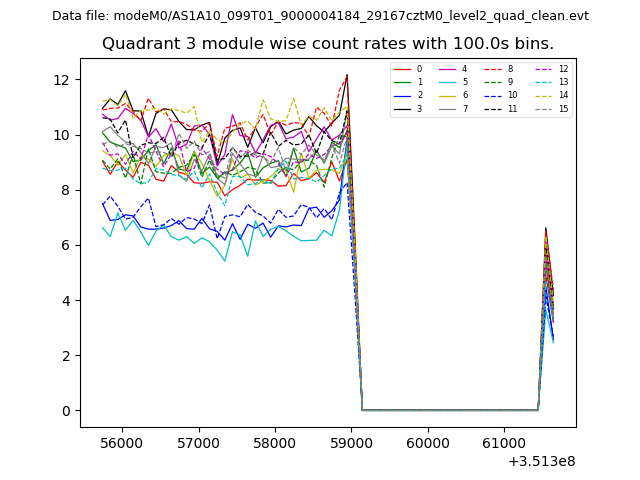 |
 |
| Parameter | Plot |
|---|---|
| CZT HV Monitor | 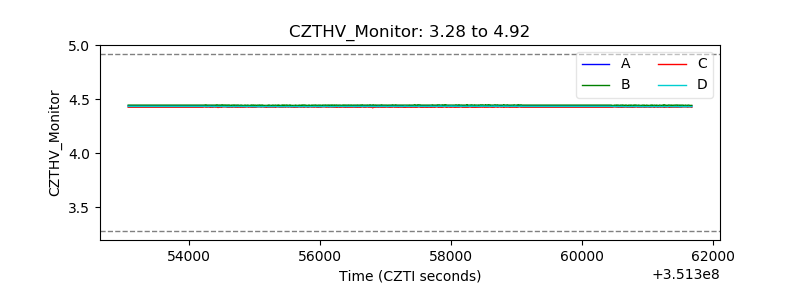 |
| D_VDD | 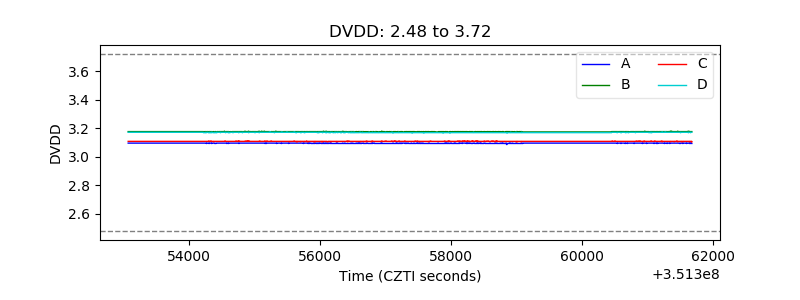 |
| Temperature 1 | 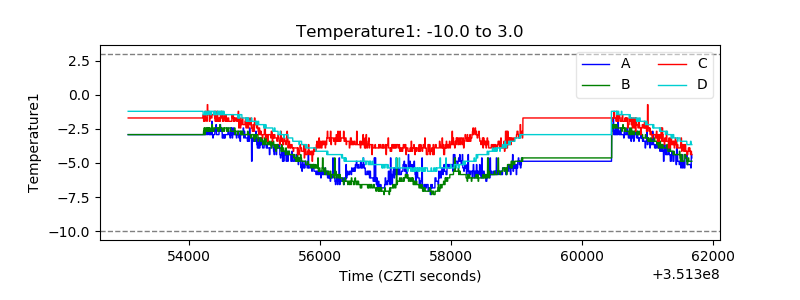 |
| Veto HV Monitor | 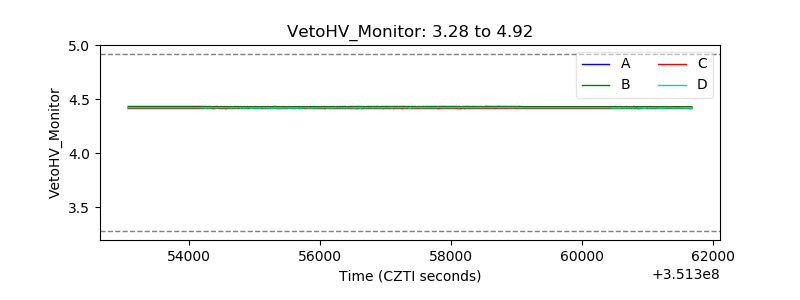 |
| Veto LLD | 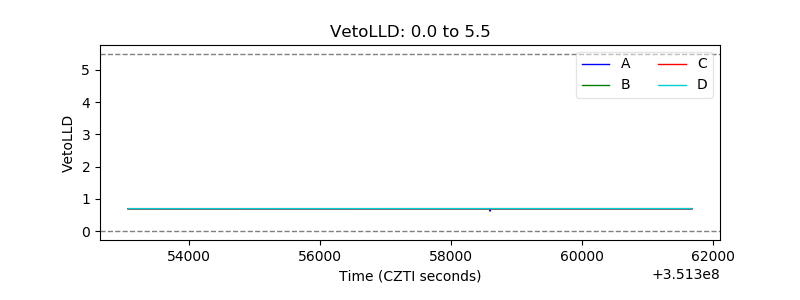 |
| Alpha Counter | 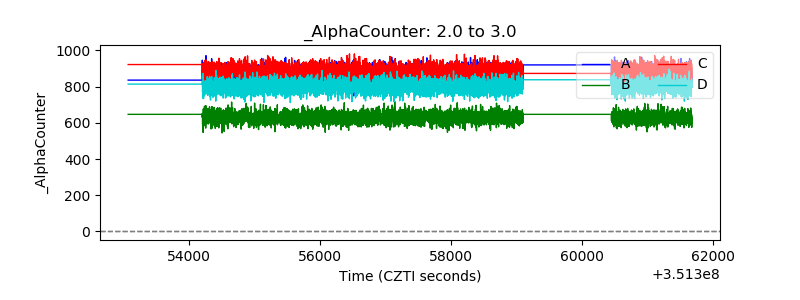 |
| _CPM_Rate |  |
| CZT Counter | 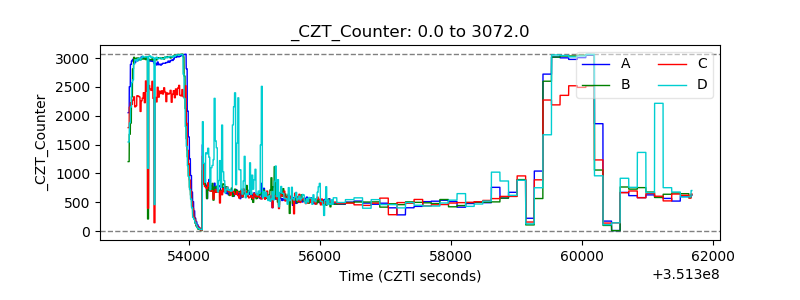 |
| +2.5 Volts monitor | 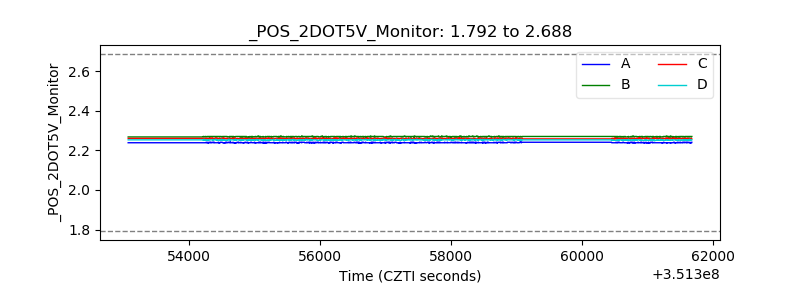 |
| +5 Volts monitor | 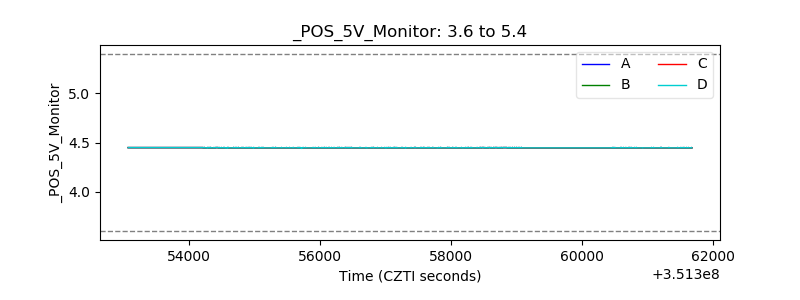 |
| _ROLL_ROT | 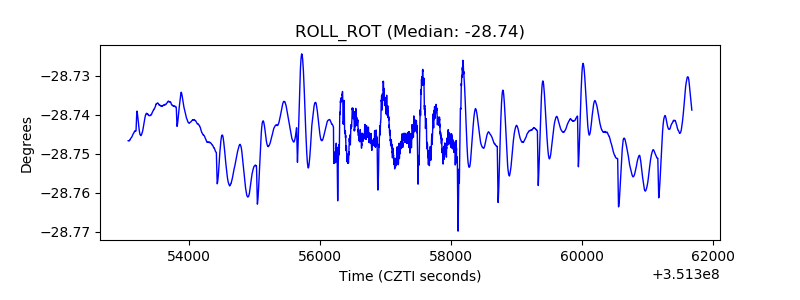 |
| _Roll_DEC |  |
| _Roll_RA | 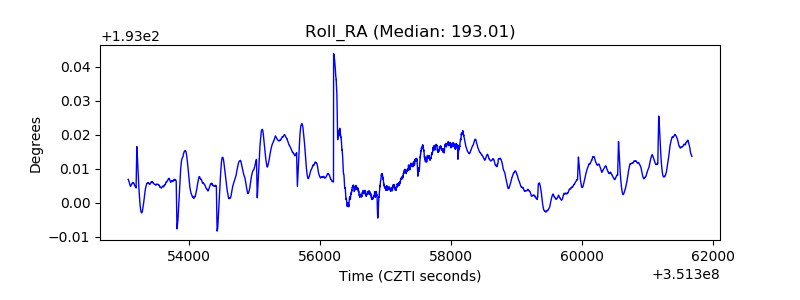 |
| Veto Counter | 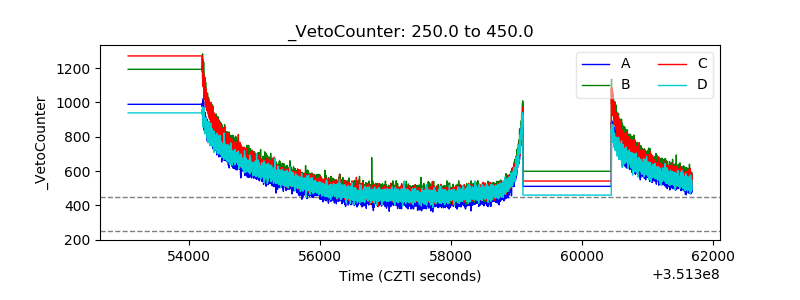 |