| Param | Original file | Final file |
|---|---|---|
| Filename | modeM0/AS1A10_099T01_9000004184_29168cztM0_level2.evt | modeM0/AS1A10_099T01_9000004184_29168cztM0_level2_quad_clean.evt |
| Size (bytes) | 504,976,320 | 97,312,320 |
| Size | 481.6 MB | 92.8 MB |
| Events in quadrant A | 3,394,849 | 643,612 |
| Events in quadrant B | 3,559,137 | 657,635 |
| Events in quadrant C | 3,709,150 | 613,562 |
| Events in quadrant D | 4,205,359 | 595,175 |
| Mode M9 | |||
|---|---|---|---|
| Quadrant | BADHDUFLAG | Total packets | Discarded packets |
| A | 0 | 20 | 0 |
| B | 0 | 21 | 0 |
| C | 0 | 21 | 0 |
| D | 0 | 21 | 0 |
| Mode SS | |||
|---|---|---|---|
| Quadrant | BADHDUFLAG | Total packets | Discarded packets |
| A | 0 | 128 | 0 |
| B | 0 | 128 | 0 |
| C | 0 | 128 | 0 |
| D | 0 | 128 | 0 |
| Mode M0 | |||
|---|---|---|---|
| Quadrant | BADHDUFLAG | Total packets | Discarded packets |
| A | 0 | 14005 | 2 |
| B | 0 | 14620 | 2 |
| C | 0 | 15181 | 2 |
| D | 0 | 16696 | 2 |
| Quadrant | Total seconds | Saturated seconds | Saturation percentage |
|---|---|---|---|
| A | 6260 | 65 | 1.038339% |
| B | 6260 | 110 | 1.757188% |
| C | 6260 | 174 | 2.779553% |
| D | 6260 | 207 | 3.306709% |
Noise dominated data is calculated using 1-second bins in cleaned event files. If a bin has >2000 counts, and if more than 50% of those come from <1% of pixels, then it is considered to be noise-dominated and hence unusable.
| Quadrant | # 1 sec bins | Bins with >0 counts | Bins with >2000 counts | High rate bins dominated by noise | Noise dominated (total time) | Noise dominated (detector-on time) | Marked lightcurve |
|---|---|---|---|---|---|---|---|
| A | 7630 | 6261 | 0 | 0 | 0.00% | 0.00% | 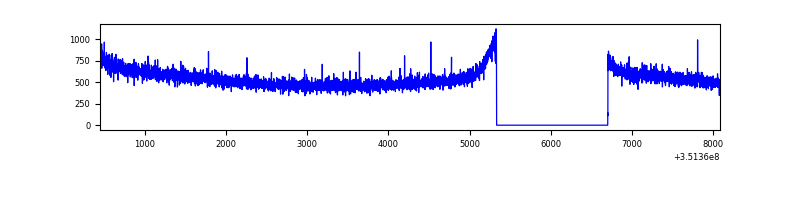 |
| B | 7630 | 6261 | 11 | 11 | 0.14% | 0.18% | 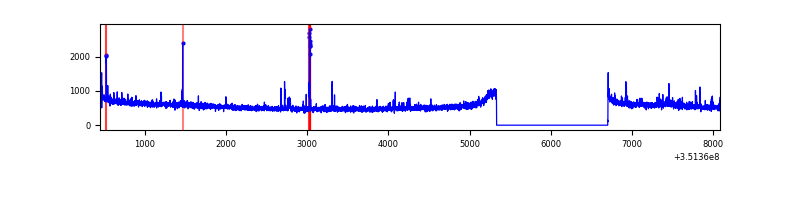 |
| C | 7630 | 6261 | 0 | 0 | 0.00% | 0.00% | 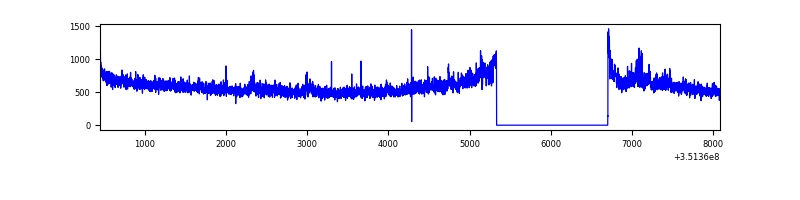 |
| D | 7630 | 6261 | 140 | 140 | 1.83% | 2.24% | 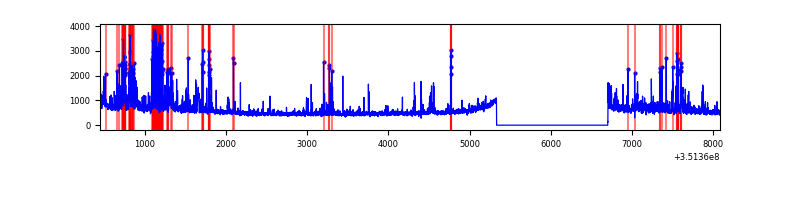 |
Top three noisy pixels from each quadrant. If the there are fewer than three noisy pixels in the level2.evt file, extra rows are filled as -1
| Pixel properties | Quadrant properties | ||||||
|---|---|---|---|---|---|---|---|
| Quadrant | DetID | PixID | Counts | Sigma | Mean | Median | Sigma |
| A | 13 | 254 | 11369 | 60.15 | 880 | 866 | 174.6 |
| A | 3 | 137 | 8068 | 41.25 | 880 | 866 | 174.6 |
| A | 0 | 226 | 7621 | 38.69 | 880 | 866 | 174.6 |
| B | 0 | 183 | 63871 | 382.78 | 874 | 853 | 164.6 |
| B | 10 | 245 | 27039 | 159.06 | 874 | 853 | 164.6 |
| B | 12 | 111 | 19338 | 112.28 | 874 | 853 | 164.6 |
| C | 3 | 233 | 289855 | 1501.95 | 830 | 837 | 192.4 |
| C | 14 | 238 | 148623 | 768.0 | 830 | 837 | 192.4 |
| C | 14 | 254 | 19983 | 99.5 | 830 | 837 | 192.4 |
| D | 1 | 52 | 790440 | 4080.17 | 820 | 799 | 193.5 |
| D | 8 | 195 | 261762 | 1348.43 | 820 | 799 | 193.5 |
| D | 2 | 234 | 27270 | 136.78 | 820 | 799 | 193.5 |
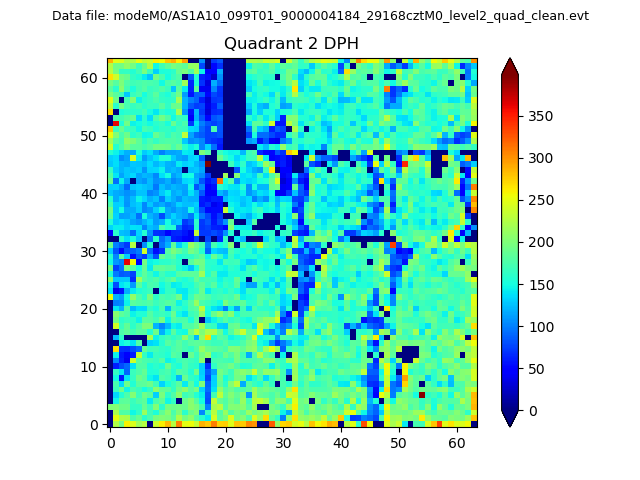
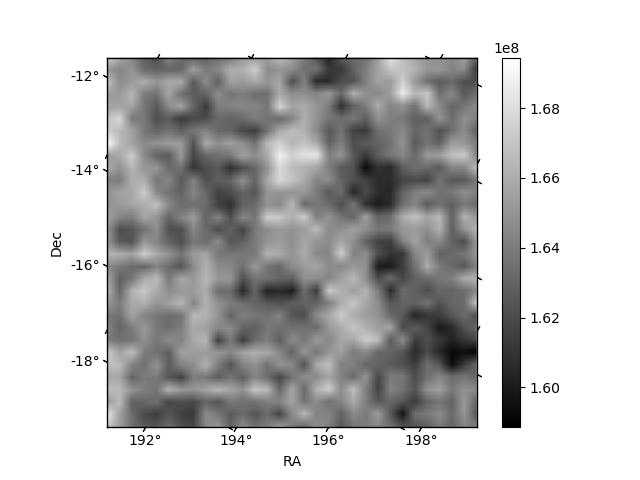
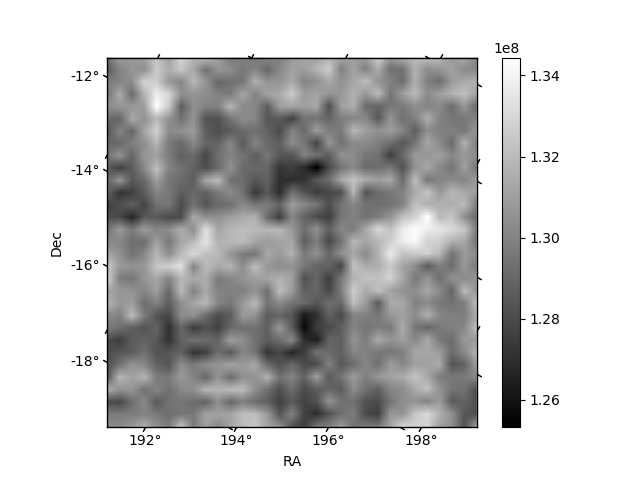
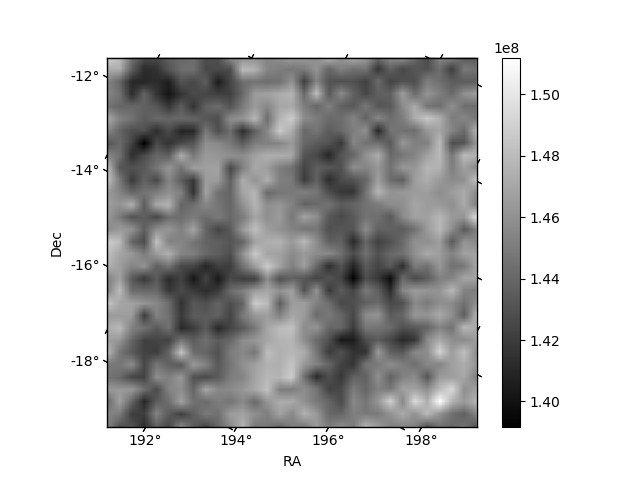
Histogram calculated using DETX and DETY for each event in the final _common_clean file
| Quadrant A | 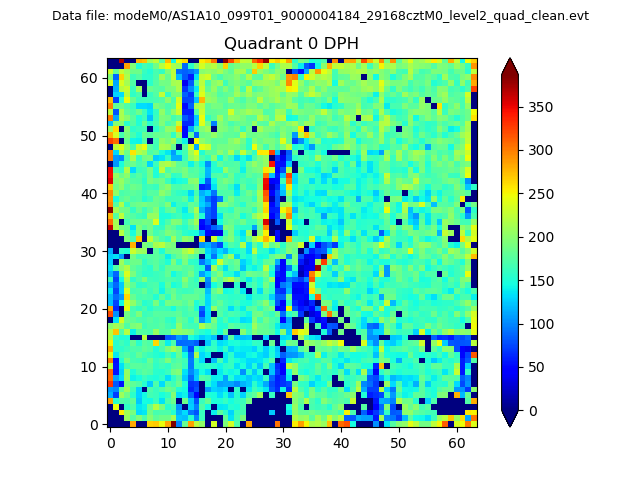 |
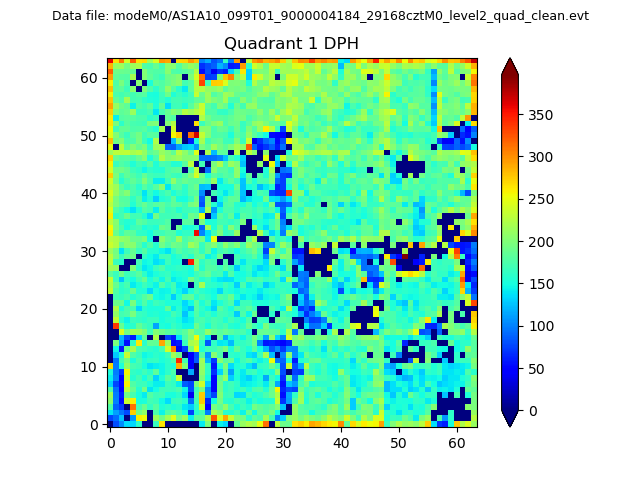 |
Quadrant B |
|---|---|---|---|
| Quadrant D | 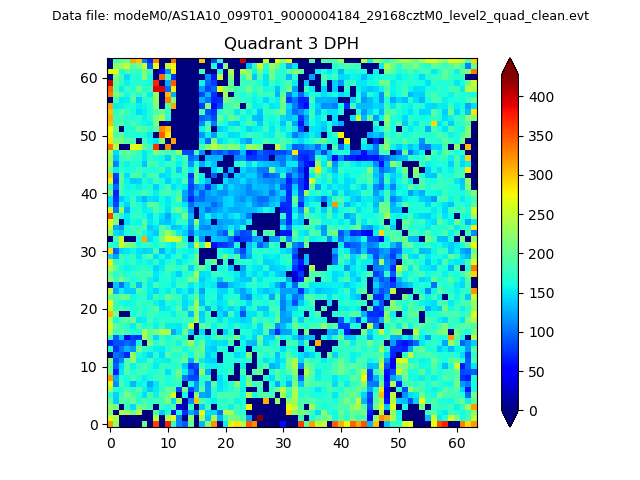 |
 |
Quadrant C |
| Plot type | Count rate plots | Images |
|---|---|---|
| Comparison with Poisson distribution Blue bars denote a histogram of data divided into 1 sec bins. Red curve is a Poisson curve with rate = median count rate of data. |
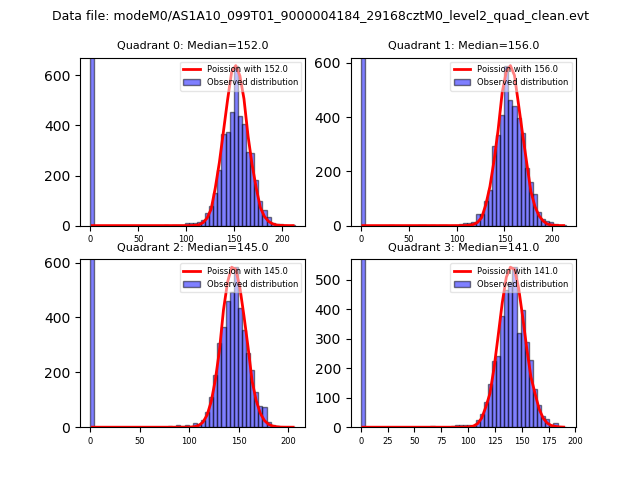 |
 |
| Quadrant-wise count rates Data is divided into 100 sec bins |
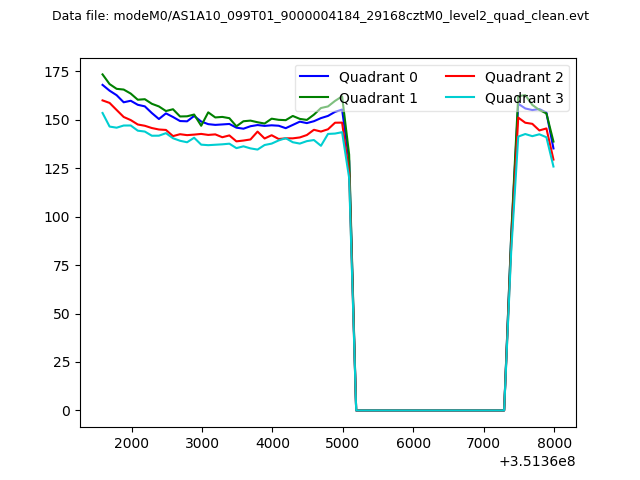 |
|
| Module-wise count rates for Quadrant A Data is divided into 100 sec bins |
 |
 |
| Module-wise count rates for Quadrant B Data is divided into 100 sec bins |
 |
 |
| Module-wise count rates for Quadrant C Data is divided into 100 sec bins |
 |
 |
| Module-wise count rates for Quadrant D Data is divided into 100 sec bins |
 |
 |
| Parameter | Plot |
|---|---|
| CZT HV Monitor |  |
| D_VDD | 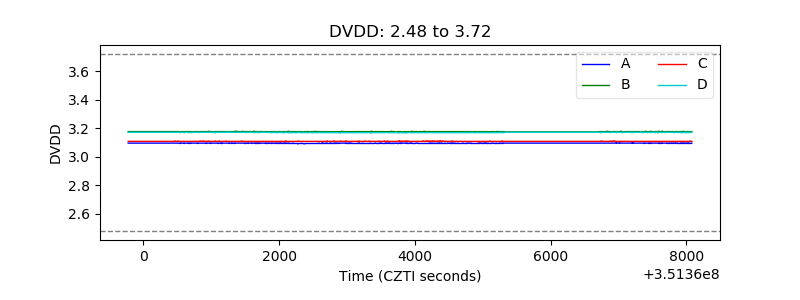 |
| Temperature 1 | 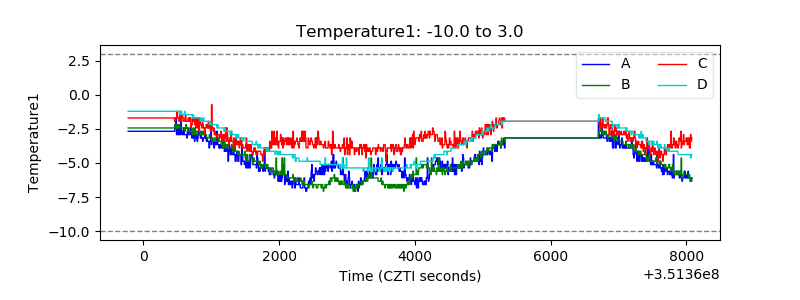 |
| Veto HV Monitor | 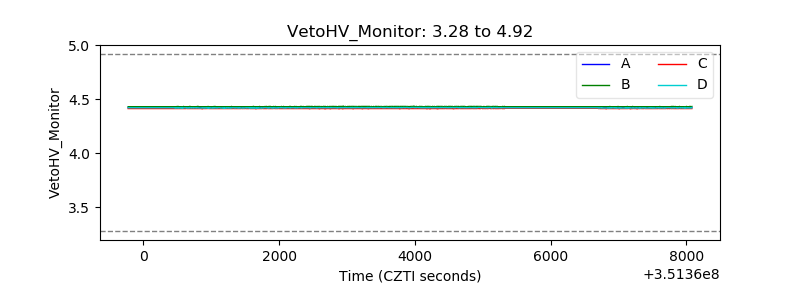 |
| Veto LLD |  |
| Alpha Counter | 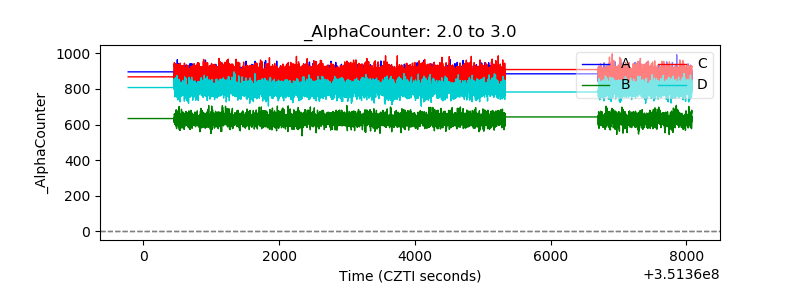 |
| _CPM_Rate | 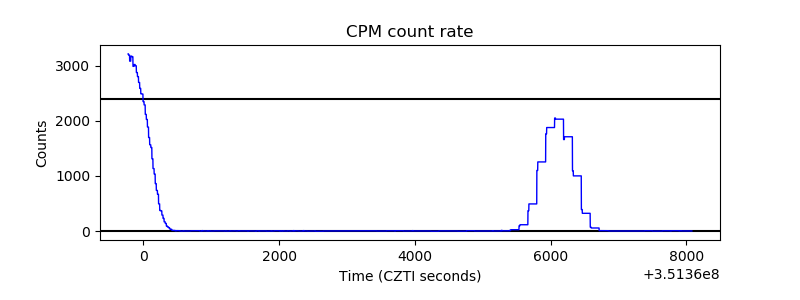 |
| CZT Counter | 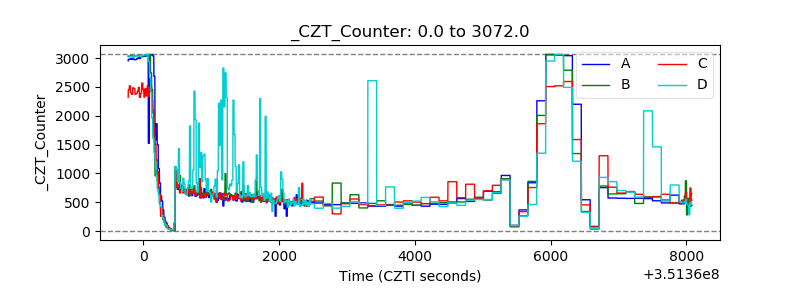 |
| +2.5 Volts monitor |  |
| +5 Volts monitor | 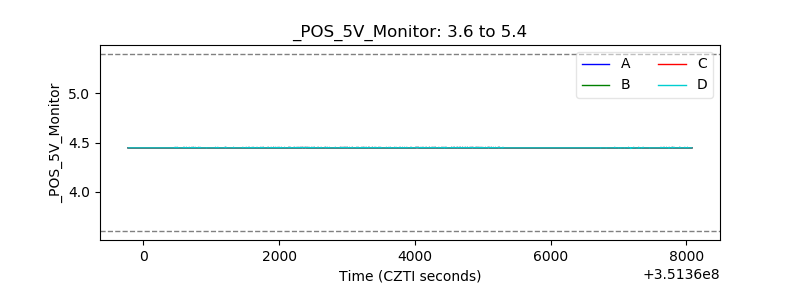 |
| _ROLL_ROT |  |
| _Roll_DEC | 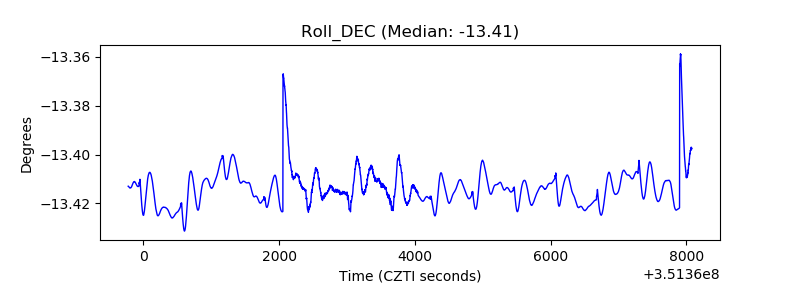 |
| _Roll_RA | 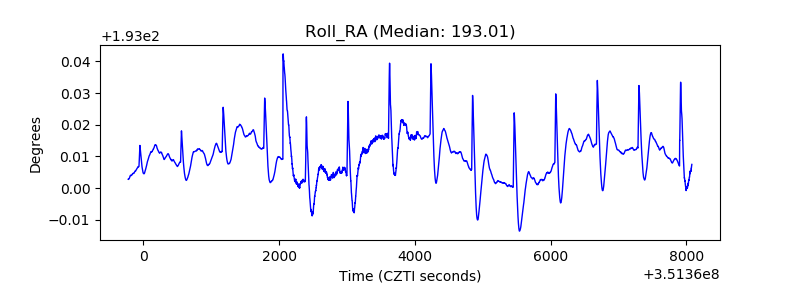 |
| Veto Counter |  |