| Param | Original file | Final file |
|---|---|---|
| Filename | modeM0/AS1A10_099T01_9000004184_29169cztM0_level2.evt | modeM0/AS1A10_099T01_9000004184_29169cztM0_level2_quad_clean.evt |
| Size (bytes) | 545,411,520 | 103,340,160 |
| Size | 520.1 MB | 98.6 MB |
| Events in quadrant A | 3,552,831 | 681,139 |
| Events in quadrant B | 3,752,496 | 695,275 |
| Events in quadrant C | 3,763,376 | 653,699 |
| Events in quadrant D | 4,988,104 | 625,937 |
| Mode M9 | |||
|---|---|---|---|
| Quadrant | BADHDUFLAG | Total packets | Discarded packets |
| A | 0 | 25 | 0 |
| B | 0 | 25 | 0 |
| C | 0 | 25 | 0 |
| D | 0 | 25 | 0 |
| Mode SS | |||
|---|---|---|---|
| Quadrant | BADHDUFLAG | Total packets | Discarded packets |
| A | 0 | 140 | 0 |
| B | 0 | 140 | 0 |
| C | 0 | 140 | 0 |
| D | 0 | 140 | 0 |
| Mode M0 | |||
|---|---|---|---|
| Quadrant | BADHDUFLAG | Total packets | Discarded packets |
| A | 0 | 14813 | 2 |
| B | 0 | 15494 | 2 |
| C | 0 | 15465 | 2 |
| D | 0 | 19611 | 2 |
| Quadrant | Total seconds | Saturated seconds | Saturation percentage |
|---|---|---|---|
| A | 6796 | 116 | 1.706886% |
| B | 6796 | 168 | 2.472042% |
| C | 6797 | 218 | 3.207297% |
| D | 6797 | 331 | 4.869795% |
Noise dominated data is calculated using 1-second bins in cleaned event files. If a bin has >2000 counts, and if more than 50% of those come from <1% of pixels, then it is considered to be noise-dominated and hence unusable.
| Quadrant | # 1 sec bins | Bins with >0 counts | Bins with >2000 counts | High rate bins dominated by noise | Noise dominated (total time) | Noise dominated (detector-on time) | Marked lightcurve |
|---|---|---|---|---|---|---|---|
| A | 9281 | 6798 | 0 | 0 | 0.00% | 0.00% | 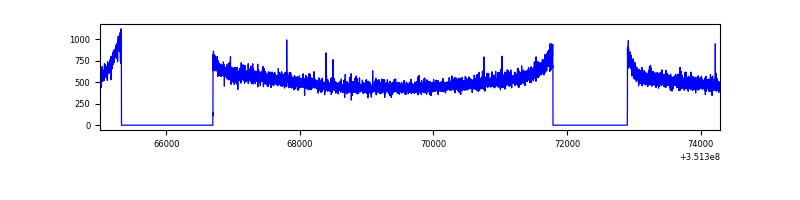 |
| B | 9281 | 6798 | 1 | 1 | 0.01% | 0.01% | 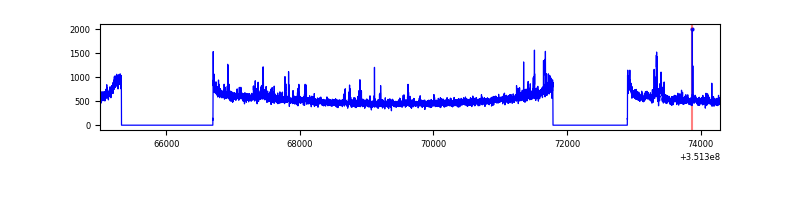 |
| C | 9282 | 6799 | 0 | 0 | 0.00% | 0.00% | 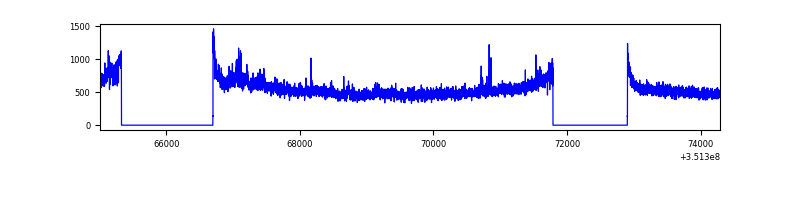 |
| D | 9282 | 6799 | 169 | 169 | 1.82% | 2.49% | 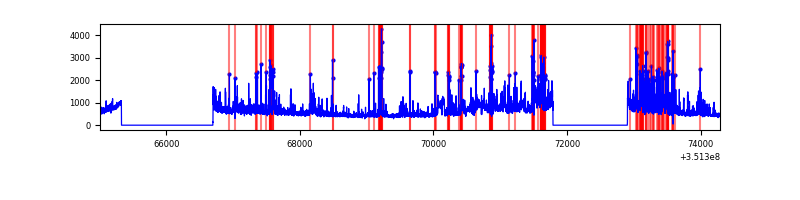 |
Top three noisy pixels from each quadrant. If the there are fewer than three noisy pixels in the level2.evt file, extra rows are filled as -1
| Pixel properties | Quadrant properties | ||||||
|---|---|---|---|---|---|---|---|
| Quadrant | DetID | PixID | Counts | Sigma | Mean | Median | Sigma |
| A | 13 | 254 | 12538 | 63.17 | 919 | 903 | 184.2 |
| A | 3 | 137 | 9012 | 44.03 | 919 | 903 | 184.2 |
| A | 0 | 226 | 7755 | 37.2 | 919 | 903 | 184.2 |
| B | 0 | 183 | 66430 | 374.55 | 915 | 892 | 175.0 |
| B | 10 | 246 | 54465 | 306.17 | 915 | 892 | 175.0 |
| B | 12 | 111 | 21229 | 116.23 | 915 | 892 | 175.0 |
| C | 3 | 233 | 163014 | 796.25 | 872 | 881 | 203.6 |
| C | 14 | 238 | 153859 | 751.29 | 872 | 881 | 203.6 |
| C | 14 | 254 | 21078 | 99.19 | 872 | 881 | 203.6 |
| D | 1 | 52 | 1296681 | 6270.66 | 863 | 840 | 206.7 |
| D | 8 | 195 | 263533 | 1271.19 | 863 | 840 | 206.7 |
| D | 13 | 104 | 61618 | 294.11 | 863 | 840 | 206.7 |
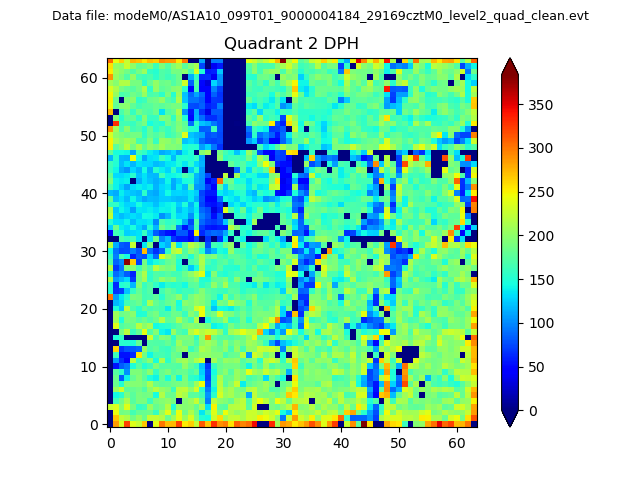
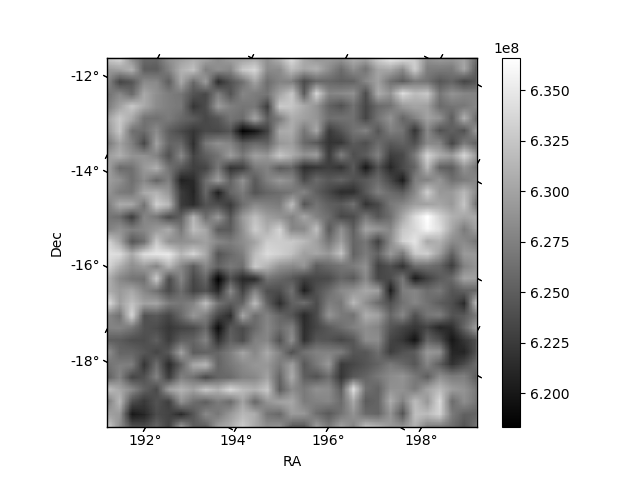
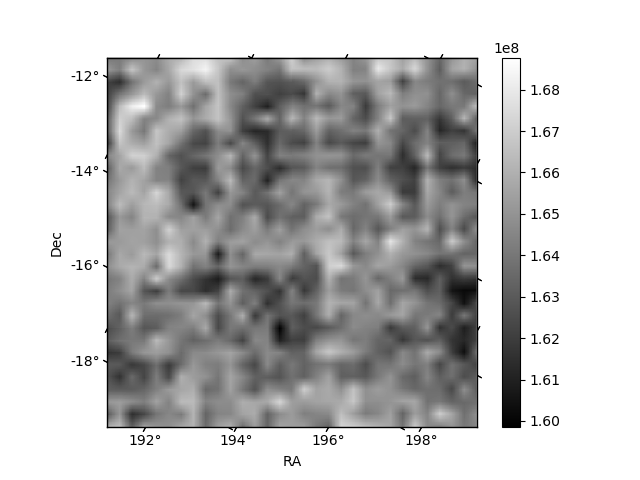
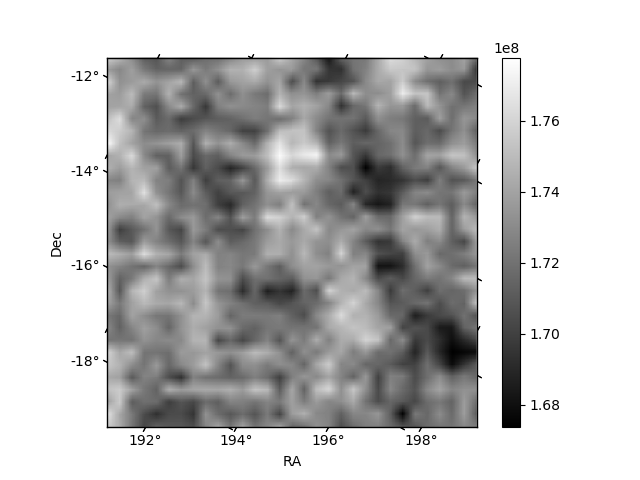
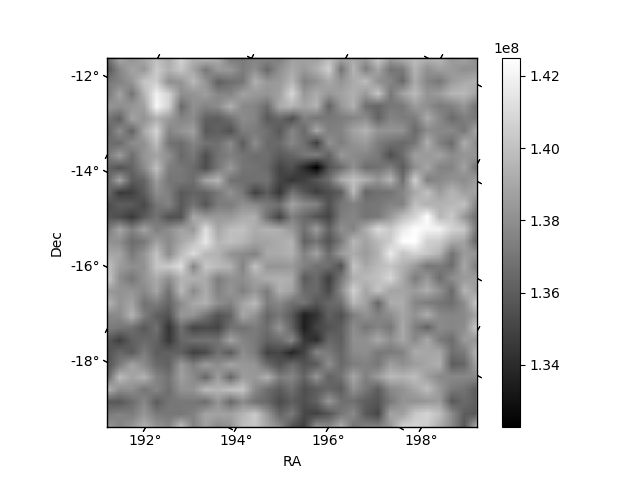
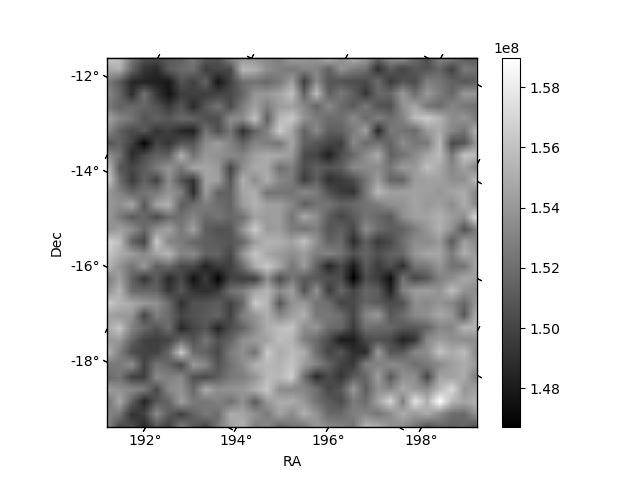
Histogram calculated using DETX and DETY for each event in the final _common_clean file
| Quadrant A | 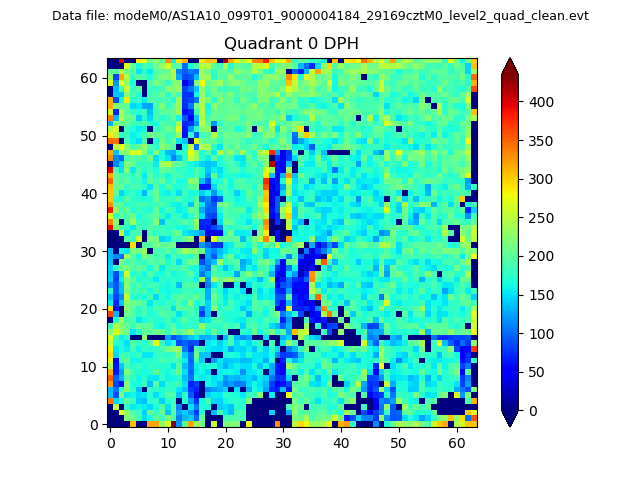 |
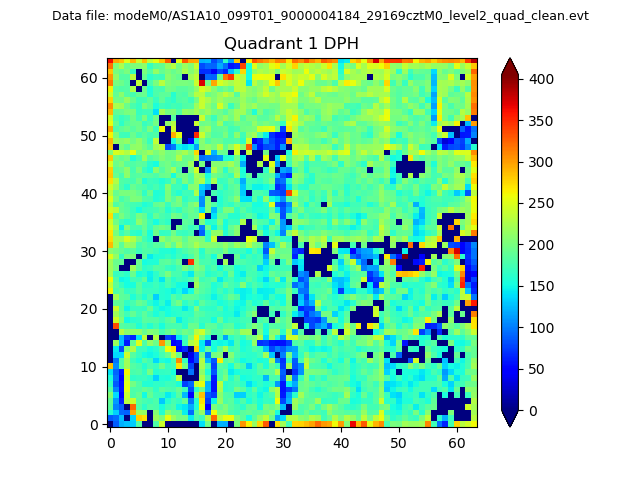 |
Quadrant B |
|---|---|---|---|
| Quadrant D | 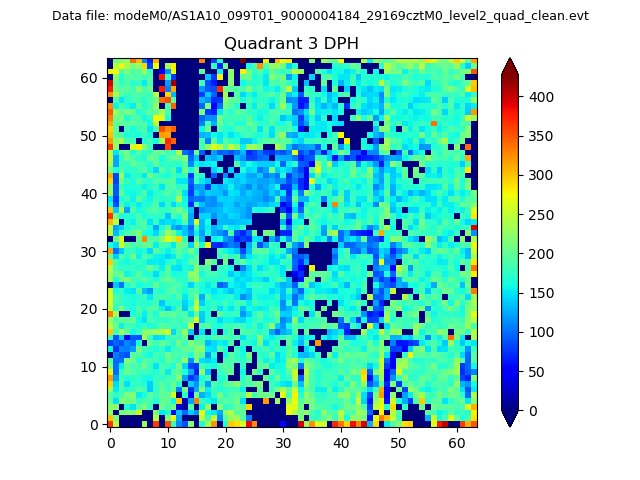 |
 |
Quadrant C |
| Plot type | Count rate plots | Images |
|---|---|---|
| Comparison with Poisson distribution Blue bars denote a histogram of data divided into 1 sec bins. Red curve is a Poisson curve with rate = median count rate of data. |
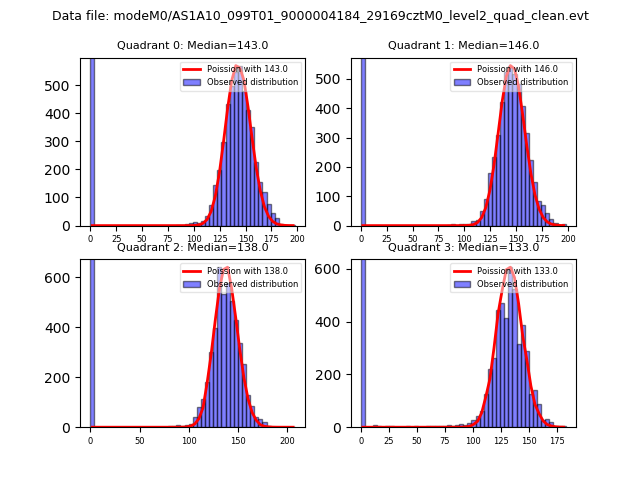 |
 |
| Quadrant-wise count rates Data is divided into 100 sec bins |
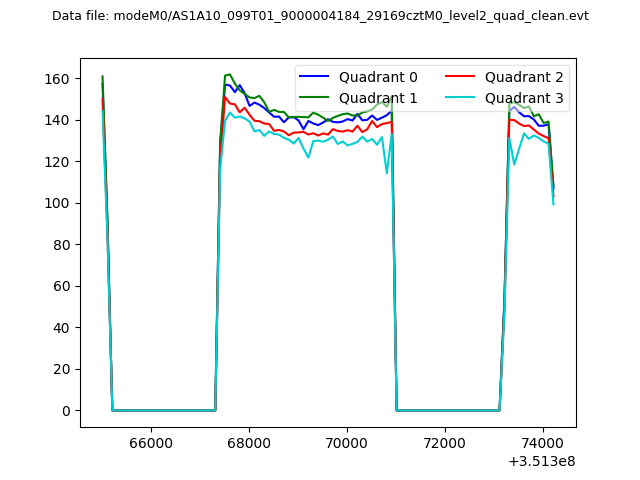 |
|
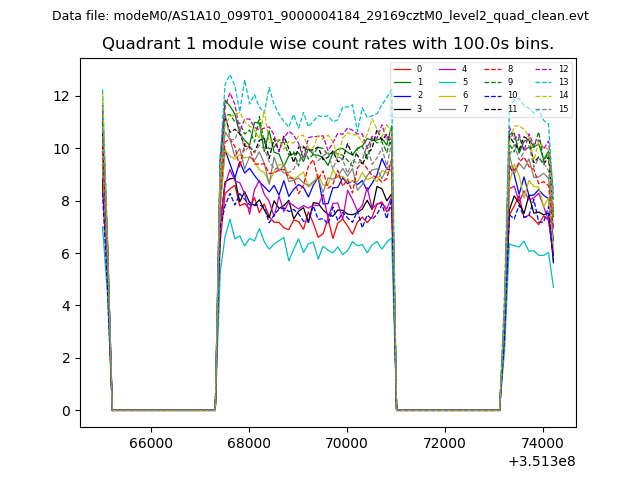
| Module-wise count rates for Quadrant A Data is divided into 100 sec bins |
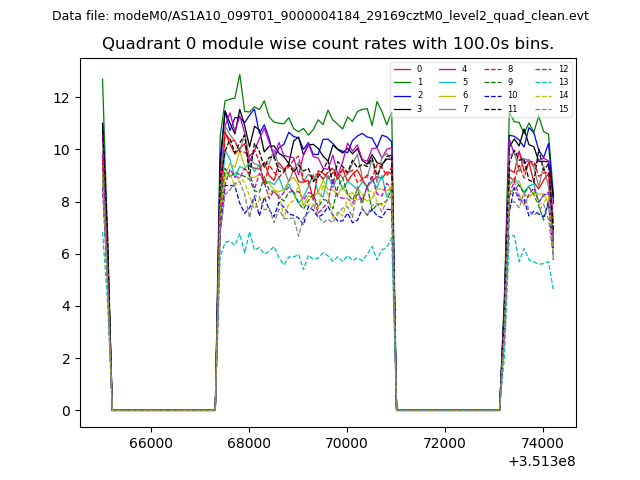 |
 |
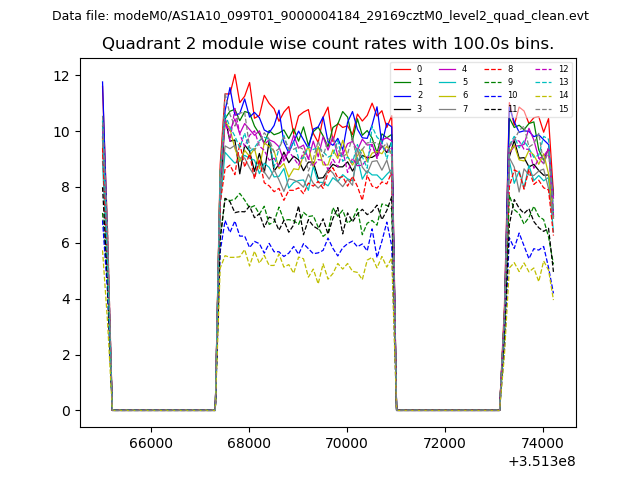
| Module-wise count rates for Quadrant B Data is divided into 100 sec bins |
 |
 |
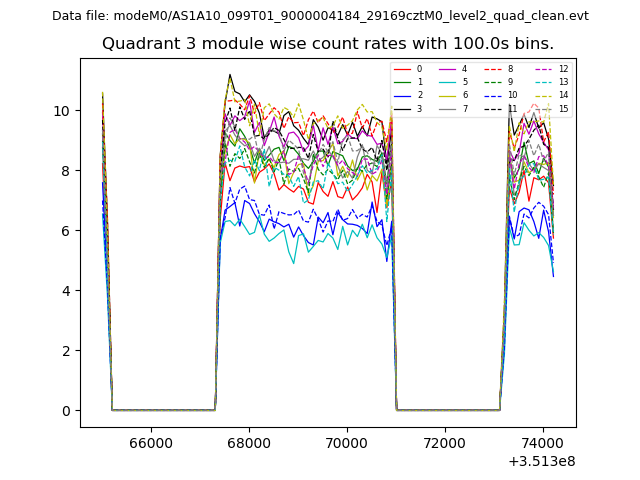
| Module-wise count rates for Quadrant C Data is divided into 100 sec bins |
 |
 |
| Module-wise count rates for Quadrant D Data is divided into 100 sec bins |
 |
 |
| Parameter | Plot |
|---|---|
| CZT HV Monitor | 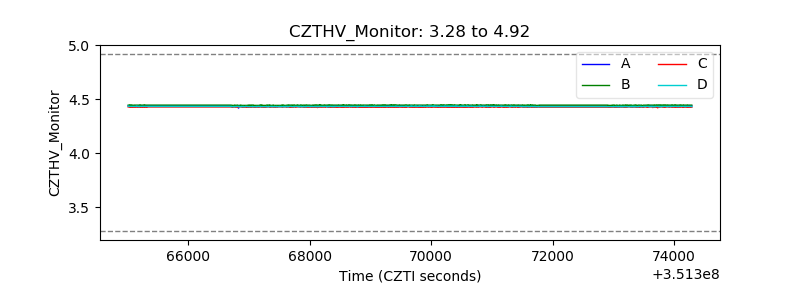 |
| D_VDD | 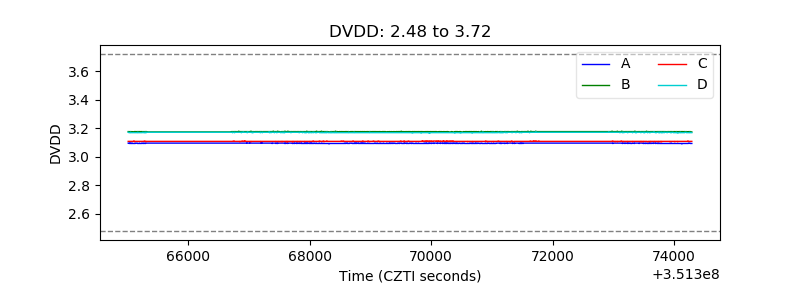 |
| Temperature 1 | 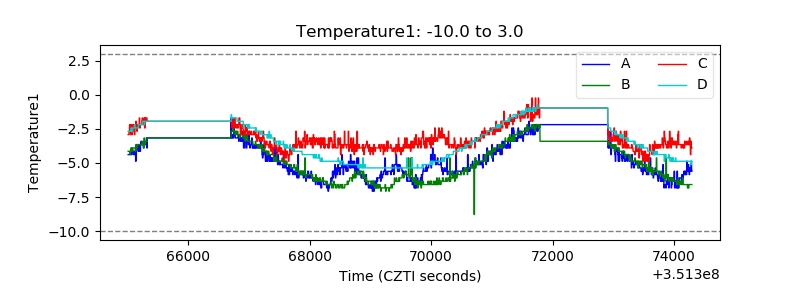 |
| Veto HV Monitor | 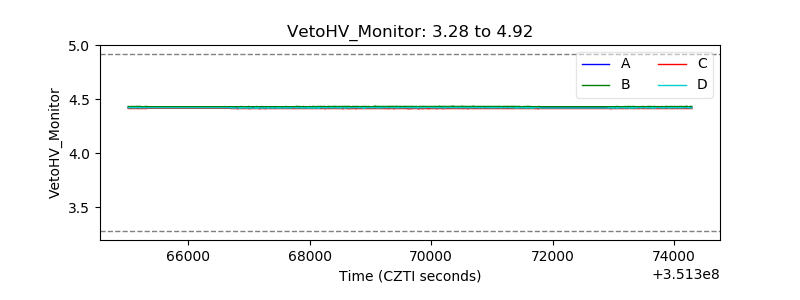 |
| Veto LLD | 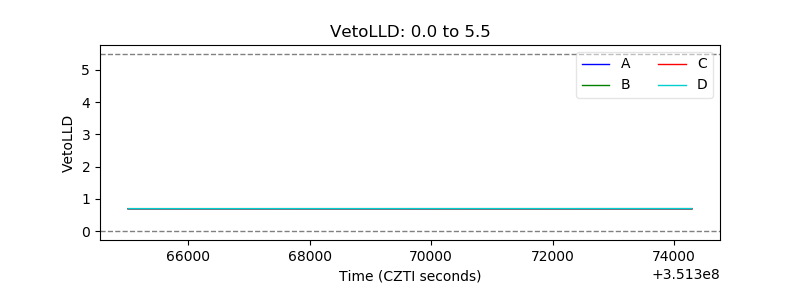 |
| Alpha Counter | 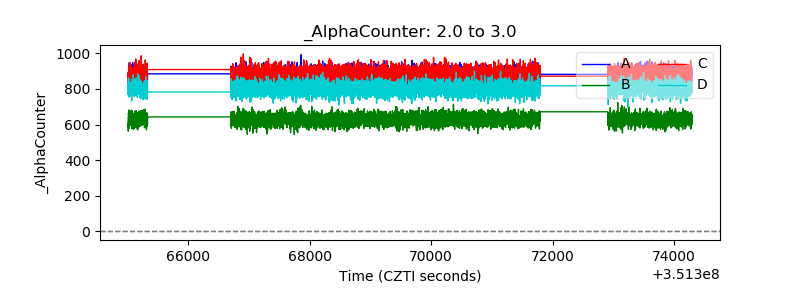 |
| _CPM_Rate | 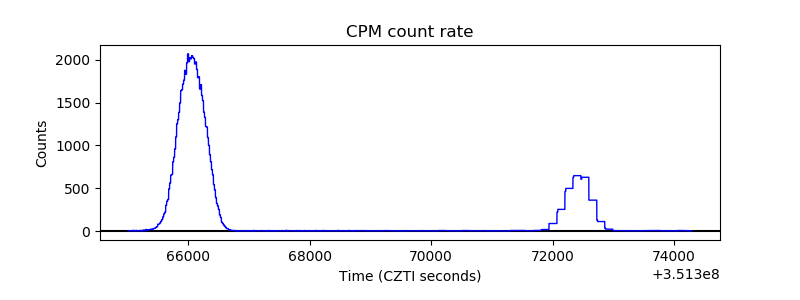 |
| CZT Counter | 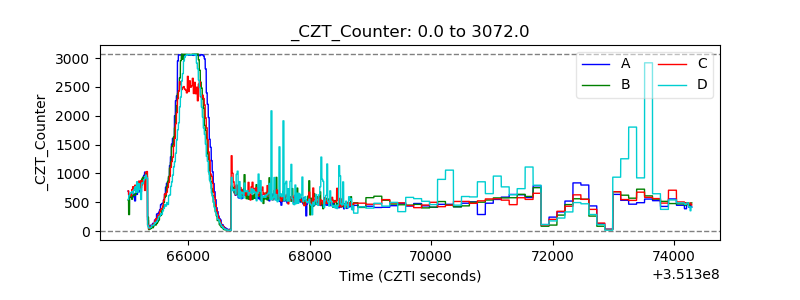 |
| +2.5 Volts monitor |  |
| +5 Volts monitor | 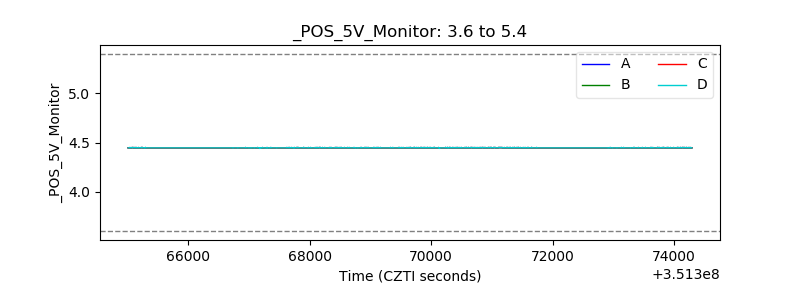 |
| _ROLL_ROT | 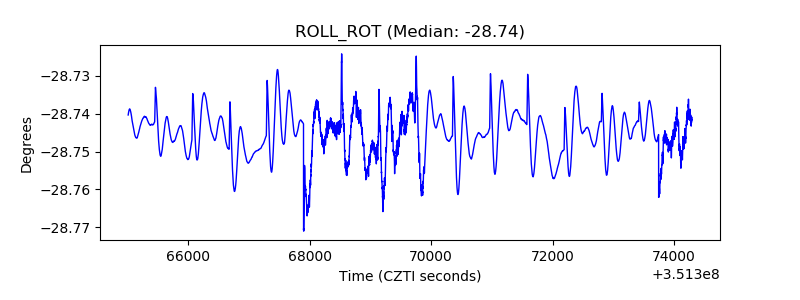 |
| _Roll_DEC | 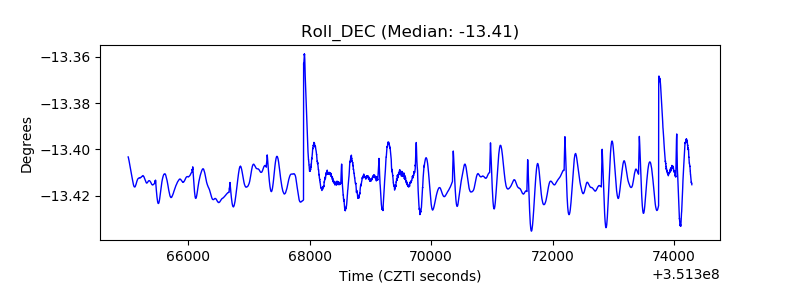 |
| _Roll_RA | 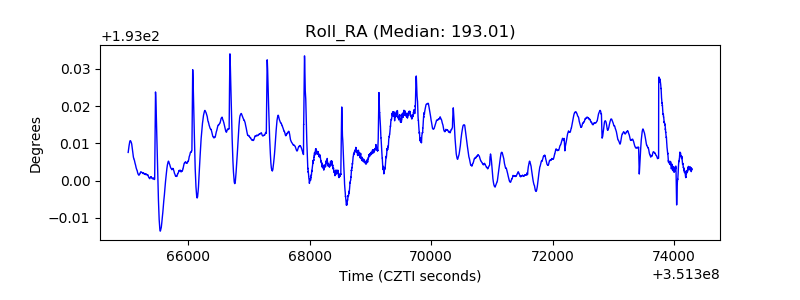 |
| Veto Counter | 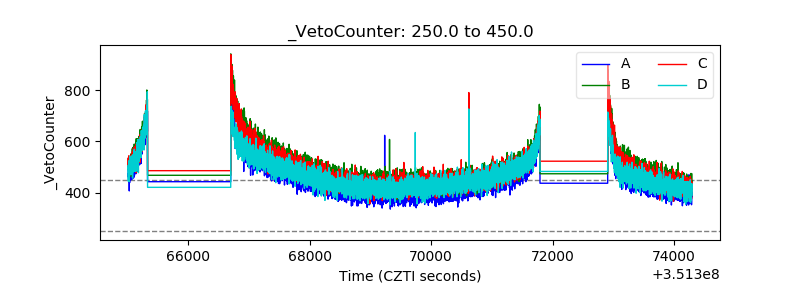 |