| Param | Original file | Final file |
|---|---|---|
| Filename | modeM0/AS1A10_099T01_9000004184_29170cztM0_level2.evt | modeM0/AS1A10_099T01_9000004184_29170cztM0_level2_quad_clean.evt |
| Size (bytes) | 518,425,920 | 101,880,000 |
| Size | 494.4 MB | 97.2 MB |
| Events in quadrant A | 3,408,989 | 664,821 |
| Events in quadrant B | 3,705,738 | 677,011 |
| Events in quadrant C | 3,452,288 | 642,093 |
| Events in quadrant D | 4,665,356 | 621,113 |
| Mode M9 | |||
|---|---|---|---|
| Quadrant | BADHDUFLAG | Total packets | Discarded packets |
| A | 0 | 18 | 0 |
| B | 0 | 18 | 0 |
| C | 0 | 18 | 0 |
| D | 0 | 18 | 0 |
| Mode SS | |||
|---|---|---|---|
| Quadrant | BADHDUFLAG | Total packets | Discarded packets |
| A | 0 | 142 | 0 |
| B | 0 | 142 | 0 |
| C | 0 | 142 | 0 |
| D | 0 | 142 | 0 |
| Mode M0 | |||
|---|---|---|---|
| Quadrant | BADHDUFLAG | Total packets | Discarded packets |
| A | 0 | 14478 | 2 |
| B | 0 | 15382 | 2 |
| C | 0 | 14510 | 2 |
| D | 0 | 18642 | 2 |
| Quadrant | Total seconds | Saturated seconds | Saturation percentage |
|---|---|---|---|
| A | 6896 | 84 | 1.218097% |
| B | 6897 | 173 | 2.508337% |
| C | 6896 | 138 | 2.001160% |
| D | 6896 | 356 | 5.162413% |
Noise dominated data is calculated using 1-second bins in cleaned event files. If a bin has >2000 counts, and if more than 50% of those come from <1% of pixels, then it is considered to be noise-dominated and hence unusable.
| Quadrant | # 1 sec bins | Bins with >0 counts | Bins with >2000 counts | High rate bins dominated by noise | Noise dominated (total time) | Noise dominated (detector-on time) | Marked lightcurve |
|---|---|---|---|---|---|---|---|
| A | 8736 | 6898 | 0 | 0 | 0.00% | 0.00% | 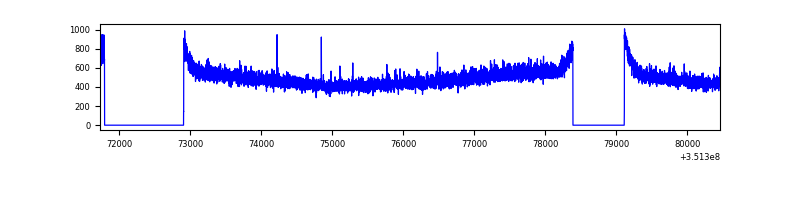 |
| B | 8737 | 6899 | 3 | 3 | 0.03% | 0.04% | 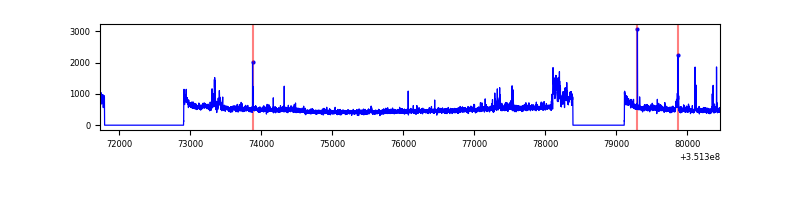 |
| C | 8736 | 6898 | 0 | 0 | 0.00% | 0.00% | 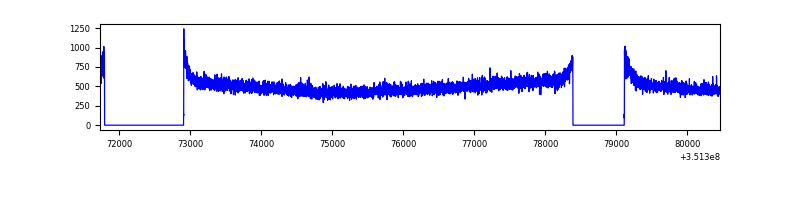 |
| D | 8736 | 6898 | 178 | 178 | 2.04% | 2.58% | 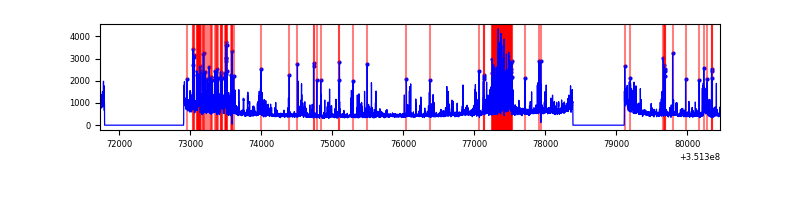 |
Top three noisy pixels from each quadrant. If the there are fewer than three noisy pixels in the level2.evt file, extra rows are filled as -1
| Pixel properties | Quadrant properties | ||||||
|---|---|---|---|---|---|---|---|
| Quadrant | DetID | PixID | Counts | Sigma | Mean | Median | Sigma |
| A | 13 | 254 | 12719 | 66.49 | 882 | 866 | 178.3 |
| A | 3 | 137 | 8859 | 44.84 | 882 | 866 | 178.3 |
| A | 0 | 226 | 7455 | 36.96 | 882 | 866 | 178.3 |
| B | 0 | 190 | 112359 | 663.13 | 876 | 854 | 168.1 |
| B | 10 | 246 | 67673 | 397.38 | 876 | 854 | 168.1 |
| B | 0 | 183 | 55196 | 323.18 | 876 | 854 | 168.1 |
| C | 14 | 238 | 137595 | 693.79 | 842 | 848 | 197.1 |
| C | 2 | 114 | 16141 | 77.59 | 842 | 848 | 197.1 |
| C | 3 | 233 | 12820 | 60.74 | 842 | 848 | 197.1 |
| D | 1 | 52 | 1173622 | 5872.88 | 832 | 810 | 199.7 |
| D | 8 | 195 | 268255 | 1339.24 | 832 | 810 | 199.7 |
| D | 2 | 250 | 35380 | 173.11 | 832 | 810 | 199.7 |
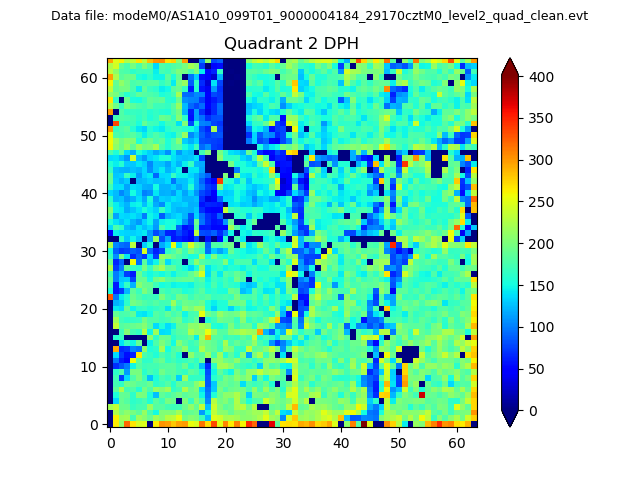
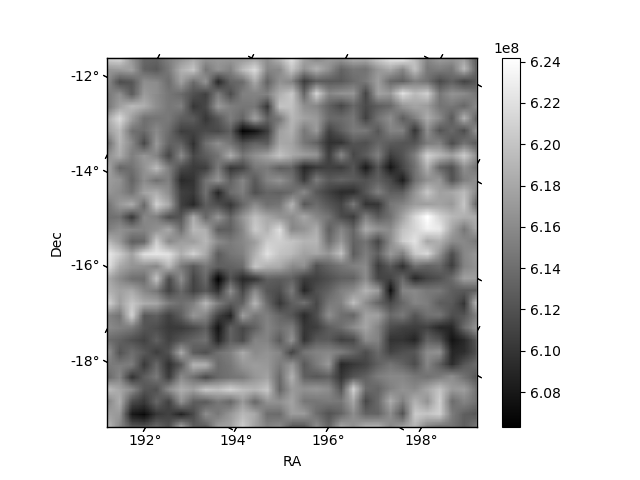
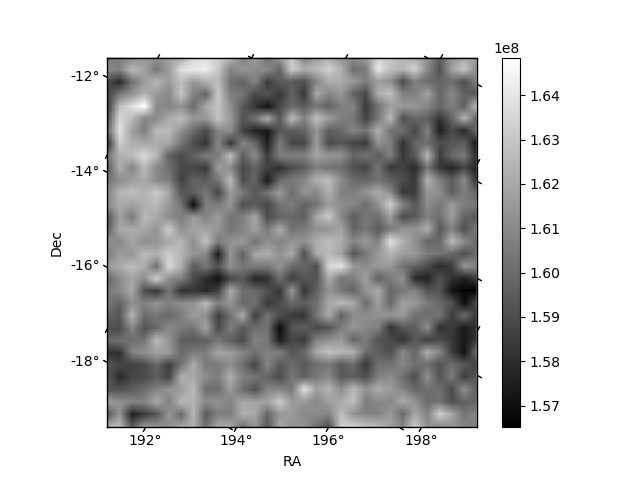
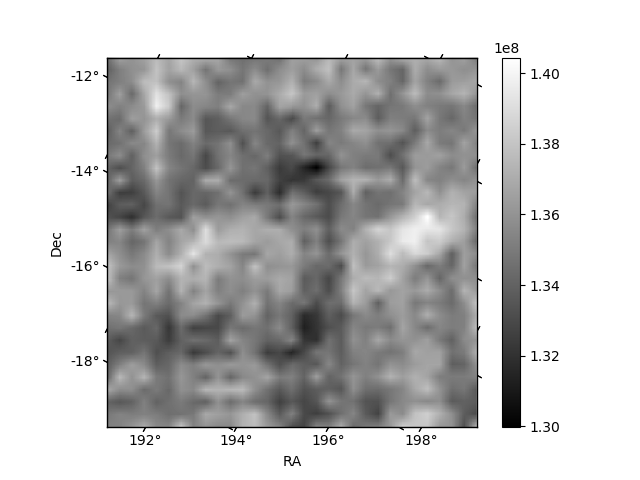
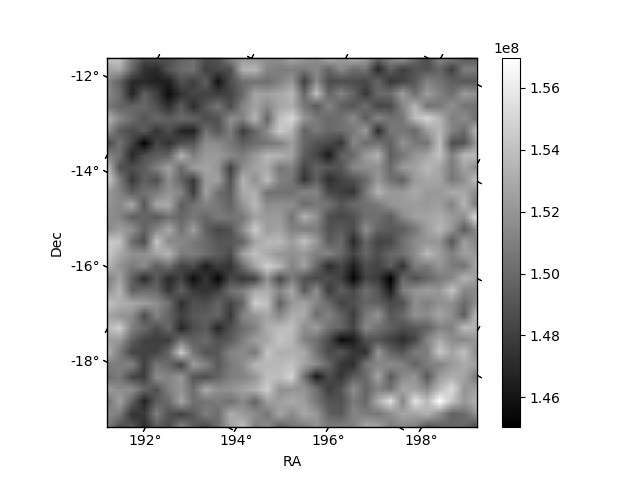
Histogram calculated using DETX and DETY for each event in the final _common_clean file
| Quadrant A | 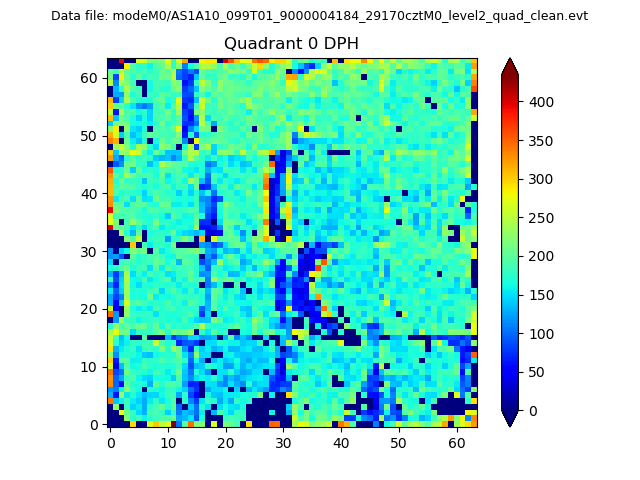 |
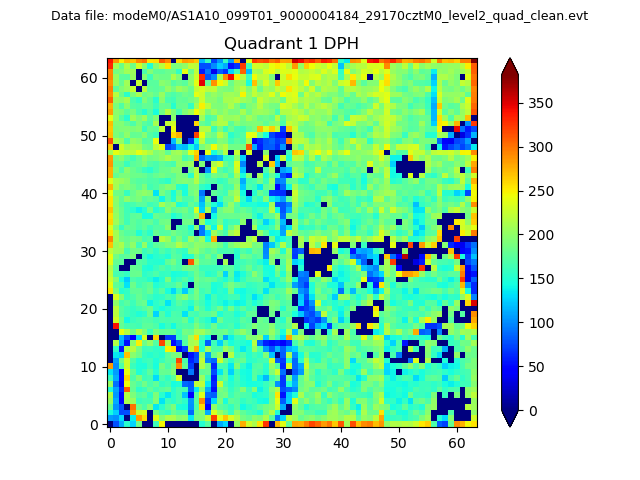 |
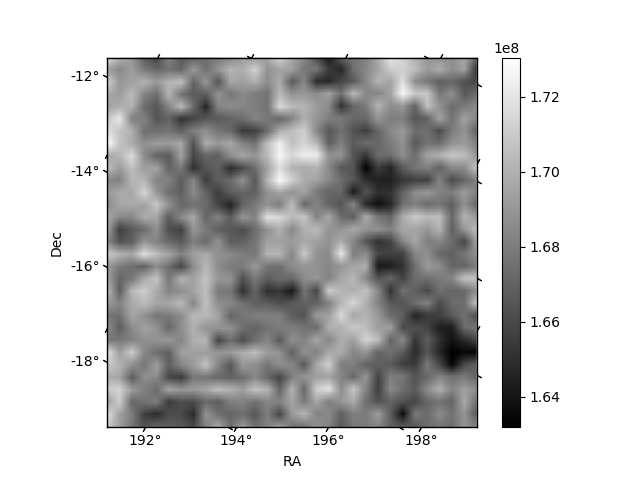
Quadrant B |
|---|---|---|---|
| Quadrant D | 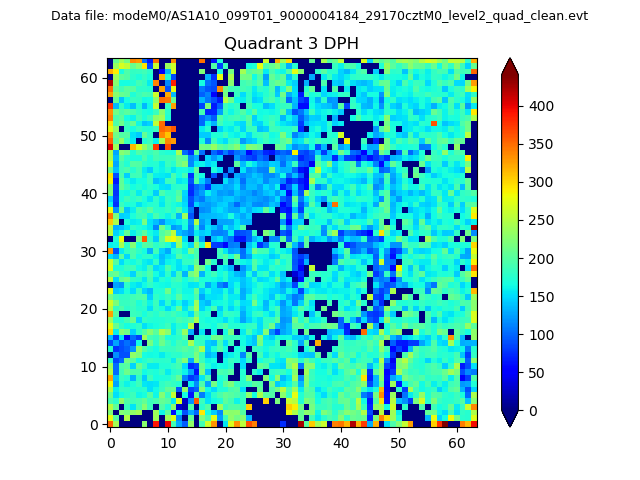 |
 |
Quadrant C |
| Plot type | Count rate plots | Images |
|---|---|---|
| Comparison with Poisson distribution Blue bars denote a histogram of data divided into 1 sec bins. Red curve is a Poisson curve with rate = median count rate of data. |
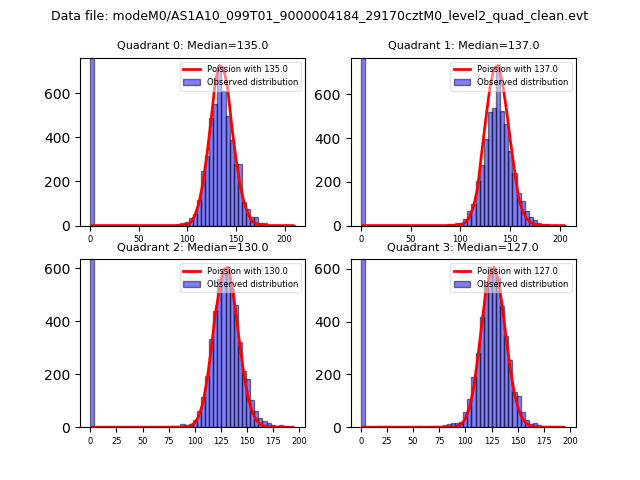 |
 |
| Quadrant-wise count rates Data is divided into 100 sec bins |
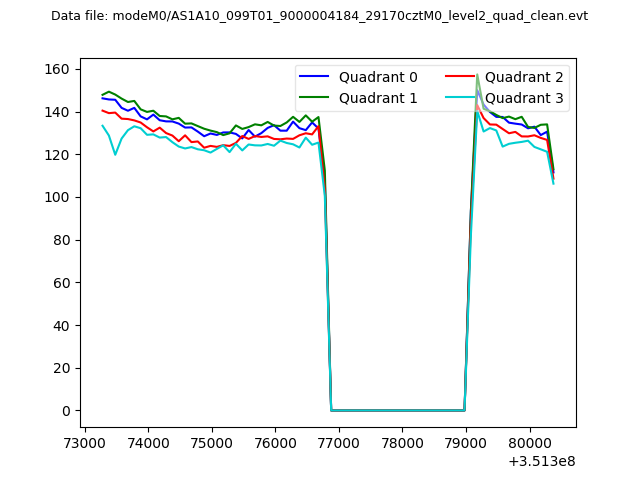 |
|
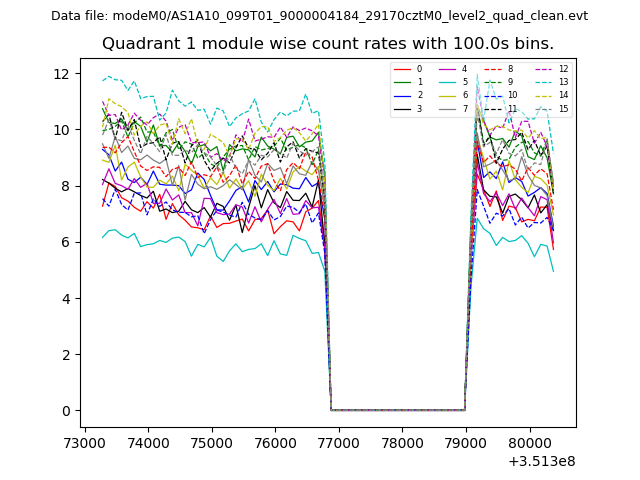
| Module-wise count rates for Quadrant A Data is divided into 100 sec bins |
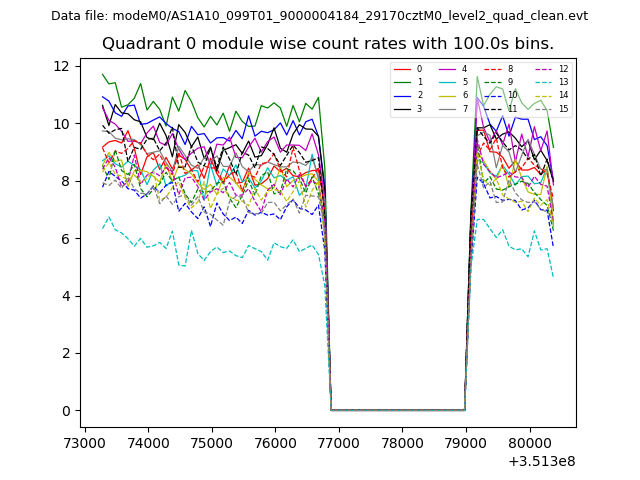 |
 |
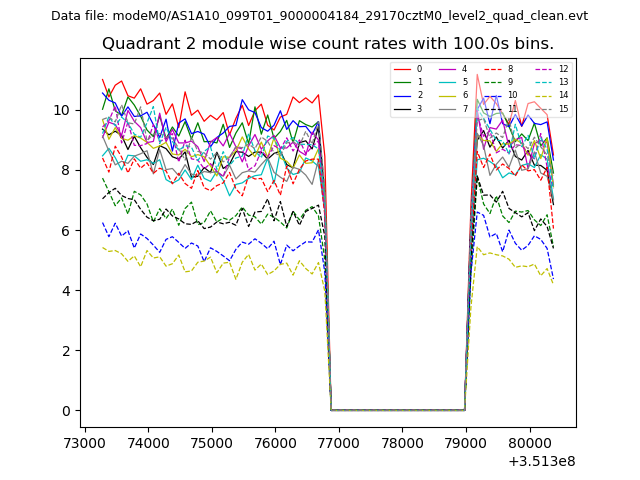
| Module-wise count rates for Quadrant B Data is divided into 100 sec bins |
 |
 |
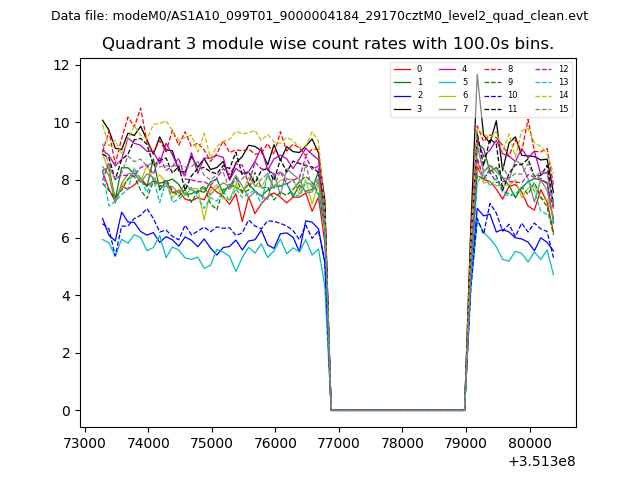
| Module-wise count rates for Quadrant C Data is divided into 100 sec bins |
 |
 |
| Module-wise count rates for Quadrant D Data is divided into 100 sec bins |
 |
 |
| Parameter | Plot |
|---|---|
| CZT HV Monitor | 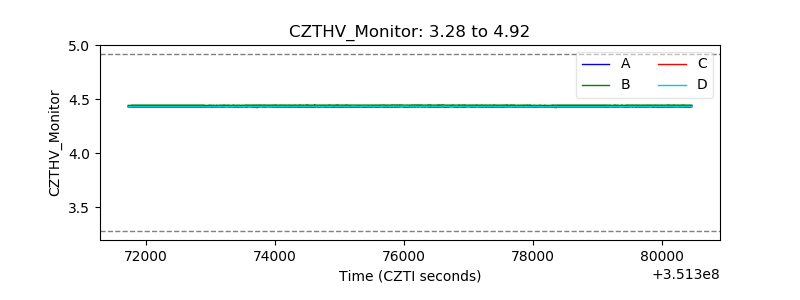 |
| D_VDD | 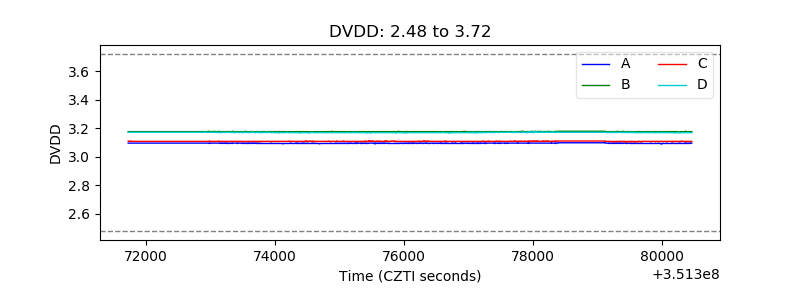 |
| Temperature 1 | 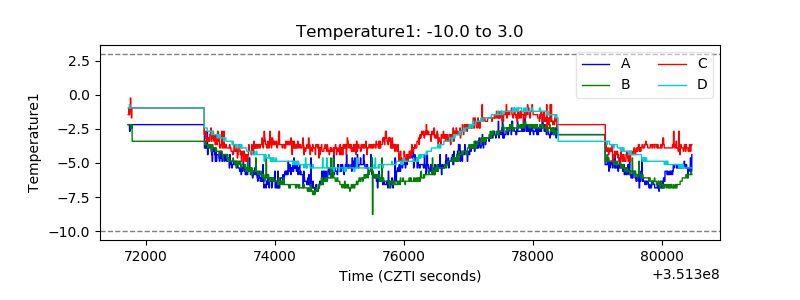 |
| Veto HV Monitor | 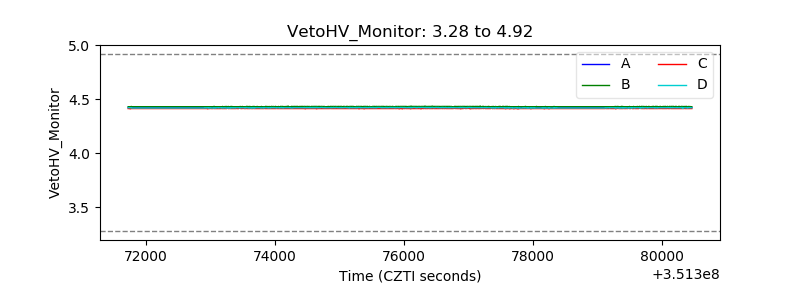 |
| Veto LLD | 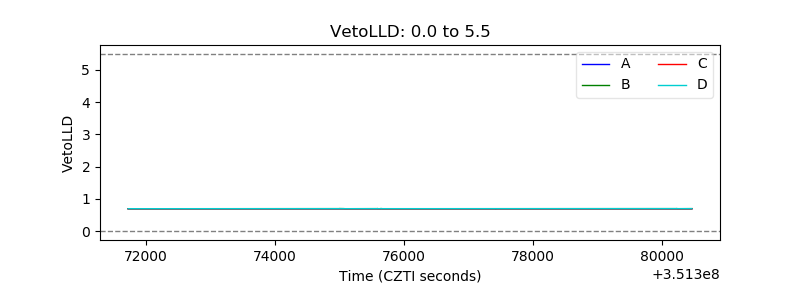 |
| Alpha Counter | 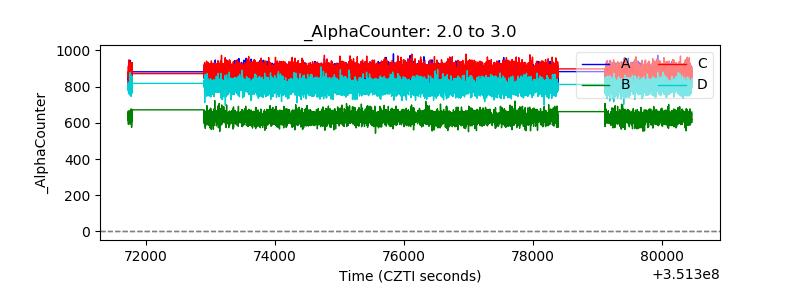 |
| _CPM_Rate | 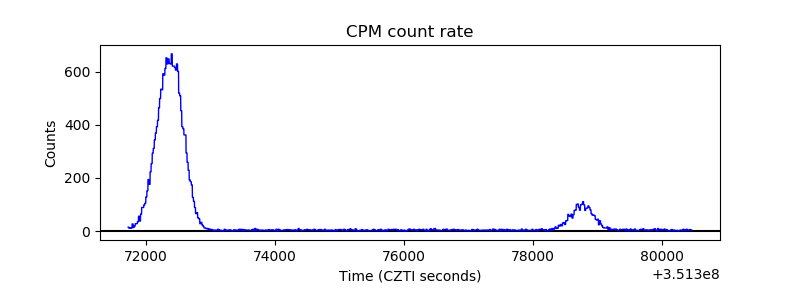 |
| CZT Counter | 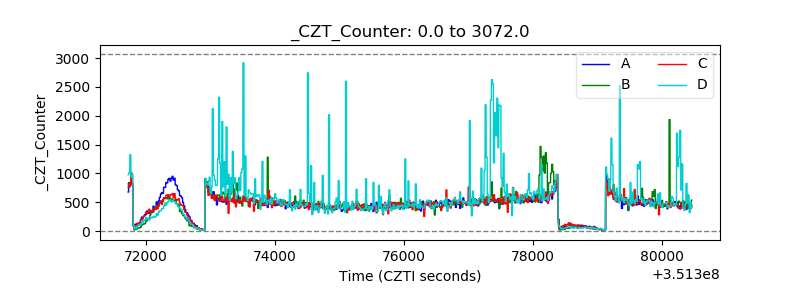 |
| +2.5 Volts monitor |  |
| +5 Volts monitor |  |
| _ROLL_ROT | 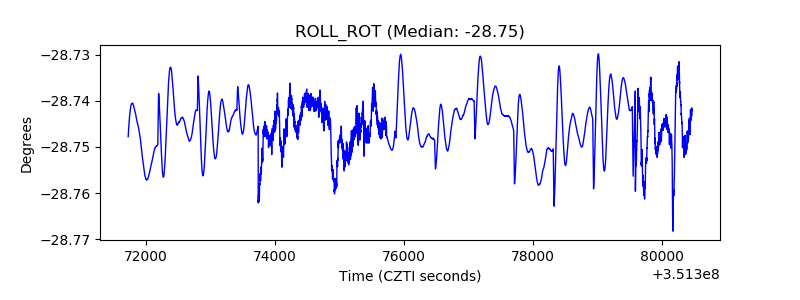 |
| _Roll_DEC | 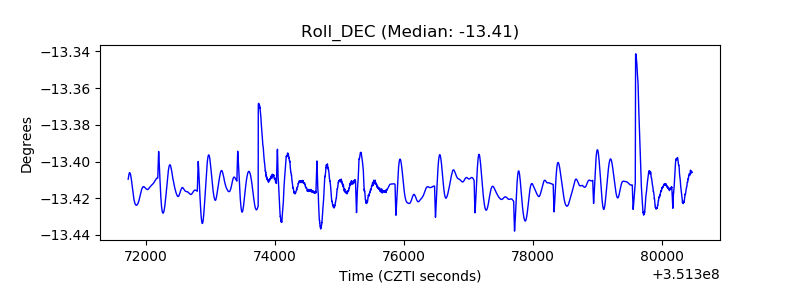 |
| _Roll_RA | 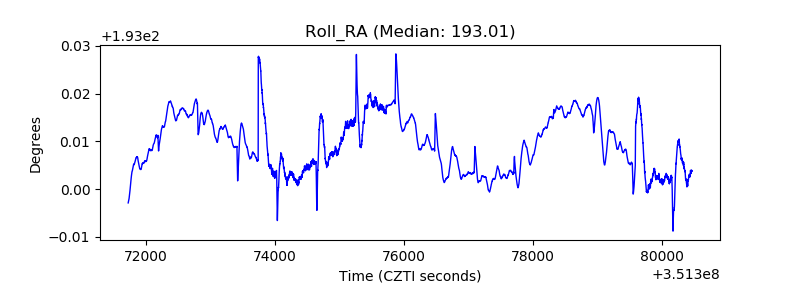 |
| Veto Counter | 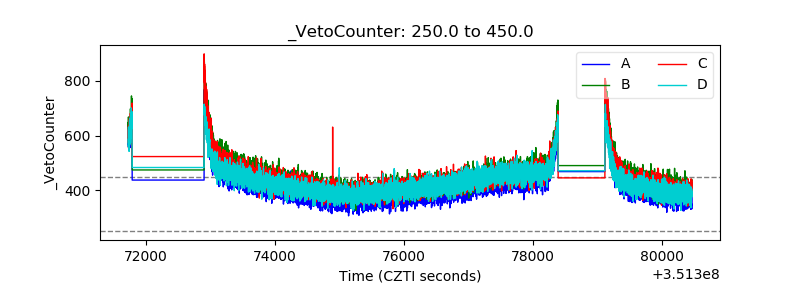 |