| Param | Original file | Final file |
|---|---|---|
| Filename | modeM0/AS1A10_099T01_9000004184_29173cztM0_level2.evt | modeM0/AS1A10_099T01_9000004184_29173cztM0_level2_quad_clean.evt |
| Size (bytes) | 556,948,800 | 108,881,280 |
| Size | 531.1 MB | 103.8 MB |
| Events in quadrant A | 3,764,410 | 699,402 |
| Events in quadrant B | 3,954,140 | 712,808 |
| Events in quadrant C | 3,870,689 | 681,851 |
| Events in quadrant D | 4,749,346 | 661,480 |
| Mode M9 | |||
|---|---|---|---|
| Quadrant | BADHDUFLAG | Total packets | Discarded packets |
| A | 0 | 5 | 0 |
| B | 0 | 5 | 0 |
| C | 0 | 5 | 0 |
| D | 0 | 5 | 0 |
| Mode SS | |||
|---|---|---|---|
| Quadrant | BADHDUFLAG | Total packets | Discarded packets |
| A | 0 | 162 | 0 |
| B | 0 | 162 | 0 |
| C | 0 | 162 | 0 |
| D | 0 | 162 | 0 |
| Mode M0 | |||
|---|---|---|---|
| Quadrant | BADHDUFLAG | Total packets | Discarded packets |
| A | 0 | 16198 | 2 |
| B | 0 | 16680 | 2 |
| C | 0 | 16300 | 2 |
| D | 0 | 19537 | 2 |
| Quadrant | Total seconds | Saturated seconds | Saturation percentage |
|---|---|---|---|
| A | 7791 | 102 | 1.309203% |
| B | 7792 | 152 | 1.950719% |
| C | 7792 | 173 | 2.220226% |
| D | 7792 | 196 | 2.515400% |
Noise dominated data is calculated using 1-second bins in cleaned event files. If a bin has >2000 counts, and if more than 50% of those come from <1% of pixels, then it is considered to be noise-dominated and hence unusable.
| Quadrant | # 1 sec bins | Bins with >0 counts | Bins with >2000 counts | High rate bins dominated by noise | Noise dominated (total time) | Noise dominated (detector-on time) | Marked lightcurve |
|---|---|---|---|---|---|---|---|
| A | 8321 | 7795 | 0 | 0 | 0.00% | 0.00% | 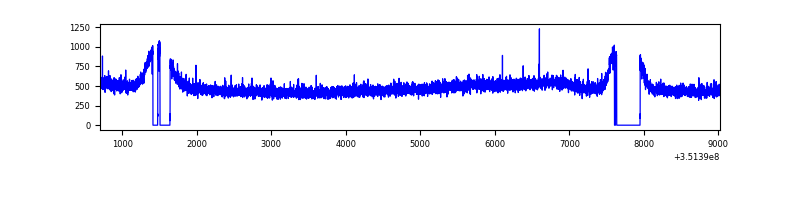 |
| B | 8322 | 7796 | 1 | 1 | 0.01% | 0.01% | 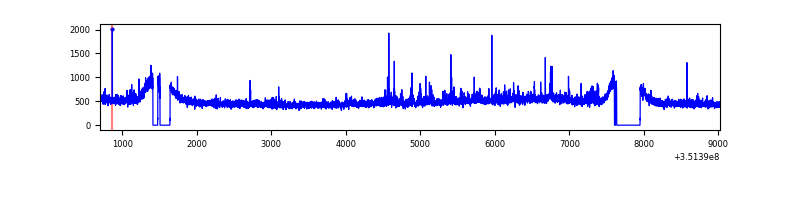 |
| C | 8322 | 7796 | 0 | 0 | 0.00% | 0.00% | 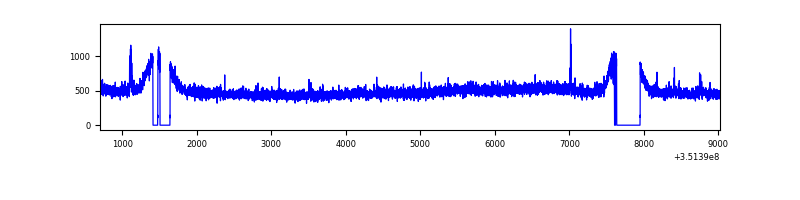 |
| D | 8322 | 7796 | 92 | 92 | 1.11% | 1.18% | 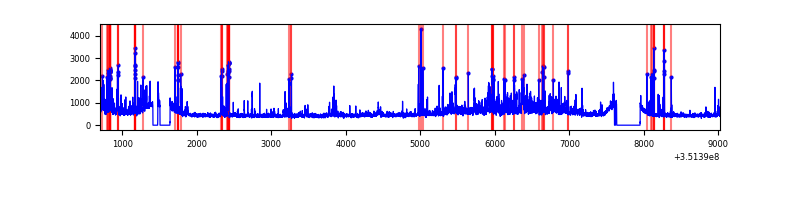 |
Top three noisy pixels from each quadrant. If the there are fewer than three noisy pixels in the level2.evt file, extra rows are filled as -1
| Pixel properties | Quadrant properties | ||||||
|---|---|---|---|---|---|---|---|
| Quadrant | DetID | PixID | Counts | Sigma | Mean | Median | Sigma |
| A | 13 | 254 | 13771 | 64.85 | 975 | 952 | 197.7 |
| A | 3 | 137 | 10232 | 46.95 | 975 | 952 | 197.7 |
| A | 0 | 226 | 8227 | 36.8 | 975 | 952 | 197.7 |
| B | 0 | 183 | 112755 | 587.06 | 969 | 941 | 190.5 |
| B | 12 | 111 | 24093 | 121.56 | 969 | 941 | 190.5 |
| B | 11 | 111 | 21747 | 109.24 | 969 | 941 | 190.5 |
| C | 14 | 238 | 149142 | 668.6 | 937 | 944 | 221.7 |
| C | 3 | 233 | 39348 | 173.26 | 937 | 944 | 221.7 |
| C | 2 | 114 | 18422 | 78.85 | 937 | 944 | 221.7 |
| D | 1 | 52 | 877091 | 3881.51 | 940 | 915 | 225.7 |
| D | 8 | 195 | 183759 | 810.01 | 940 | 915 | 225.7 |
| D | 13 | 153 | 46863 | 203.55 | 940 | 915 | 225.7 |
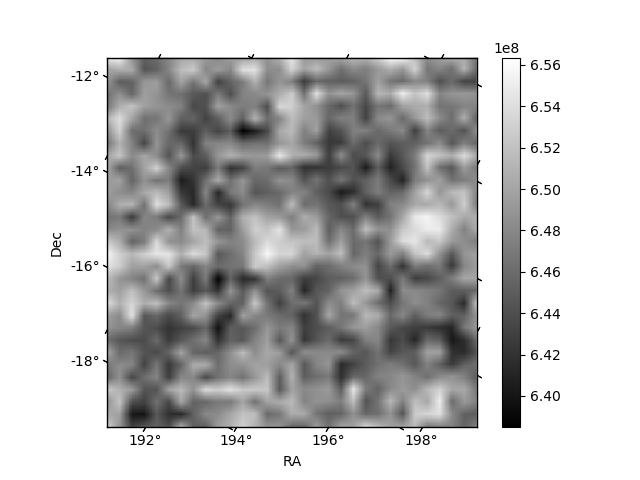
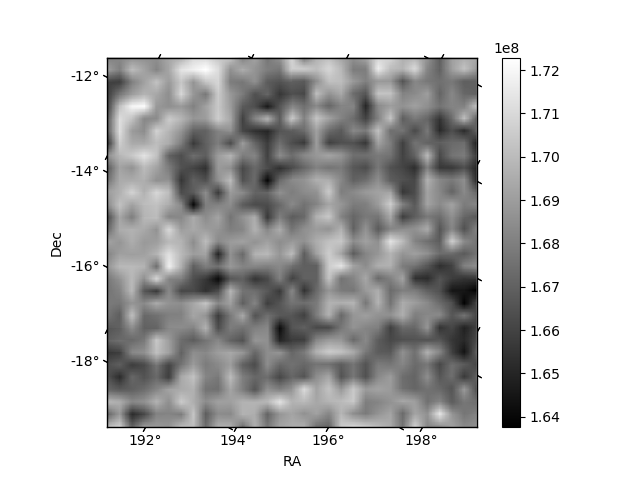
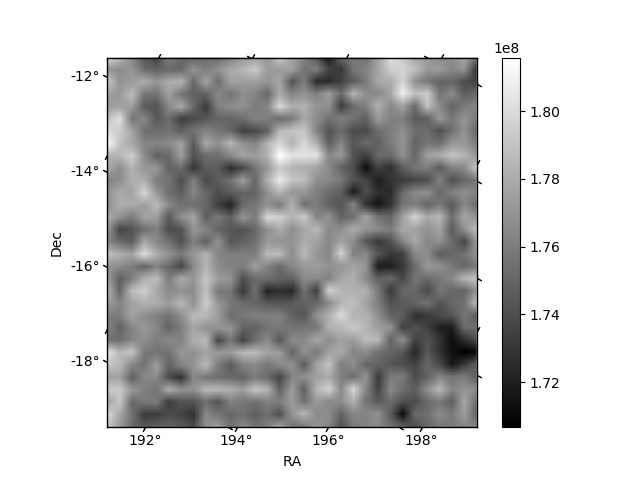
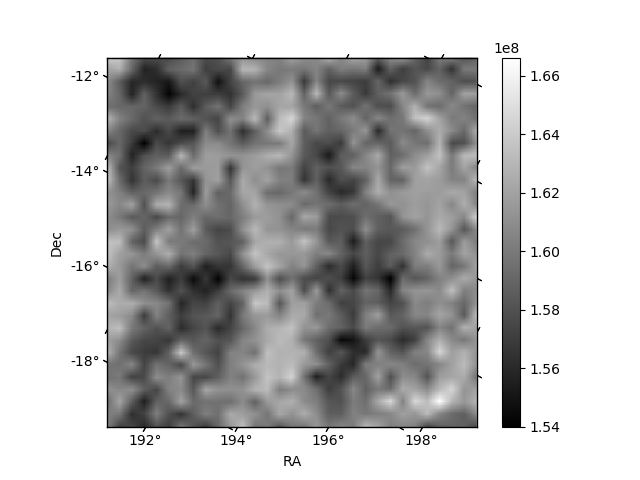
Histogram calculated using DETX and DETY for each event in the final _common_clean file
| Quadrant A | 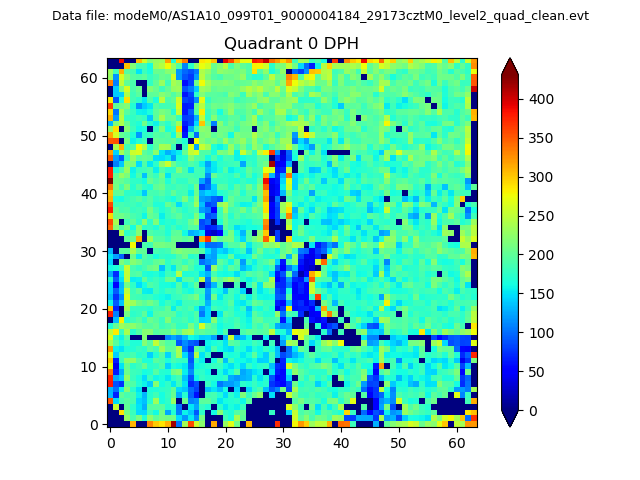 |
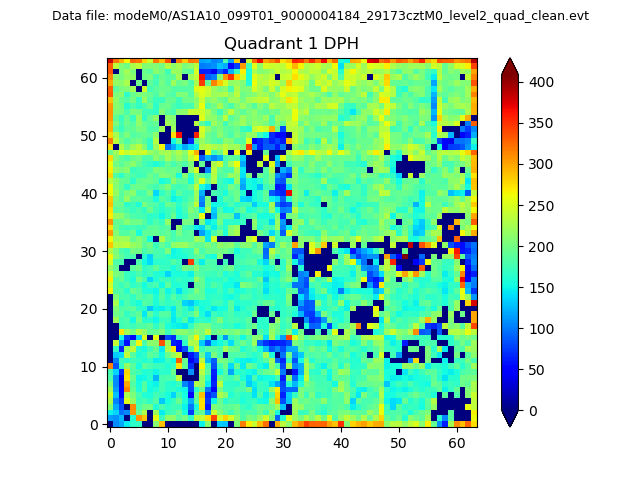 |
Quadrant B |
|---|---|---|---|
| Quadrant D | 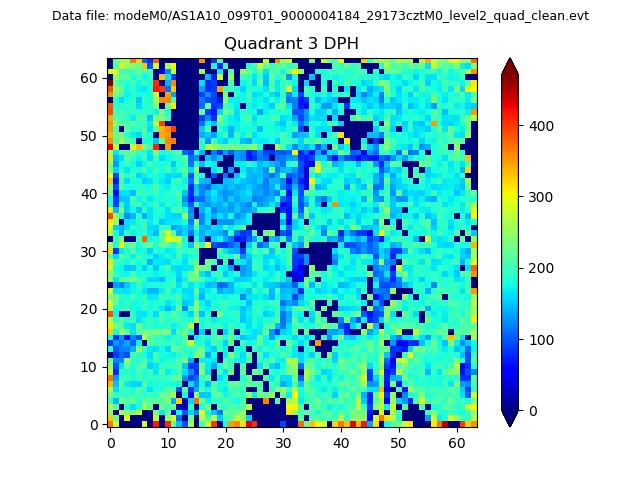 |
 |
Quadrant C |
| Plot type | Count rate plots | Images |
|---|---|---|
| Comparison with Poisson distribution Blue bars denote a histogram of data divided into 1 sec bins. Red curve is a Poisson curve with rate = median count rate of data. |
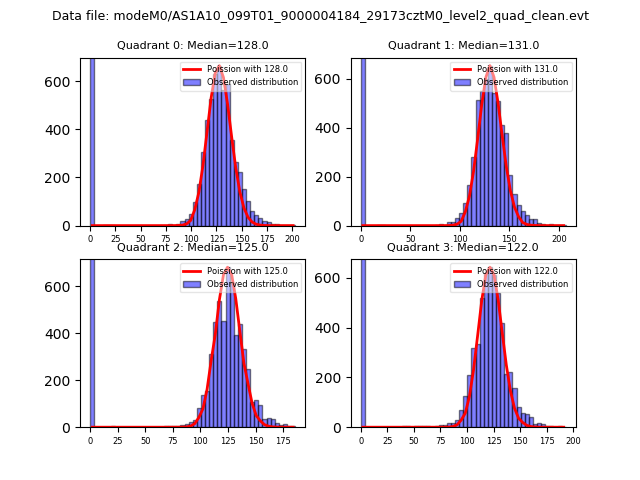 |
 |
| Quadrant-wise count rates Data is divided into 100 sec bins |
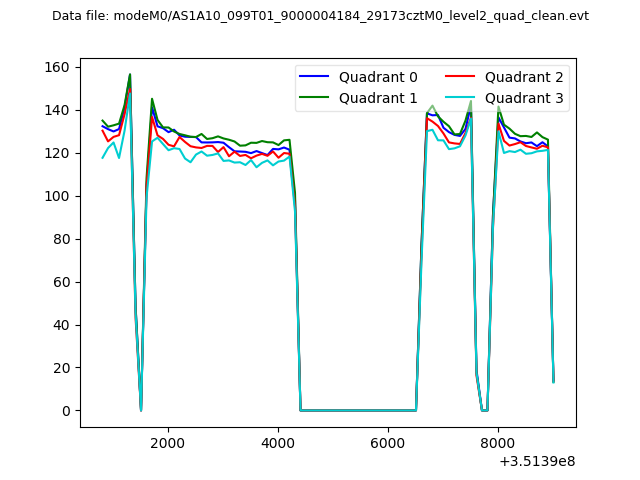 |
|
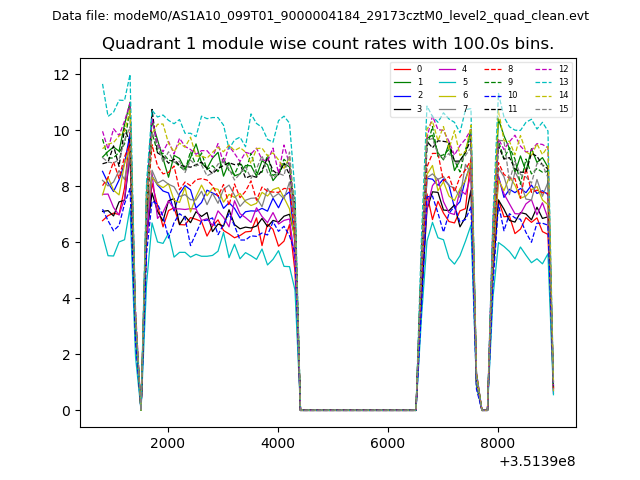
| Module-wise count rates for Quadrant A Data is divided into 100 sec bins |
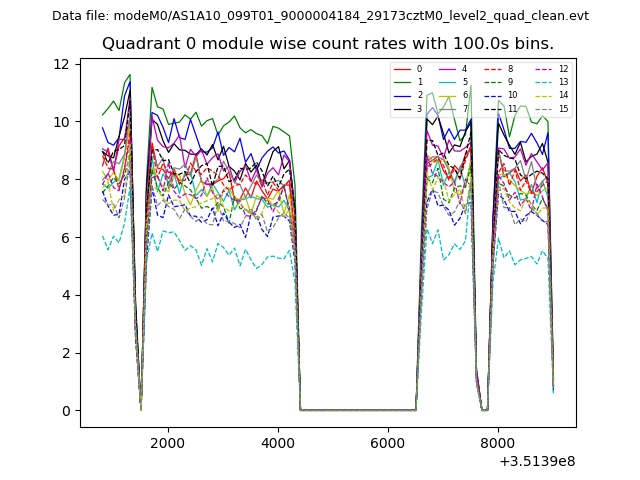 |
 |
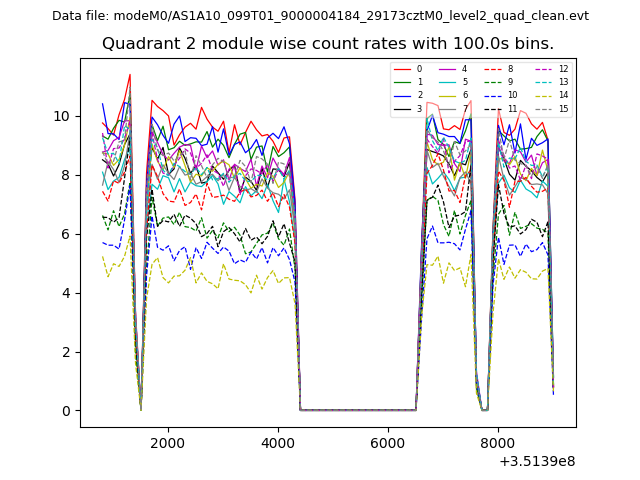
| Module-wise count rates for Quadrant B Data is divided into 100 sec bins |
 |
 |
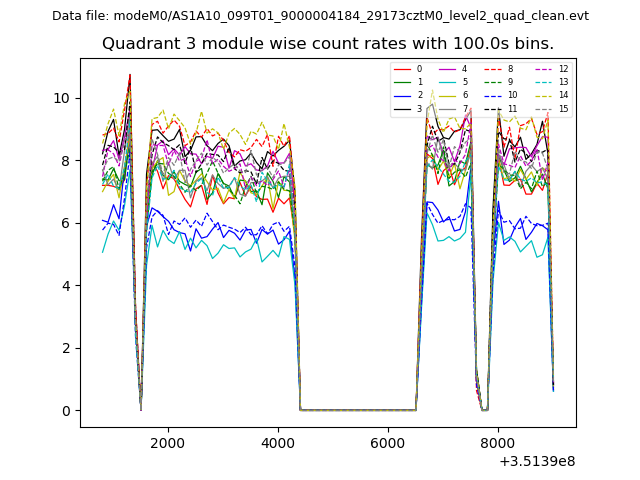
| Module-wise count rates for Quadrant C Data is divided into 100 sec bins |
 |
 |
| Module-wise count rates for Quadrant D Data is divided into 100 sec bins |
 |
 |
| Parameter | Plot |
|---|---|
| CZT HV Monitor | 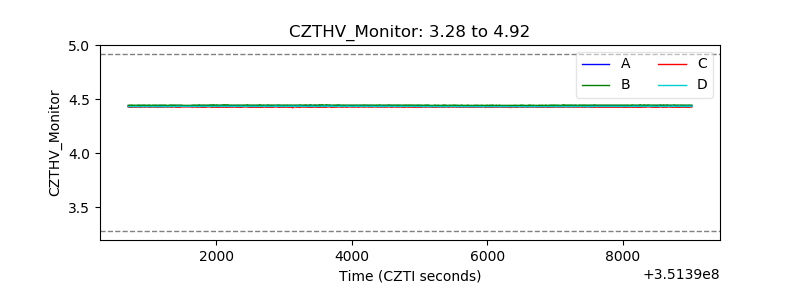 |
| D_VDD | 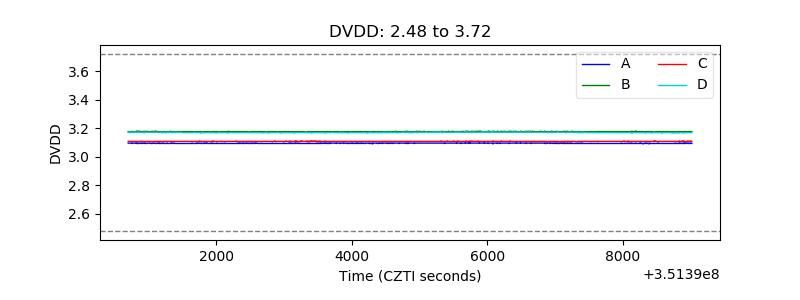 |
| Temperature 1 |  |
| Veto HV Monitor | 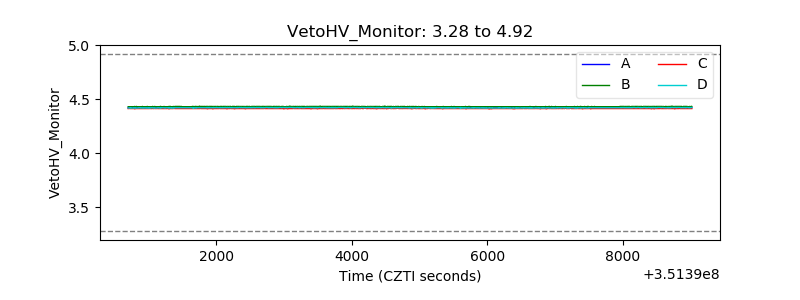 |
| Veto LLD | 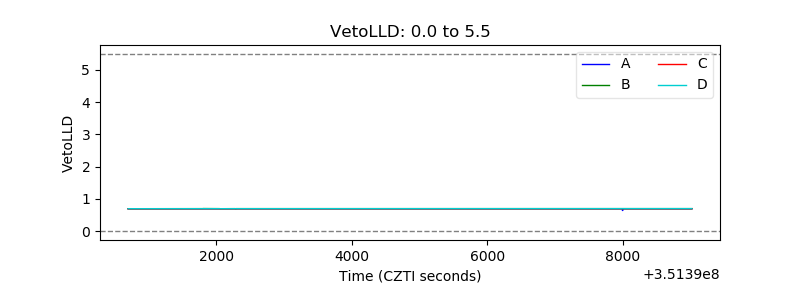 |
| Alpha Counter | 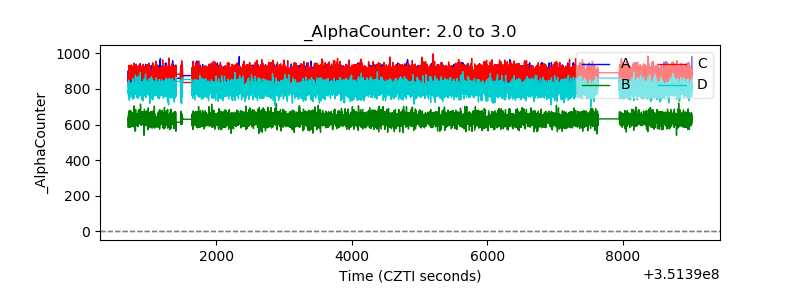 |
| _CPM_Rate | 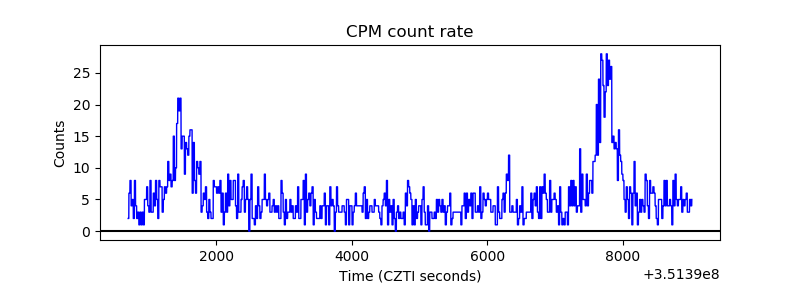 |
| CZT Counter | 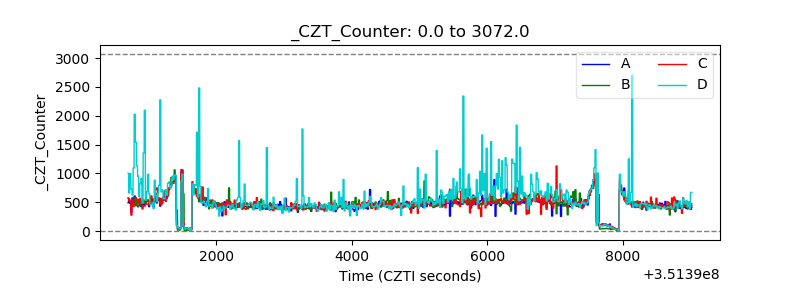 |
| +2.5 Volts monitor |  |
| +5 Volts monitor | 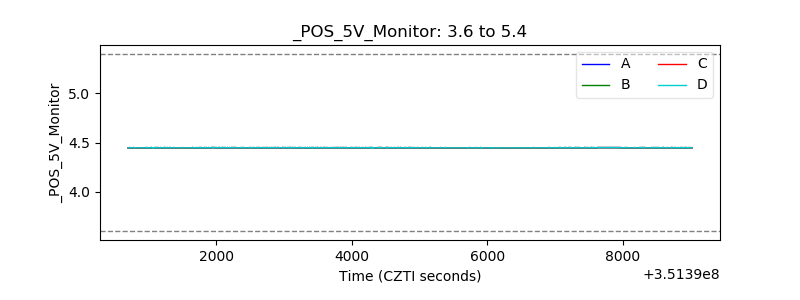 |
| _ROLL_ROT | 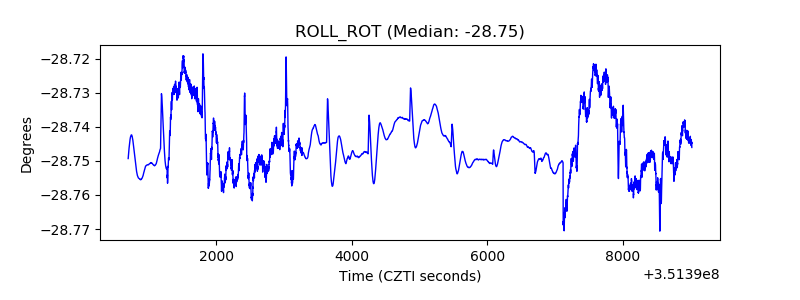 |
| _Roll_DEC | 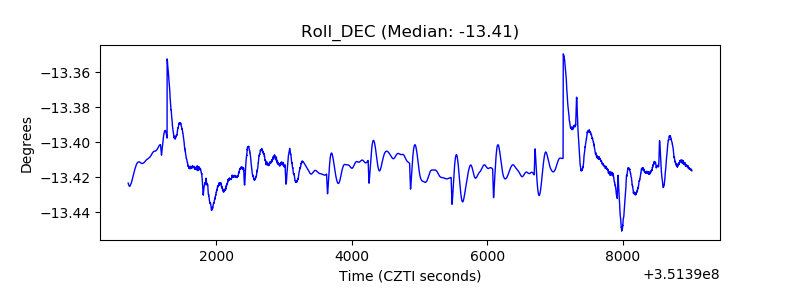 |
| _Roll_RA | 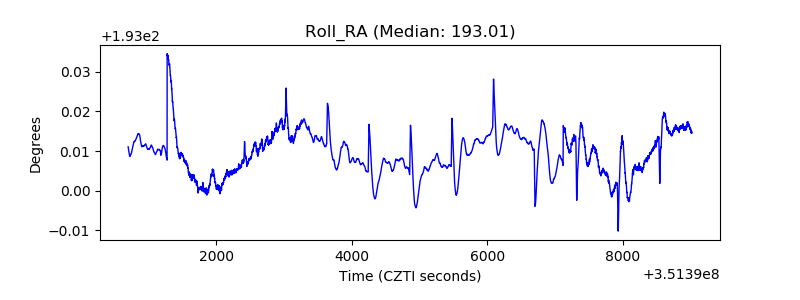 |
| Veto Counter | 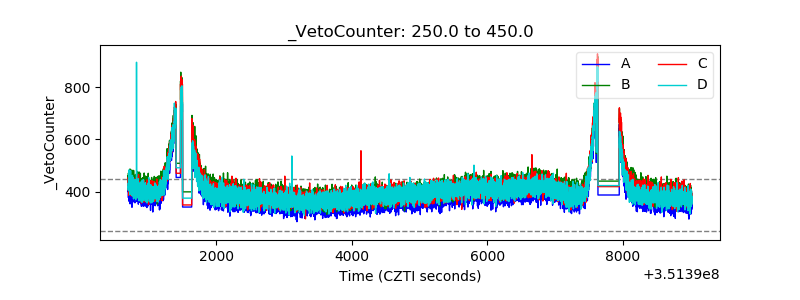 |