| Param | Original file | Final file |
|---|---|---|
| Filename | modeM0/AS1A10_099T01_9000004184_29175cztM0_level2.evt | modeM0/AS1A10_099T01_9000004184_29175cztM0_level2_quad_clean.evt |
| Size (bytes) | 870,552,000 | 159,390,720 |
| Size | 830.2 MB | 152.0 MB |
| Events in quadrant A | 5,842,021 | 1,000,398 |
| Events in quadrant B | 6,239,544 | 1,025,990 |
| Events in quadrant C | 6,011,703 | 981,460 |
| Events in quadrant D | 7,427,938 | 957,881 |
| Mode M9 | |||
|---|---|---|---|
| Quadrant | BADHDUFLAG | Total packets | Discarded packets |
| A | 0 | 12 | 0 |
| B | 0 | 12 | 0 |
| C | 0 | 12 | 0 |
| D | 0 | 12 | 0 |
| Mode SS | |||
|---|---|---|---|
| Quadrant | BADHDUFLAG | Total packets | Discarded packets |
| A | 0 | 254 | 0 |
| B | 0 | 254 | 0 |
| C | 0 | 254 | 0 |
| D | 0 | 254 | 0 |
| Mode M0 | |||
|---|---|---|---|
| Quadrant | BADHDUFLAG | Total packets | Discarded packets |
| A | 0 | 25261 | 2 |
| B | 0 | 26367 | 2 |
| C | 0 | 25388 | 2 |
| D | 0 | 30300 | 2 |
| Quadrant | Total seconds | Saturated seconds | Saturation percentage |
|---|---|---|---|
| A | 12466 | 105 | 0.842291% |
| B | 12466 | 137 | 1.098989% |
| C | 12467 | 175 | 1.403706% |
| D | 12467 | 256 | 2.053421% |
Noise dominated data is calculated using 1-second bins in cleaned event files. If a bin has >2000 counts, and if more than 50% of those come from <1% of pixels, then it is considered to be noise-dominated and hence unusable.
| Quadrant | # 1 sec bins | Bins with >0 counts | Bins with >2000 counts | High rate bins dominated by noise | Noise dominated (total time) | Noise dominated (detector-on time) | Marked lightcurve |
|---|---|---|---|---|---|---|---|
| A | 13686 | 12469 | 0 | 0 | 0.00% | 0.00% | 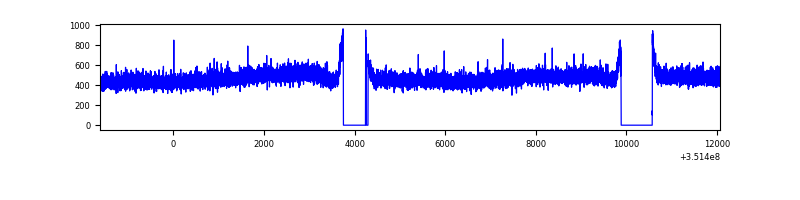 |
| B | 13686 | 12469 | 5 | 5 | 0.04% | 0.04% | 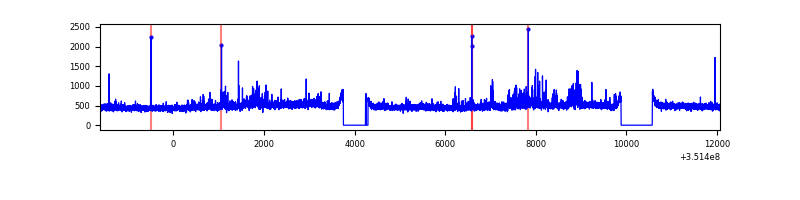 |
| C | 13687 | 12470 | 0 | 0 | 0.00% | 0.00% | 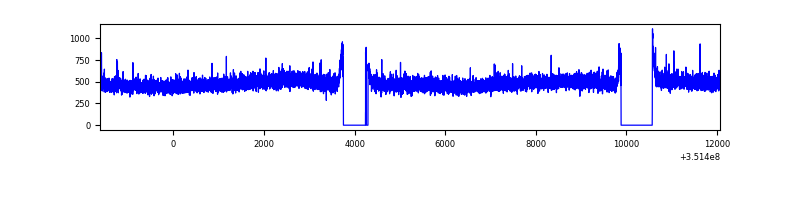 |
| D | 13687 | 12470 | 112 | 112 | 0.82% | 0.90% | 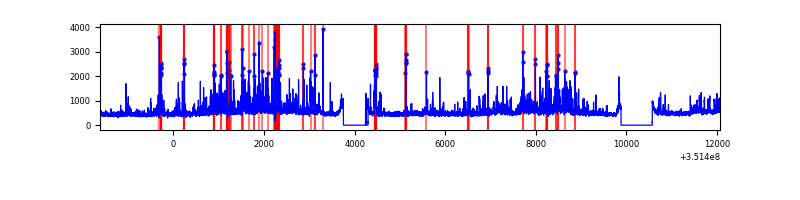 |
Top three noisy pixels from each quadrant. If the there are fewer than three noisy pixels in the level2.evt file, extra rows are filled as -1
| Pixel properties | Quadrant properties | ||||||
|---|---|---|---|---|---|---|---|
| Quadrant | DetID | PixID | Counts | Sigma | Mean | Median | Sigma |
| A | 13 | 254 | 22309 | 68.4 | 1513 | 1478 | 304.5 |
| A | 3 | 137 | 15195 | 45.04 | 1513 | 1478 | 304.5 |
| A | 0 | 226 | 12721 | 36.92 | 1513 | 1478 | 304.5 |
| B | 0 | 183 | 308012 | 1067.3 | 1497 | 1459 | 287.2 |
| B | 12 | 111 | 36686 | 122.65 | 1497 | 1459 | 287.2 |
| B | 11 | 111 | 33882 | 112.88 | 1497 | 1459 | 287.2 |
| C | 14 | 238 | 234383 | 681.87 | 1460 | 1467 | 341.6 |
| C | 3 | 233 | 54922 | 156.49 | 1460 | 1467 | 341.6 |
| C | 2 | 114 | 29251 | 81.34 | 1460 | 1467 | 341.6 |
| D | 1 | 52 | 1019831 | 2931.32 | 1464 | 1425 | 347.4 |
| D | 8 | 195 | 668063 | 1918.81 | 1464 | 1425 | 347.4 |
| D | 13 | 153 | 164494 | 469.37 | 1464 | 1425 | 347.4 |
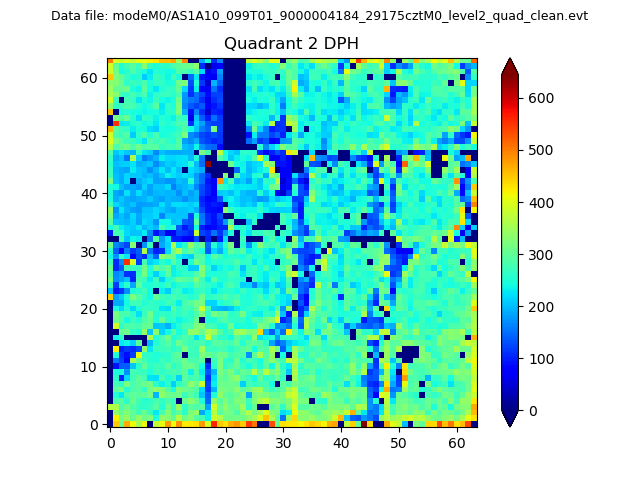
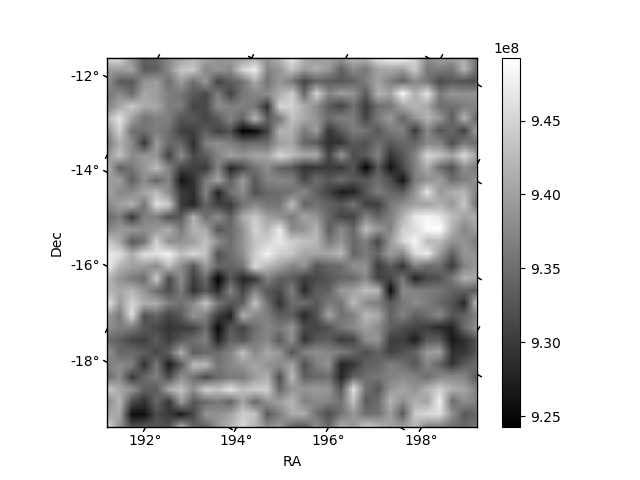
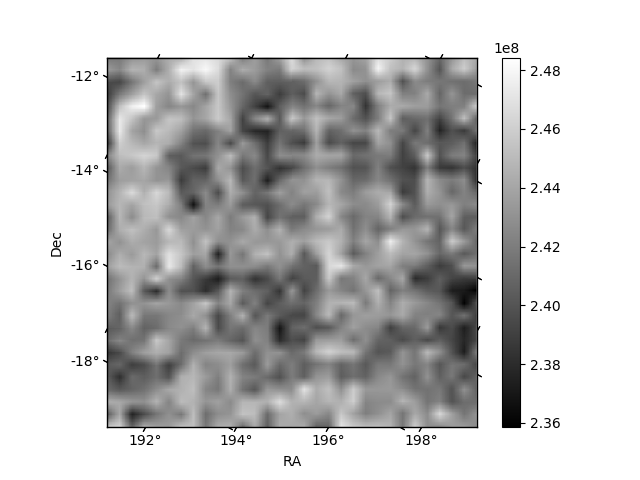
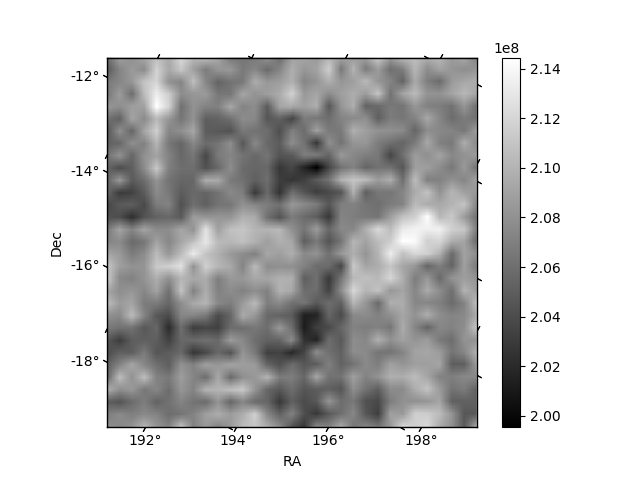
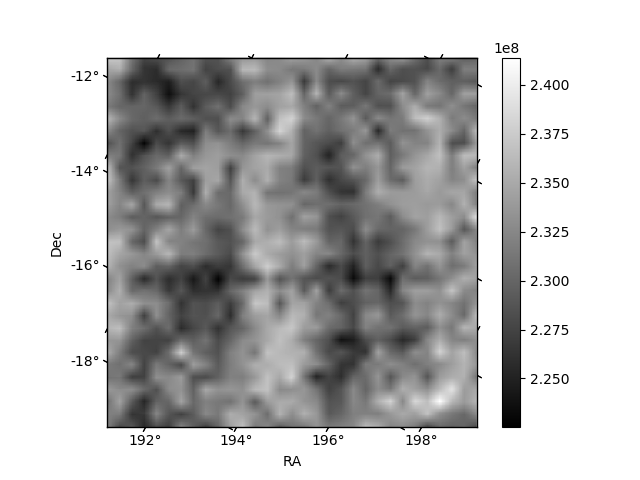
Histogram calculated using DETX and DETY for each event in the final _common_clean file
| Quadrant A | 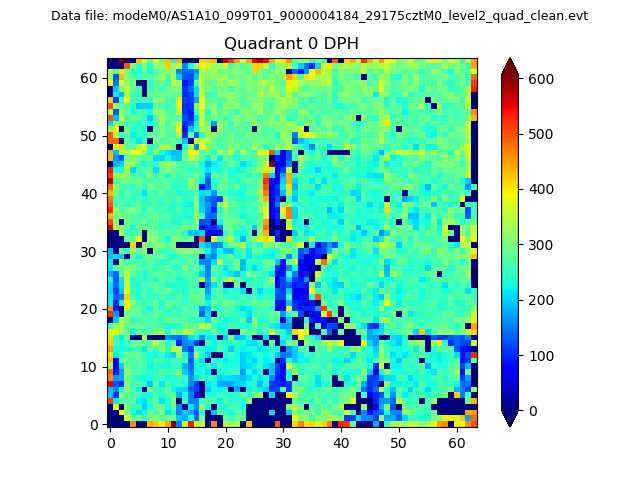 |
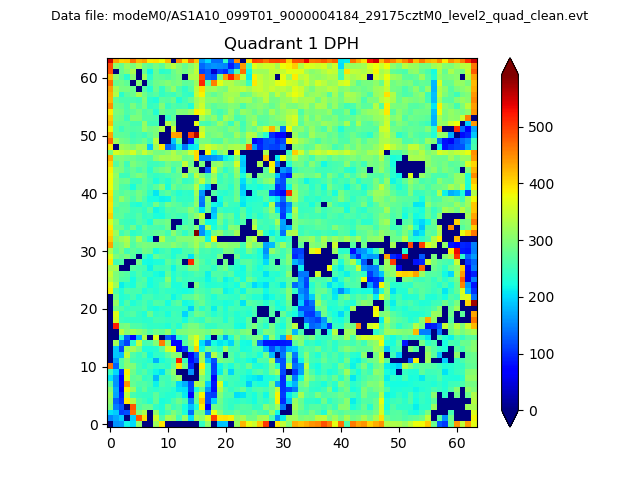 |
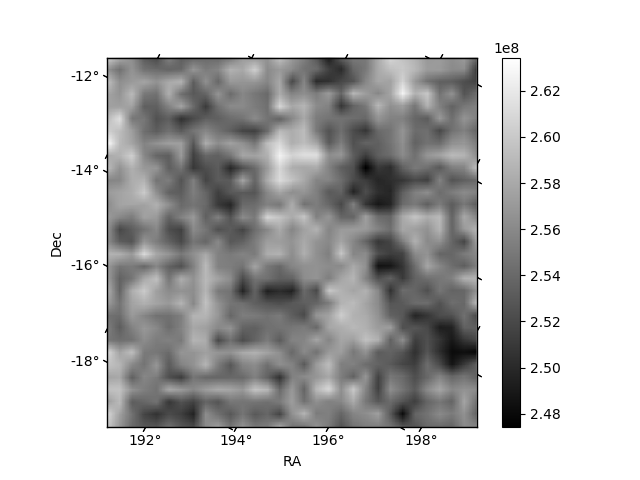
Quadrant B |
|---|---|---|---|
| Quadrant D | 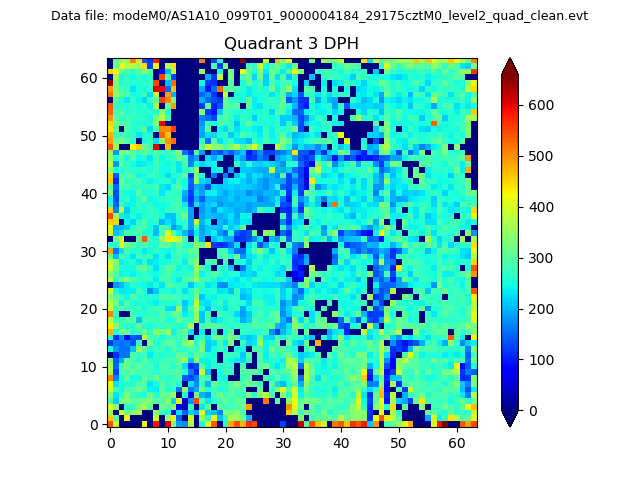 |
 |
Quadrant C |
| Plot type | Count rate plots | Images |
|---|---|---|
| Comparison with Poisson distribution Blue bars denote a histogram of data divided into 1 sec bins. Red curve is a Poisson curve with rate = median count rate of data. |
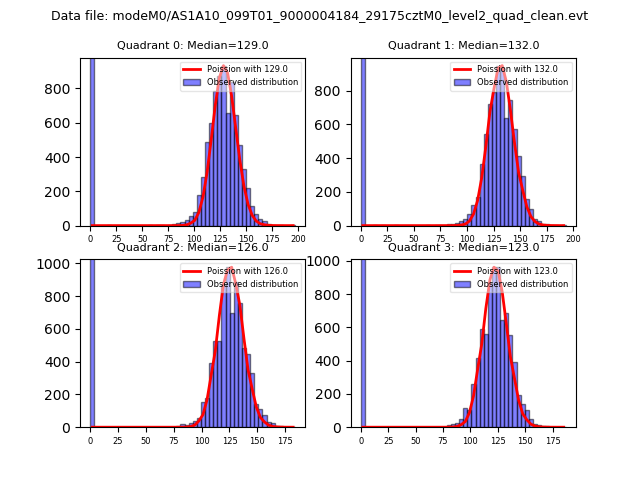 |
 |
| Quadrant-wise count rates Data is divided into 100 sec bins |
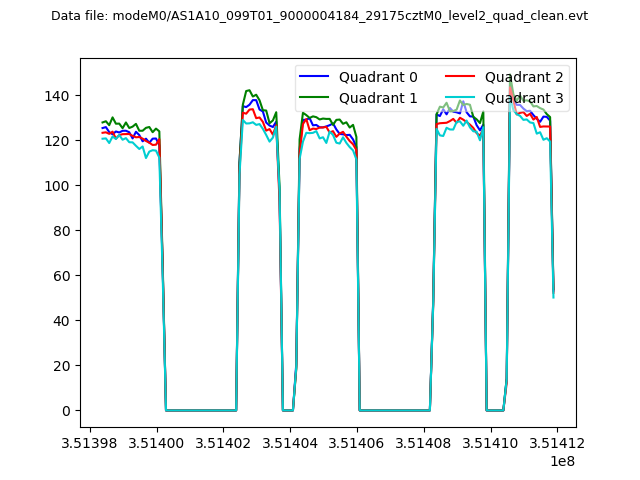 |
|
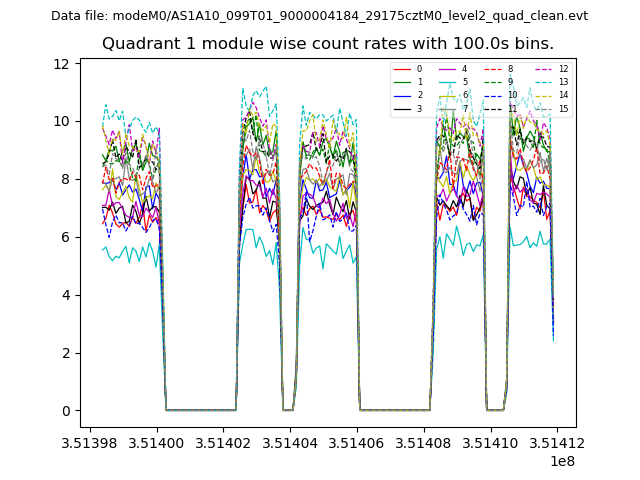
| Module-wise count rates for Quadrant A Data is divided into 100 sec bins |
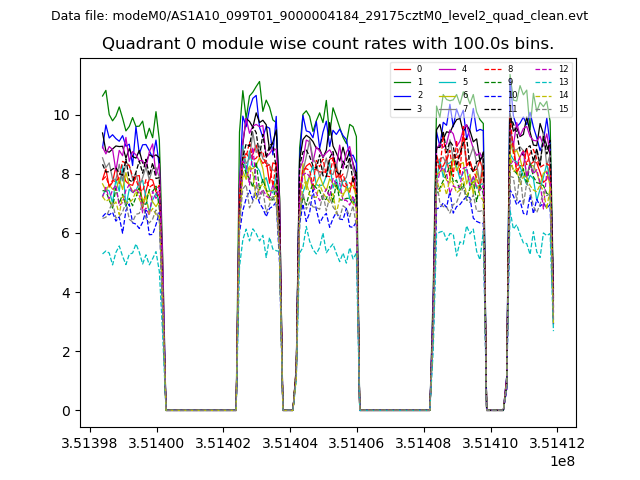 |
 |
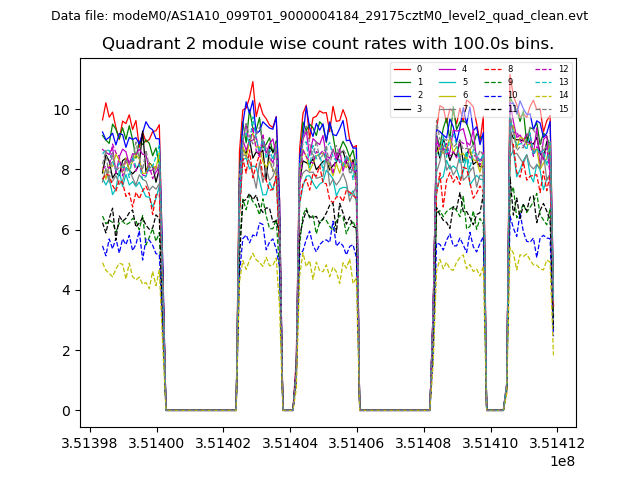
| Module-wise count rates for Quadrant B Data is divided into 100 sec bins |
 |
 |
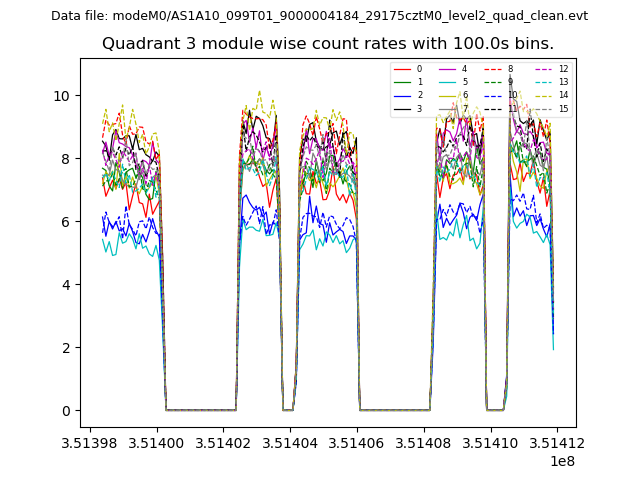
| Module-wise count rates for Quadrant C Data is divided into 100 sec bins |
 |
 |
| Module-wise count rates for Quadrant D Data is divided into 100 sec bins |
 |
 |
| Parameter | Plot |
|---|---|
| CZT HV Monitor | 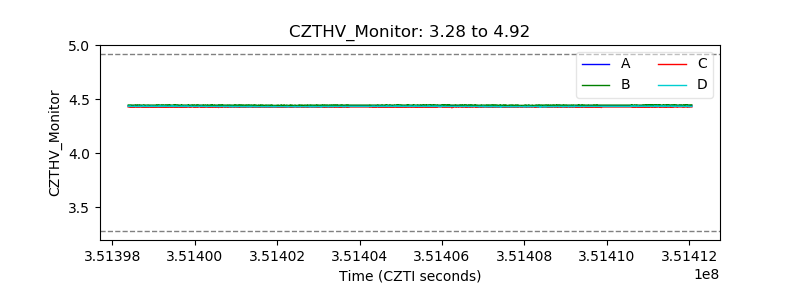 |
| D_VDD | 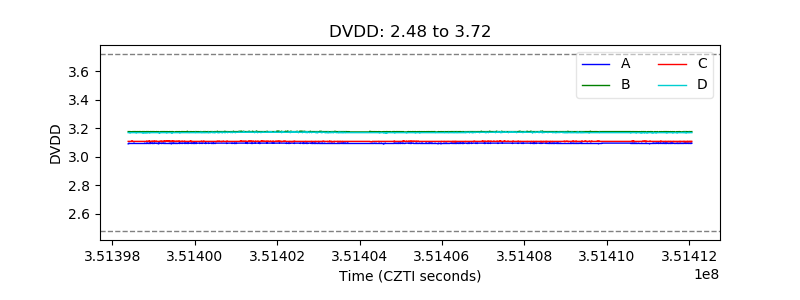 |
| Temperature 1 | 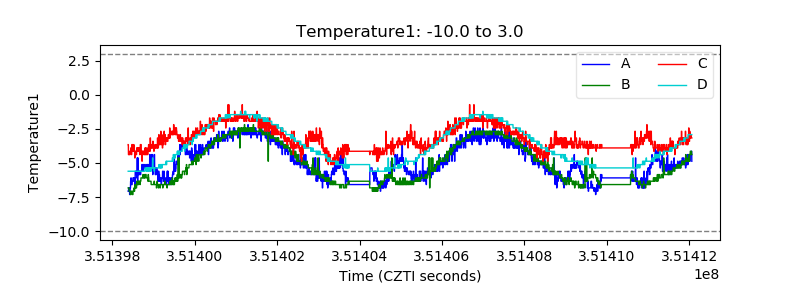 |
| Veto HV Monitor | 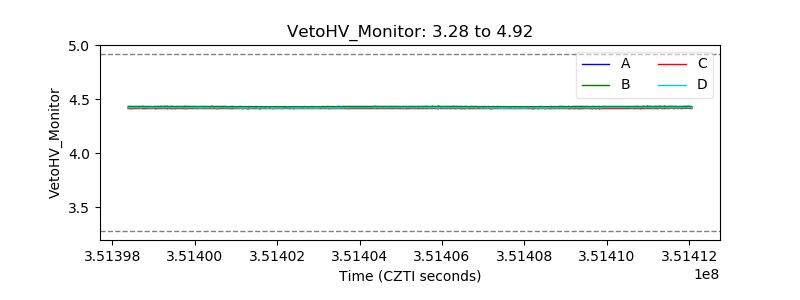 |
| Veto LLD | 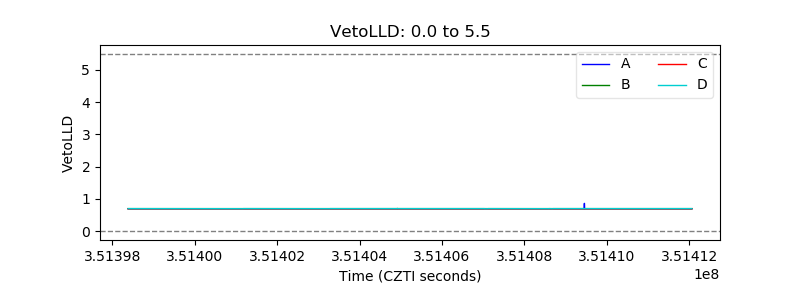 |
| Alpha Counter | 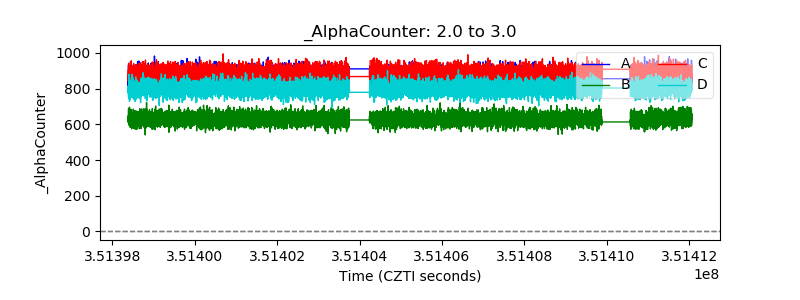 |
| _CPM_Rate | 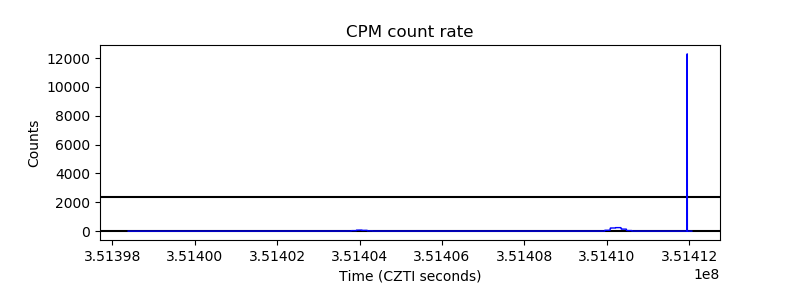 |
| CZT Counter | 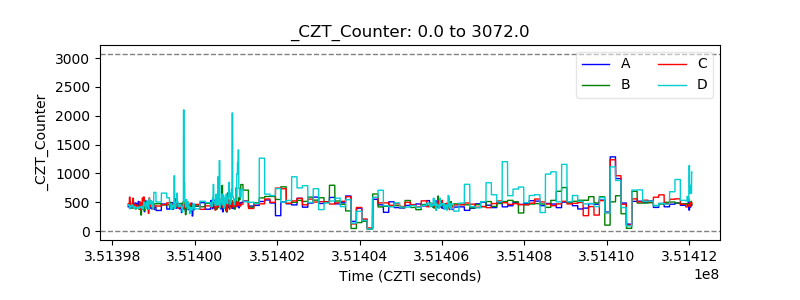 |
| +2.5 Volts monitor | 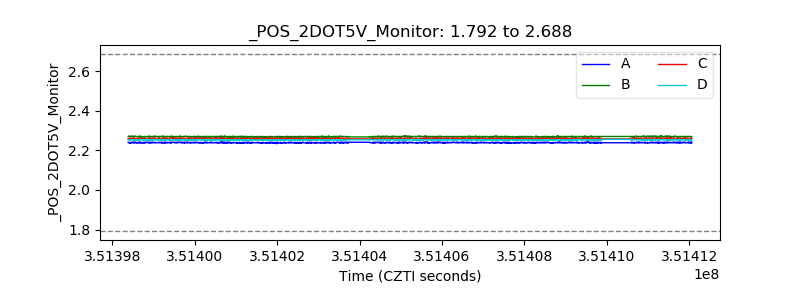 |
| +5 Volts monitor |  |
| _ROLL_ROT | 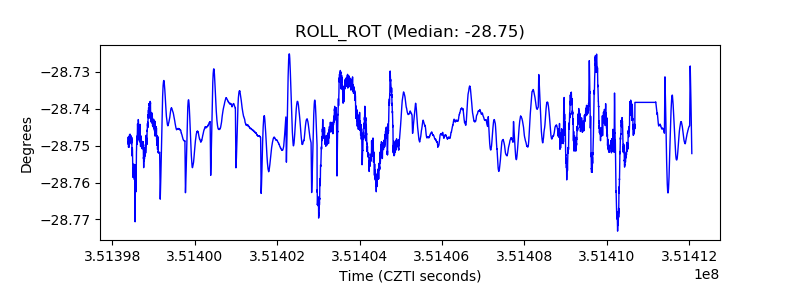 |
| _Roll_DEC | 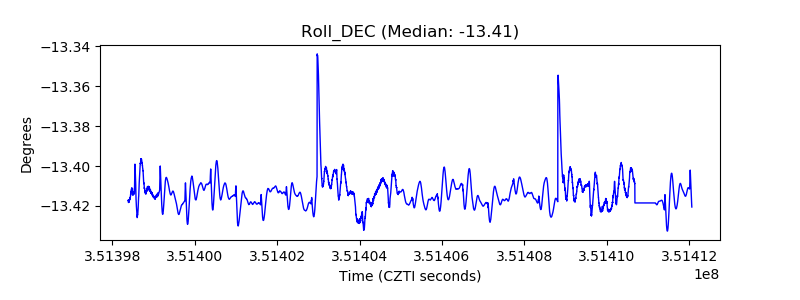 |
| _Roll_RA | 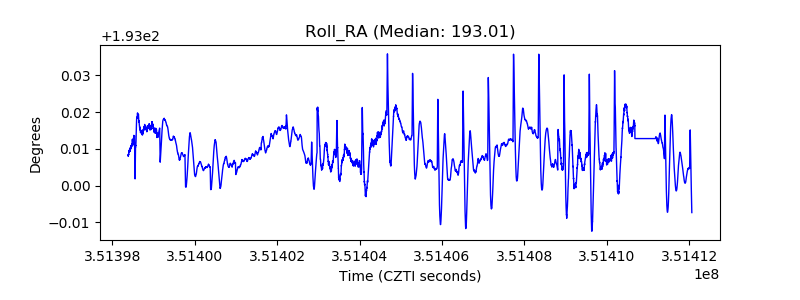 |
| Veto Counter | 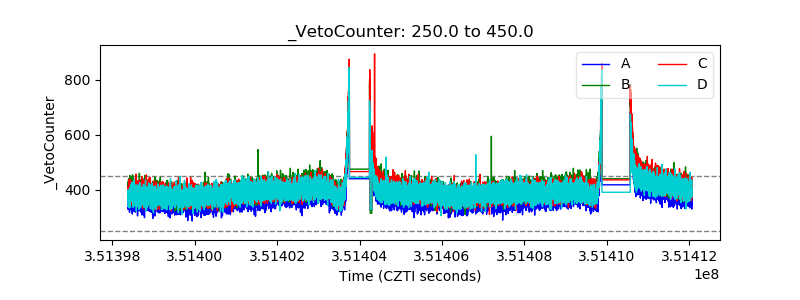 |