| Param | Original file | Final file |
|---|---|---|
| Filename | modeM0/AS1A10_099T01_9000004184_29177cztM0_level2.evt | modeM0/AS1A10_099T01_9000004184_29177cztM0_level2_quad_clean.evt |
| Size (bytes) | 464,112,000 | 72,912,960 |
| Size | 442.6 MB | 69.5 MB |
| Events in quadrant A | 3,118,939 | 449,956 |
| Events in quadrant B | 3,255,426 | 457,562 |
| Events in quadrant C | 3,264,352 | 437,509 |
| Events in quadrant D | 3,990,208 | 424,205 |
| Mode M9 | |||
|---|---|---|---|
| Quadrant | BADHDUFLAG | Total packets | Discarded packets |
| A | 0 | 11 | 0 |
| B | 0 | 11 | 0 |
| C | 0 | 11 | 0 |
| D | 0 | 11 | 0 |
| Mode SS | |||
|---|---|---|---|
| Quadrant | BADHDUFLAG | Total packets | Discarded packets |
| A | 0 | 126 | 0 |
| B | 0 | 126 | 0 |
| C | 0 | 126 | 0 |
| D | 0 | 126 | 0 |
| Mode M0 | |||
|---|---|---|---|
| Quadrant | BADHDUFLAG | Total packets | Discarded packets |
| A | 0 | 13151 | 1 |
| B | 0 | 13492 | 1 |
| C | 0 | 13411 | 1 |
| D | 0 | 15996 | 2 |
| Quadrant | Total seconds | Saturated seconds | Saturation percentage |
|---|---|---|---|
| A | 6289 | 41 | 0.651932% |
| B | 6290 | 57 | 0.906200% |
| C | 6290 | 88 | 1.399046% |
| D | 6289 | 125 | 1.987597% |
Noise dominated data is calculated using 1-second bins in cleaned event files. If a bin has >2000 counts, and if more than 50% of those come from <1% of pixels, then it is considered to be noise-dominated and hence unusable.
| Quadrant | # 1 sec bins | Bins with >0 counts | Bins with >2000 counts | High rate bins dominated by noise | Noise dominated (total time) | Noise dominated (detector-on time) | Marked lightcurve |
|---|---|---|---|---|---|---|---|
| A | 7340 | 6290 | 0 | 0 | 0.00% | 0.00% | 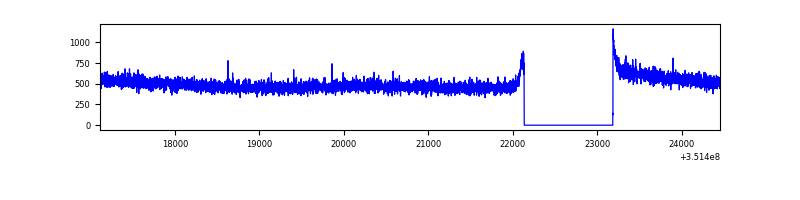 |
| B | 7341 | 6291 | 5 | 5 | 0.07% | 0.08% | 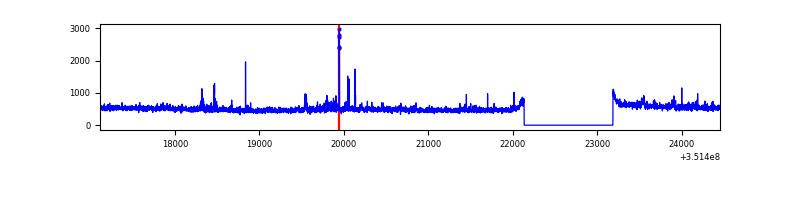 |
| C | 7341 | 6291 | 0 | 0 | 0.00% | 0.00% | 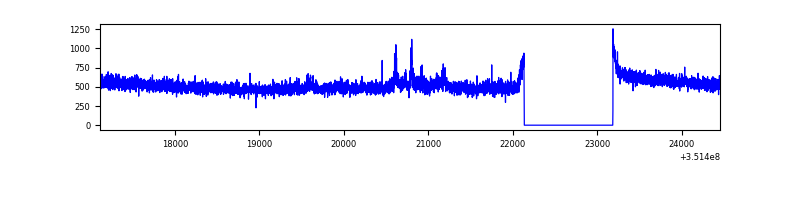 |
| D | 7340 | 6290 | 74 | 74 | 1.01% | 1.18% | 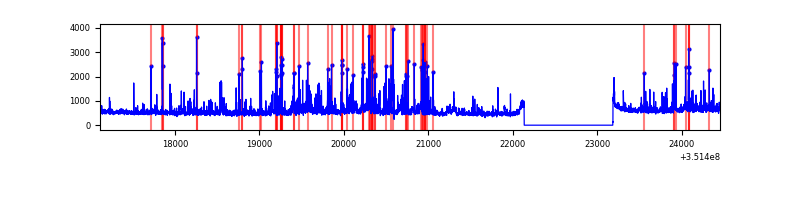 |
Top three noisy pixels from each quadrant. If the there are fewer than three noisy pixels in the level2.evt file, extra rows are filled as -1
| Pixel properties | Quadrant properties | ||||||
|---|---|---|---|---|---|---|---|
| Quadrant | DetID | PixID | Counts | Sigma | Mean | Median | Sigma |
| A | 13 | 254 | 11655 | 66.47 | 808 | 790 | 163.5 |
| A | 3 | 137 | 7772 | 42.71 | 808 | 790 | 163.5 |
| A | 0 | 226 | 6809 | 36.82 | 808 | 790 | 163.5 |
| B | 0 | 183 | 94477 | 615.05 | 797 | 779 | 152.3 |
| B | 12 | 111 | 18884 | 118.85 | 797 | 779 | 152.3 |
| B | 11 | 111 | 17441 | 109.37 | 797 | 779 | 152.3 |
| C | 14 | 238 | 125535 | 687.82 | 778 | 784 | 181.4 |
| C | 3 | 233 | 91018 | 497.51 | 778 | 784 | 181.4 |
| C | 2 | 114 | 14213 | 74.04 | 778 | 784 | 181.4 |
| D | 8 | 195 | 360207 | 1921.19 | 783 | 762 | 187.1 |
| D | 1 | 52 | 350664 | 1870.19 | 783 | 762 | 187.1 |
| D | 13 | 153 | 224942 | 1198.22 | 783 | 762 | 187.1 |
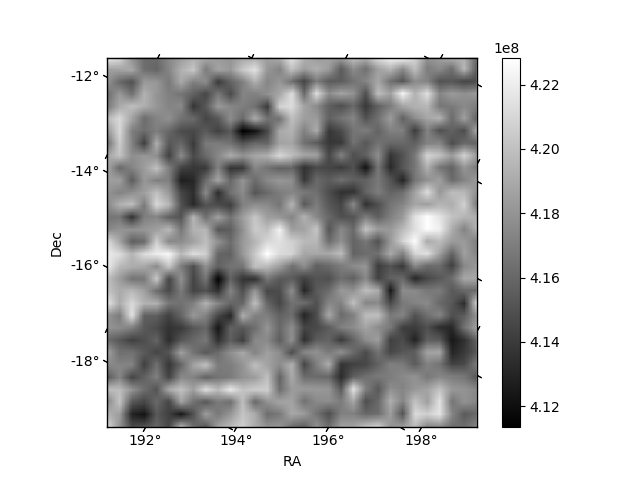
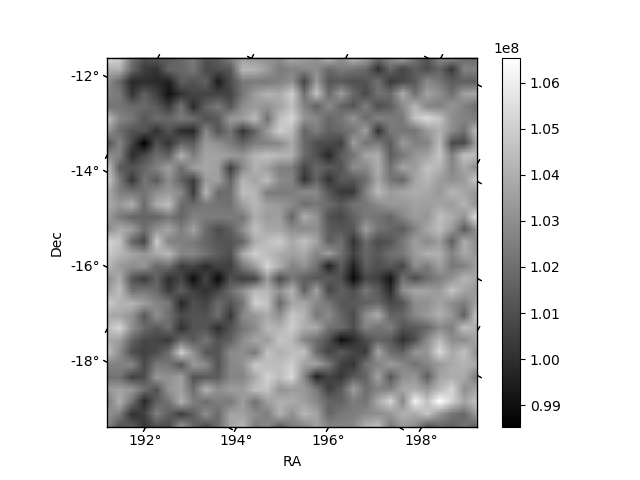
Histogram calculated using DETX and DETY for each event in the final _common_clean file
| Quadrant A | 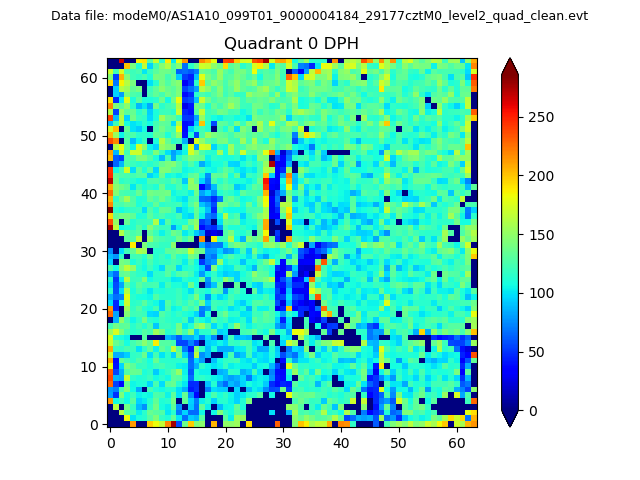 |
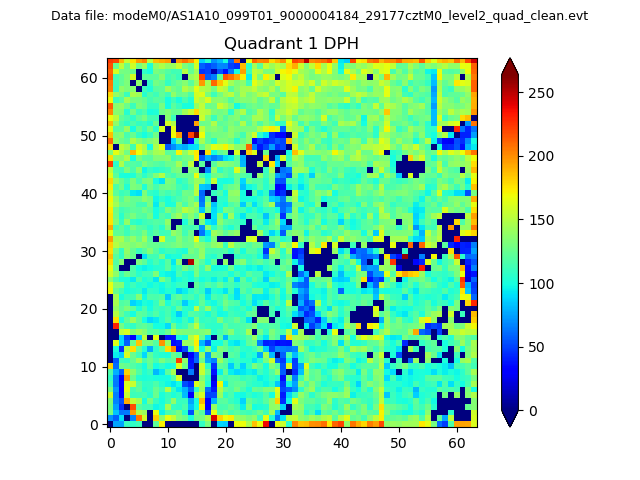 |
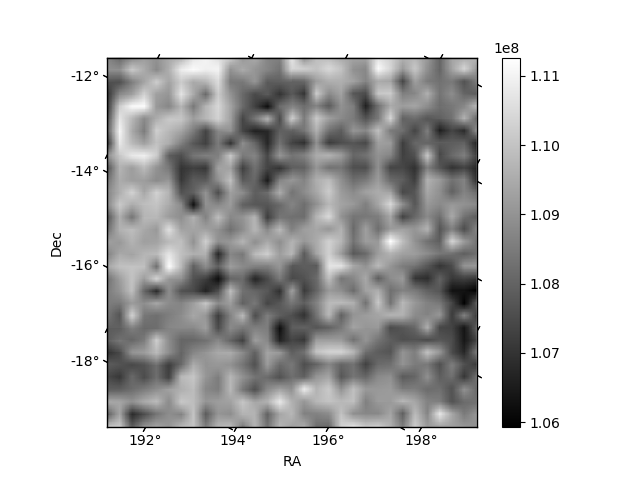
Quadrant B |
|---|---|---|---|
| Quadrant D |  |
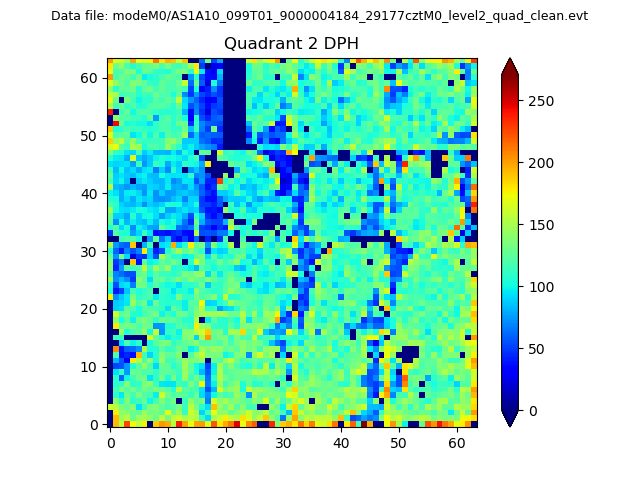 |
Quadrant C |
| Plot type | Count rate plots | Images |
|---|---|---|
| Comparison with Poisson distribution Blue bars denote a histogram of data divided into 1 sec bins. Red curve is a Poisson curve with rate = median count rate of data. |
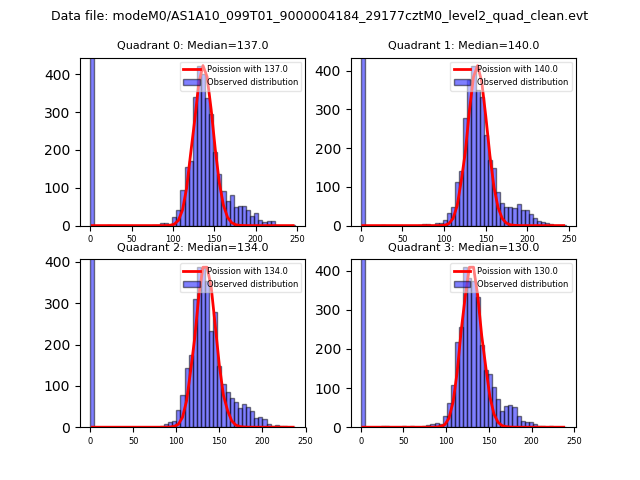 |
 |
| Quadrant-wise count rates Data is divided into 100 sec bins |
 |
|
| Module-wise count rates for Quadrant A Data is divided into 100 sec bins |
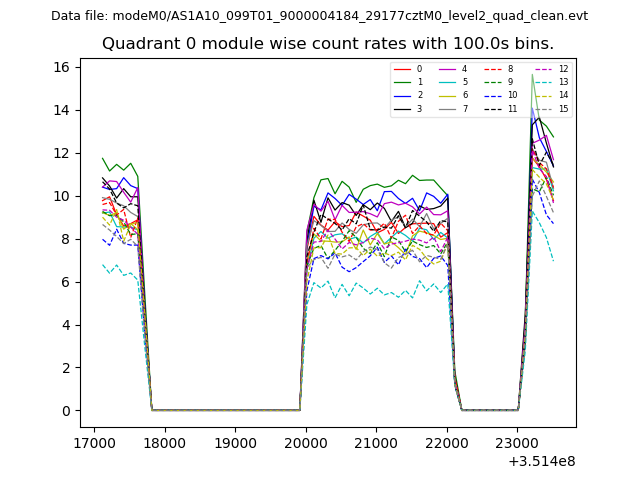 |
 |
| Module-wise count rates for Quadrant B Data is divided into 100 sec bins |
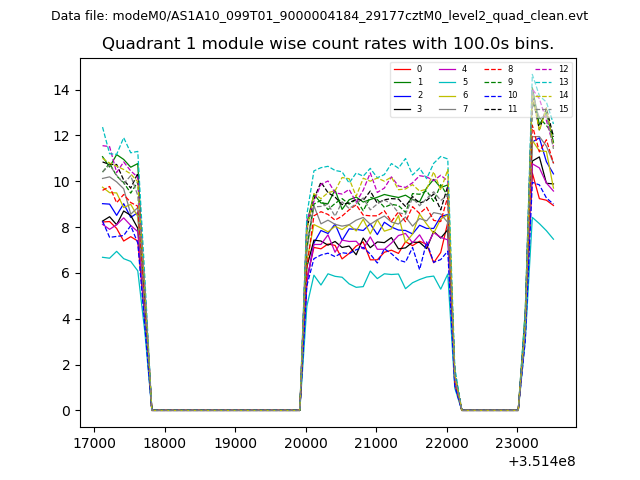 |
 |
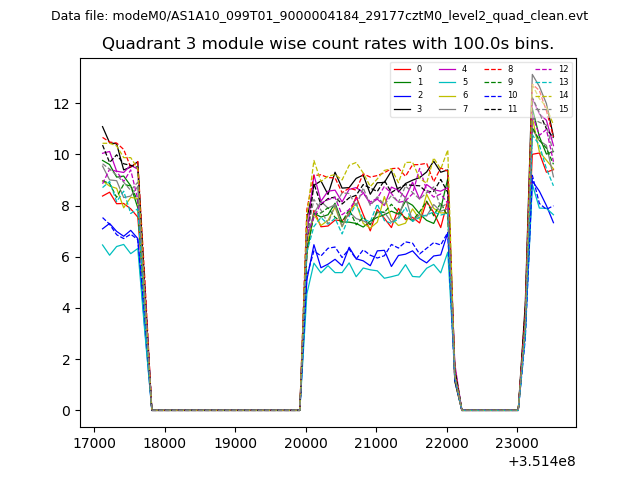
| Module-wise count rates for Quadrant C Data is divided into 100 sec bins |
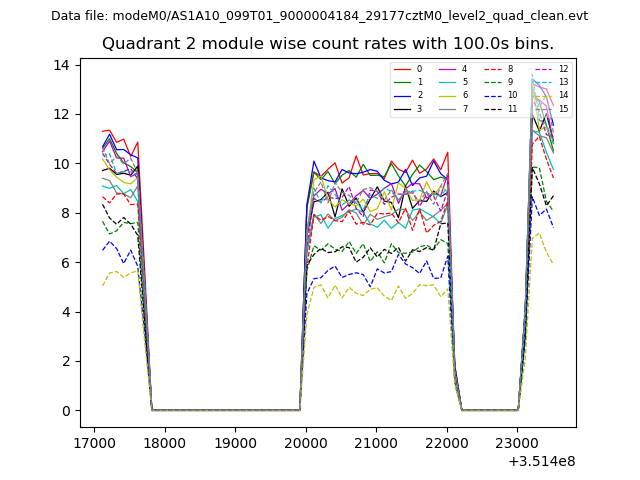 |
 |
| Module-wise count rates for Quadrant D Data is divided into 100 sec bins |
 |
 |
| Parameter | Plot |
|---|---|
| CZT HV Monitor | 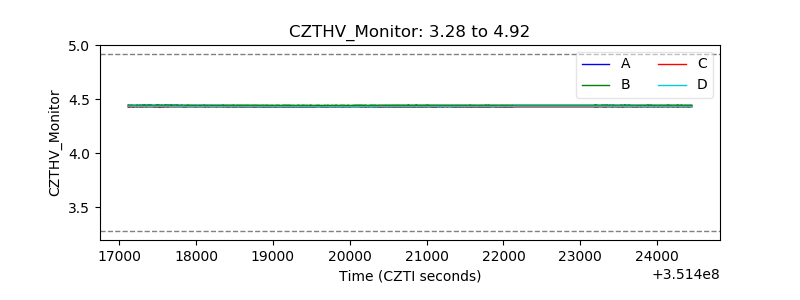 |
| D_VDD | 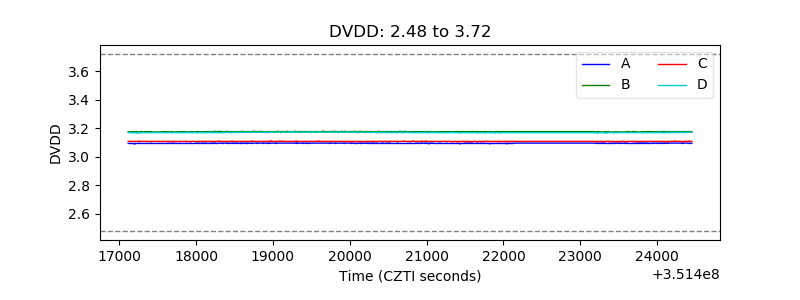 |
| Temperature 1 | 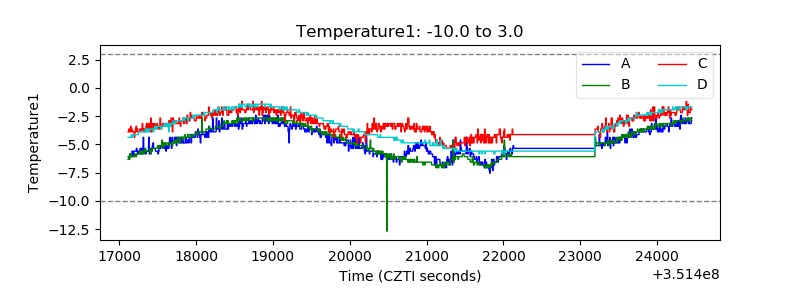 |
| Veto HV Monitor | 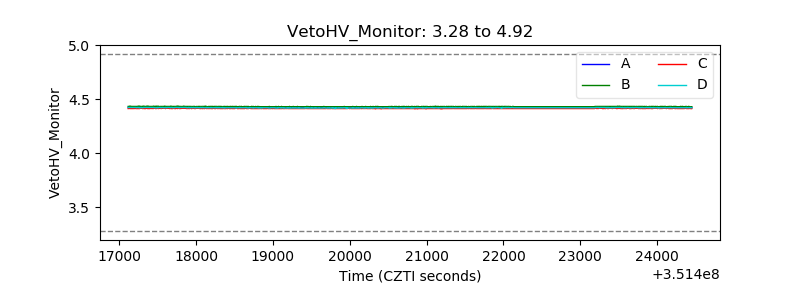 |
| Veto LLD | 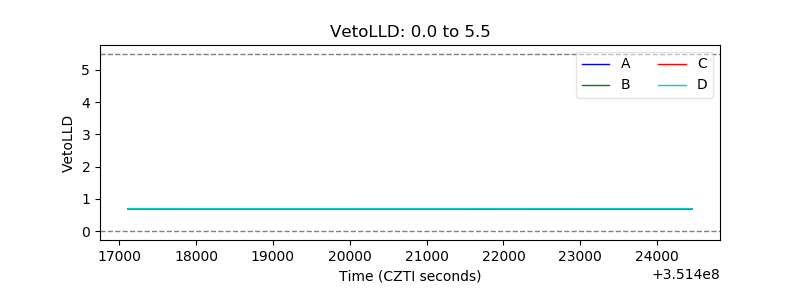 |
| Alpha Counter | 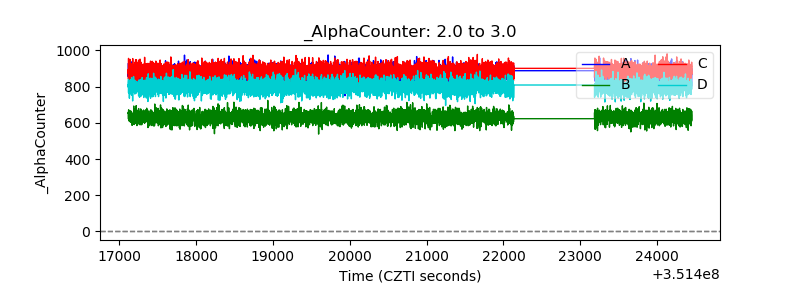 |
| _CPM_Rate | 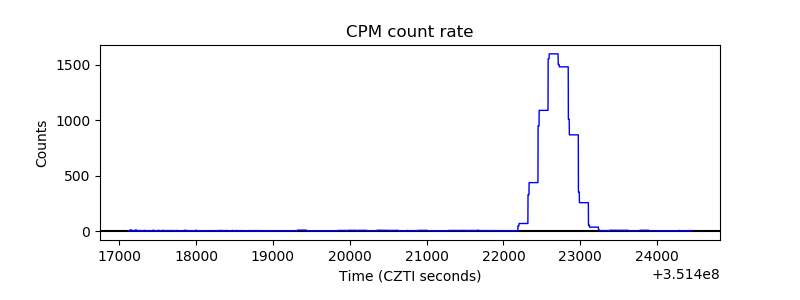 |
| CZT Counter | 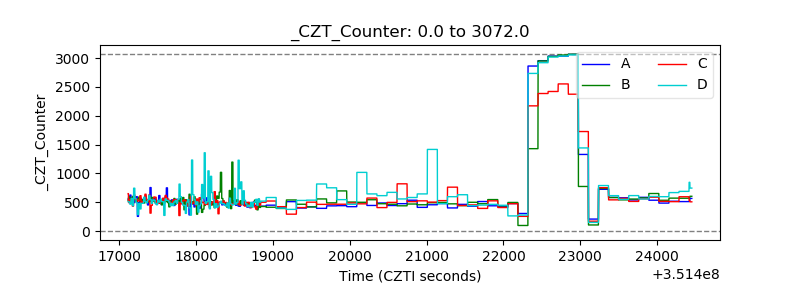 |
| +2.5 Volts monitor |  |
| +5 Volts monitor |  |
| _ROLL_ROT | 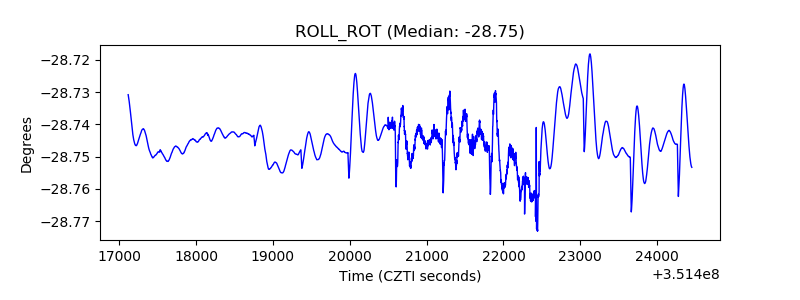 |
| _Roll_DEC | 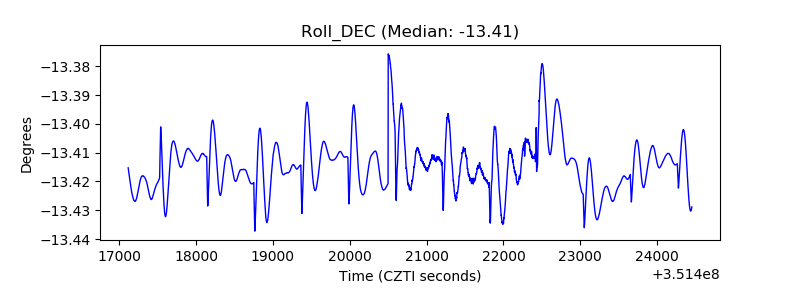 |
| _Roll_RA |  |
| Veto Counter | 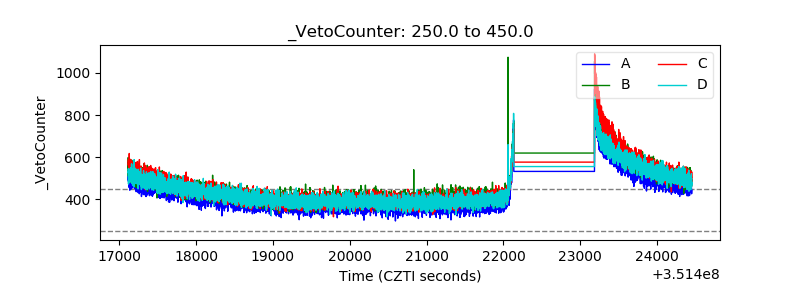 |