| Param | Original file | Final file |
|---|---|---|
| Filename | modeM0/AS1A10_099T01_9000004184_29180cztM0_level2.evt | modeM0/AS1A10_099T01_9000004184_29180cztM0_level2_quad_clean.evt |
| Size (bytes) | 271,788,480 | 31,602,240 |
| Size | 259.2 MB | 30.1 MB |
| Events in quadrant A | 1,898,730 | 181,316 |
| Events in quadrant B | 1,976,945 | 181,943 |
| Events in quadrant C | 1,918,710 | 173,833 |
| Events in quadrant D | 2,198,065 | 171,680 |
| Mode M9 | |||
|---|---|---|---|
| Quadrant | BADHDUFLAG | Total packets | Discarded packets |
| A | 0 | 2 | 0 |
| B | 0 | 3 | 0 |
| C | 0 | 3 | 0 |
| D | 0 | 3 | 0 |
| Mode SS | |||
|---|---|---|---|
| Quadrant | BADHDUFLAG | Total packets | Discarded packets |
| A | 0 | 70 | 0 |
| B | 0 | 70 | 0 |
| C | 0 | 70 | 0 |
| D | 0 | 70 | 0 |
| Mode M0 | |||
|---|---|---|---|
| Quadrant | BADHDUFLAG | Total packets | Discarded packets |
| A | 0 | 7810 | 1 |
| B | 0 | 8130 | 1 |
| C | 0 | 7906 | 1 |
| D | 0 | 8893 | 1 |
| Quadrant | Total seconds | Saturated seconds | Saturation percentage |
|---|---|---|---|
| A | 3493 | 10 | 0.286287% |
| B | 3493 | 19 | 0.543945% |
| C | 3493 | 31 | 0.887489% |
| D | 3493 | 26 | 0.744346% |
Noise dominated data is calculated using 1-second bins in cleaned event files. If a bin has >2000 counts, and if more than 50% of those come from <1% of pixels, then it is considered to be noise-dominated and hence unusable.
| Quadrant | # 1 sec bins | Bins with >0 counts | Bins with >2000 counts | High rate bins dominated by noise | Noise dominated (total time) | Noise dominated (detector-on time) | Marked lightcurve |
|---|---|---|---|---|---|---|---|
| A | 3493 | 3492 | 0 | 0 | 0.00% | 0.00% | 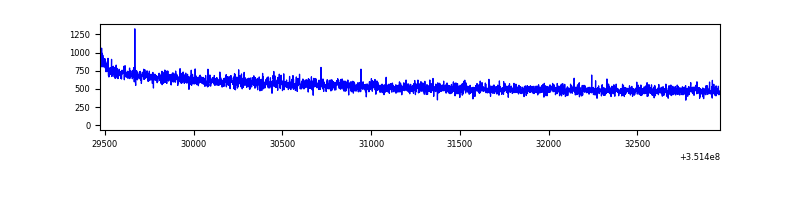 |
| B | 3493 | 3492 | 2 | 2 | 0.06% | 0.06% | 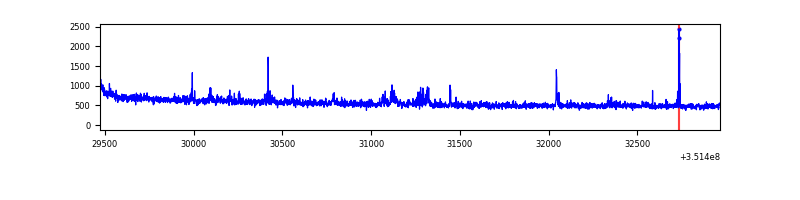 |
| C | 3493 | 3492 | 0 | 0 | 0.00% | 0.00% | 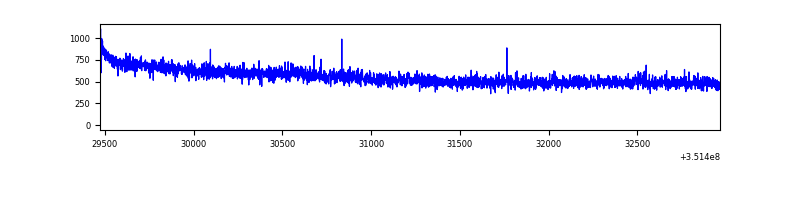 |
| D | 3493 | 3493 | 12 | 12 | 0.34% | 0.34% | 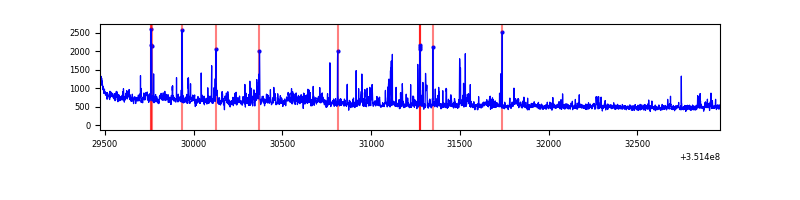 |
Top three noisy pixels from each quadrant. If the there are fewer than three noisy pixels in the level2.evt file, extra rows are filled as -1
| Pixel properties | Quadrant properties | ||||||
|---|---|---|---|---|---|---|---|
| Quadrant | DetID | PixID | Counts | Sigma | Mean | Median | Sigma |
| A | 13 | 254 | 6646 | 62.51 | 491 | 483 | 98.6 |
| A | 3 | 137 | 4272 | 38.43 | 491 | 483 | 98.6 |
| A | 0 | 226 | 4241 | 38.12 | 491 | 483 | 98.6 |
| B | 0 | 183 | 64621 | 703.31 | 483 | 473 | 91.2 |
| B | 10 | 245 | 12855 | 135.75 | 483 | 473 | 91.2 |
| B | 12 | 111 | 10633 | 111.39 | 483 | 473 | 91.2 |
| C | 14 | 238 | 77276 | 712.87 | 466 | 470 | 107.7 |
| C | 3 | 233 | 15763 | 141.94 | 466 | 470 | 107.7 |
| C | 2 | 114 | 8129 | 71.08 | 466 | 470 | 107.7 |
| D | 8 | 195 | 186334 | 1653.88 | 472 | 460 | 112.4 |
| D | 1 | 52 | 184253 | 1635.37 | 472 | 460 | 112.4 |
| D | 13 | 153 | 23541 | 205.37 | 472 | 460 | 112.4 |
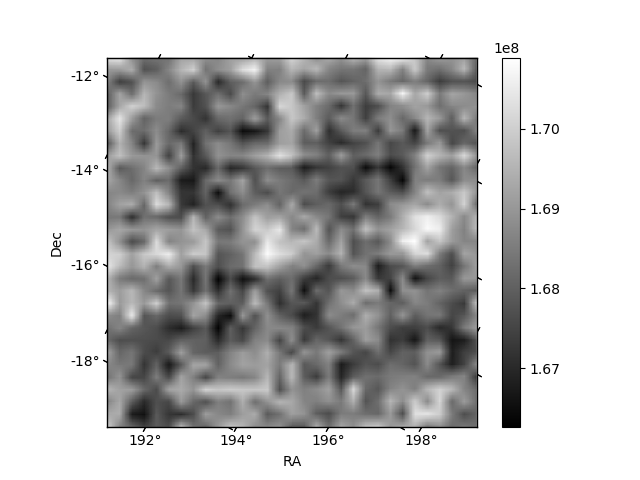
Histogram calculated using DETX and DETY for each event in the final _common_clean file
| Quadrant A | 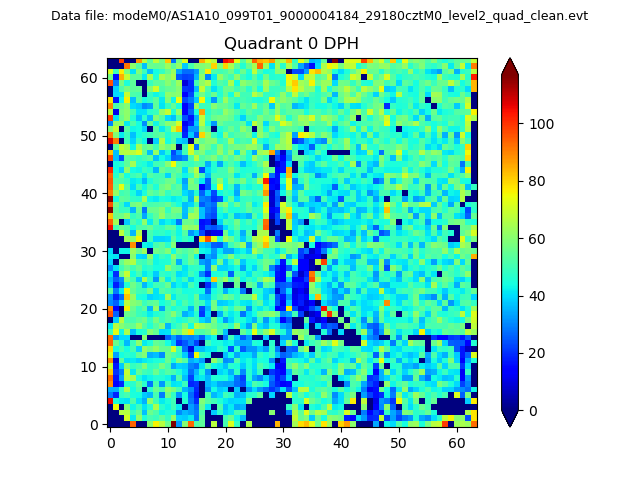 |
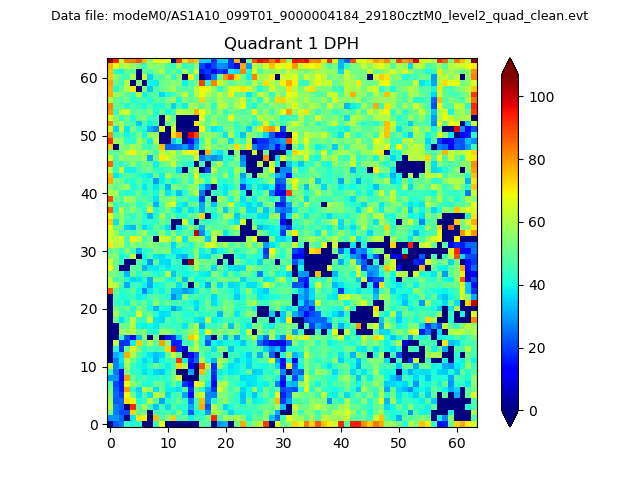 |
Quadrant B |
|---|---|---|---|
| Quadrant D | 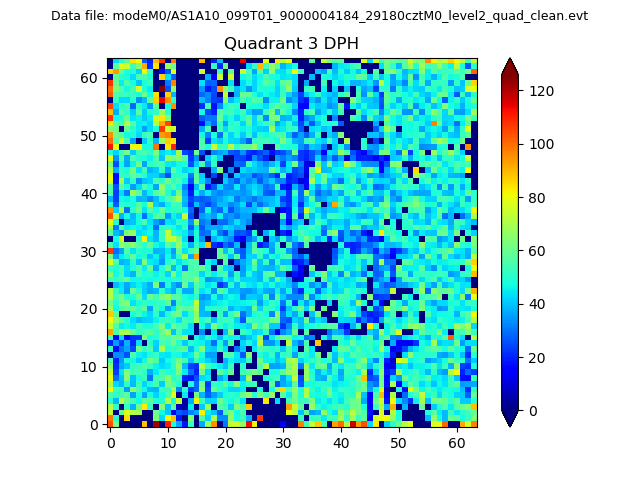 |
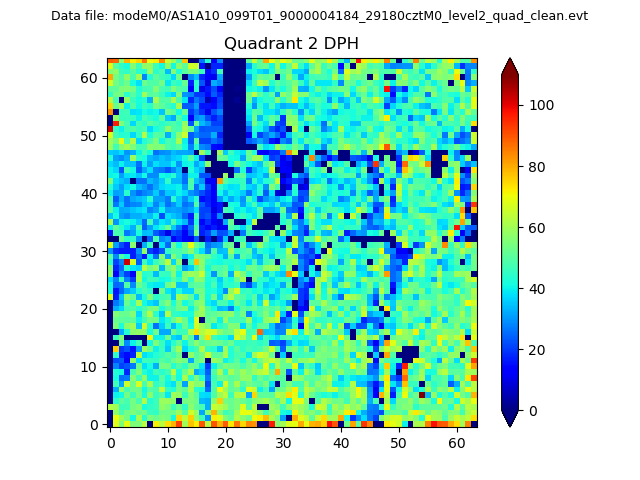 |
Quadrant C |
| Plot type | Count rate plots | Images |
|---|---|---|
| Comparison with Poisson distribution Blue bars denote a histogram of data divided into 1 sec bins. Red curve is a Poisson curve with rate = median count rate of data. |
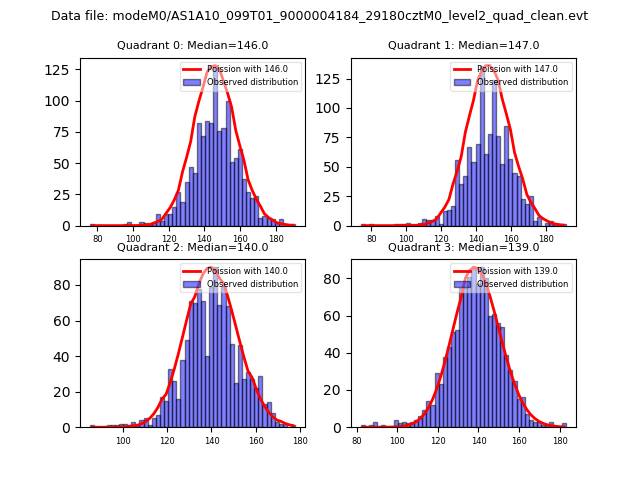 |
 |
| Quadrant-wise count rates Data is divided into 100 sec bins |
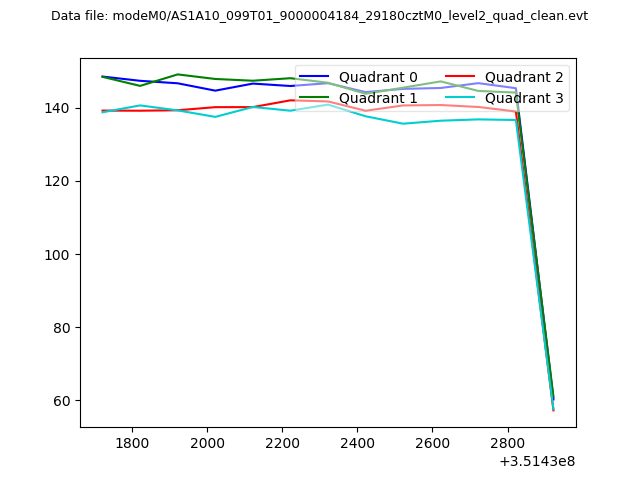 |
|
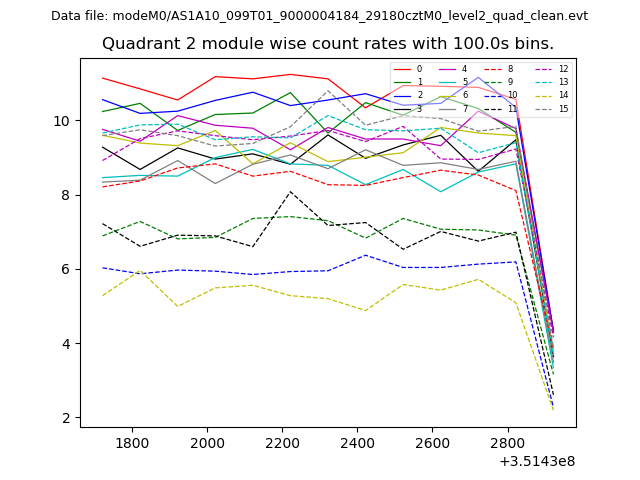
| Module-wise count rates for Quadrant A Data is divided into 100 sec bins |
 |
 |
| Module-wise count rates for Quadrant B Data is divided into 100 sec bins |
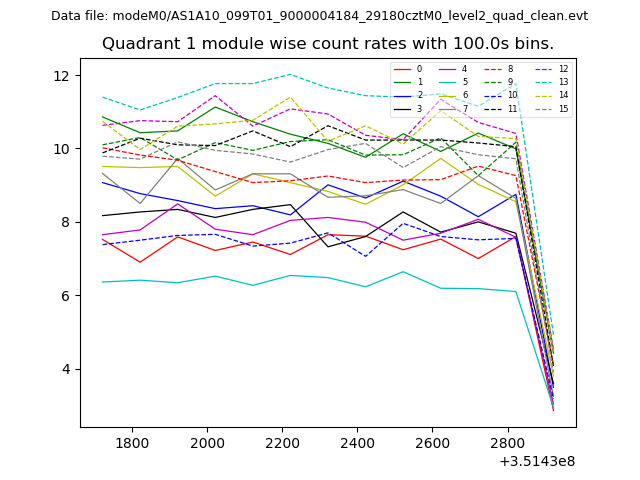 |
 |
| Module-wise count rates for Quadrant C Data is divided into 100 sec bins |
 |
 |
| Module-wise count rates for Quadrant D Data is divided into 100 sec bins |
 |
 |
| Parameter | Plot |
|---|---|
| CZT HV Monitor | 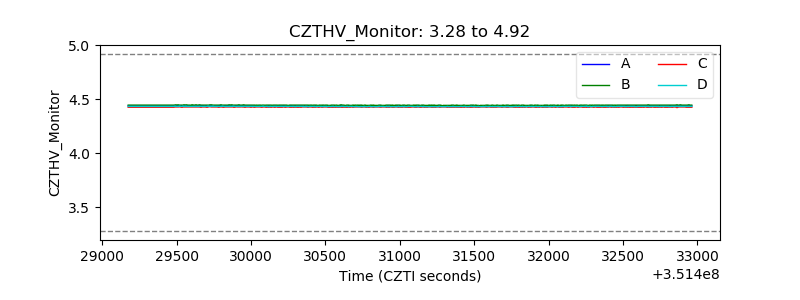 |
| D_VDD | 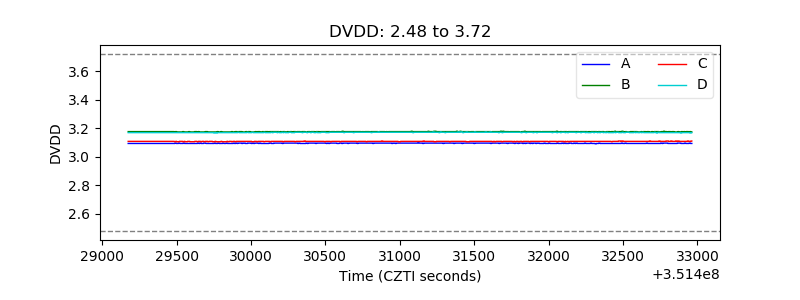 |
| Temperature 1 | 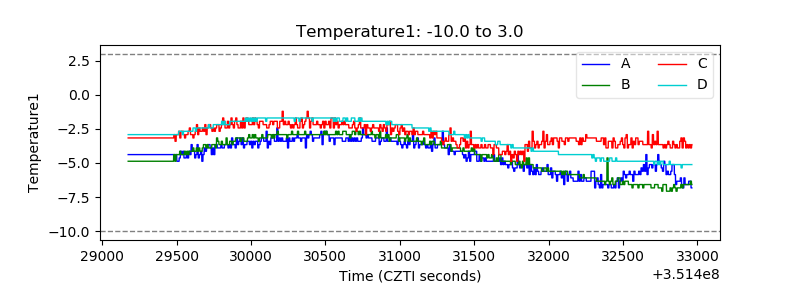 |
| Veto HV Monitor |  |
| Veto LLD | 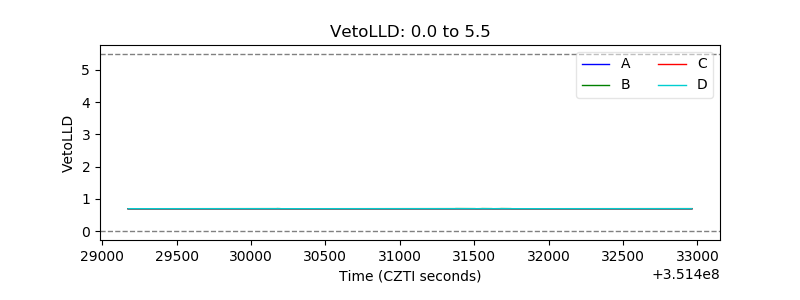 |
| Alpha Counter | 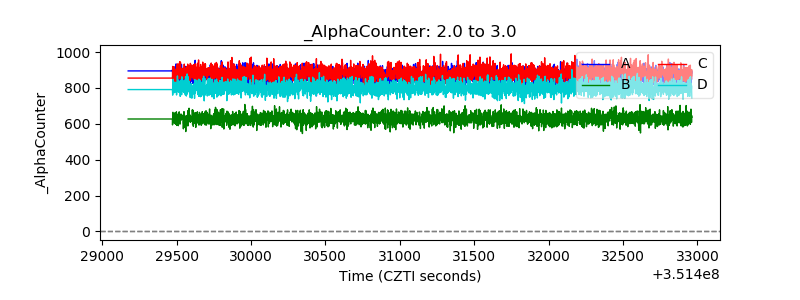 |
| _CPM_Rate | 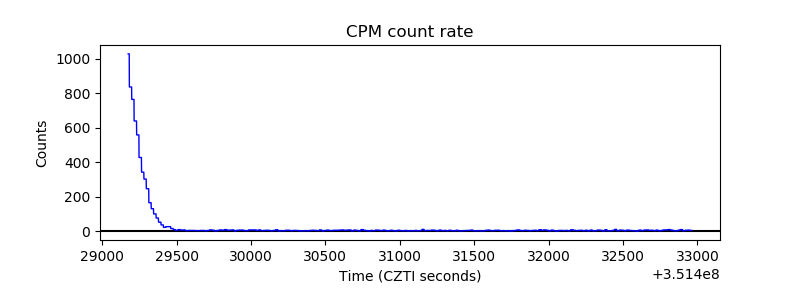 |
| CZT Counter | 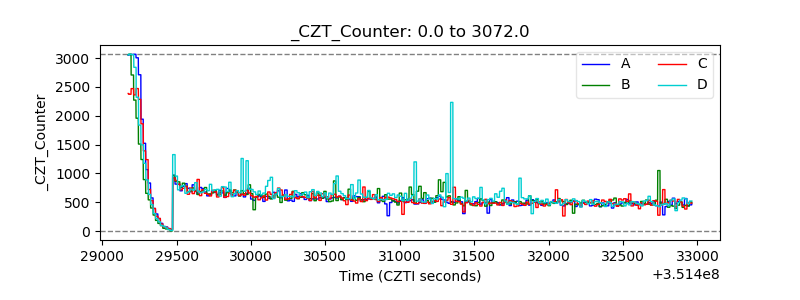 |
| +2.5 Volts monitor | 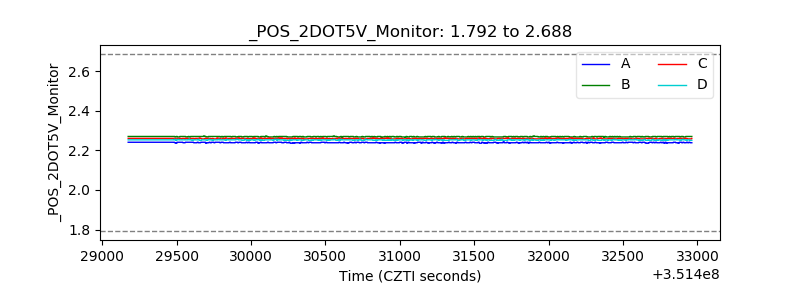 |
| +5 Volts monitor |  |
| _ROLL_ROT | 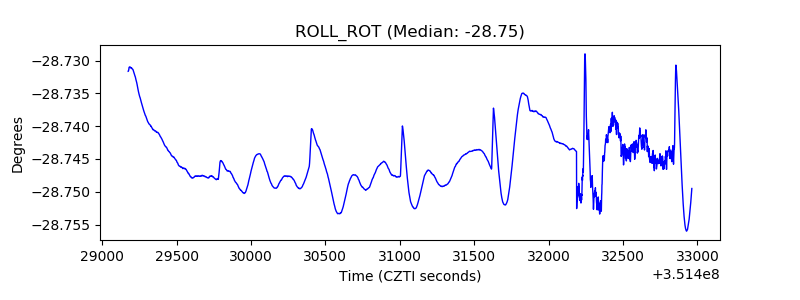 |
| _Roll_DEC | 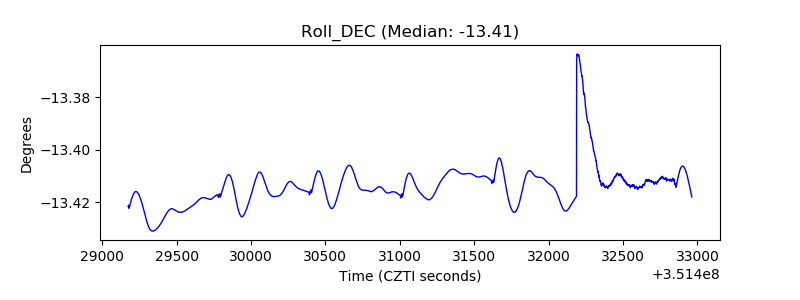 |
| _Roll_RA |  |
| Veto Counter | 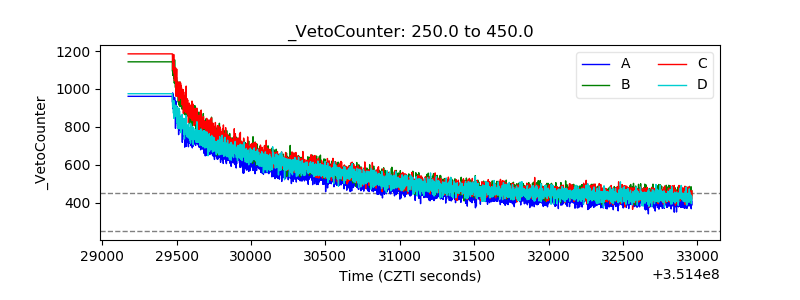 |