| Param | Original file | Final file |
|---|---|---|
| Filename | modeM0/AS1A10_021T08_9000004186_29181cztM0_level2.evt | modeM0/AS1A10_021T08_9000004186_29181cztM0_level2_quad_clean.evt |
| Size (bytes) | 538,588,800 | 76,619,520 |
| Size | 513.6 MB | 73.1 MB |
| Events in quadrant A | 3,591,972 | 475,732 |
| Events in quadrant B | 3,789,042 | 484,113 |
| Events in quadrant C | 3,783,802 | 466,101 |
| Events in quadrant D | 4,722,153 | 457,117 |
| Mode M9 | |||
|---|---|---|---|
| Quadrant | BADHDUFLAG | Total packets | Discarded packets |
| A | 0 | 23 | 0 |
| B | 0 | 24 | 0 |
| C | 0 | 24 | 0 |
| D | 0 | 24 | 0 |
| Mode SS | |||
|---|---|---|---|
| Quadrant | BADHDUFLAG | Total packets | Discarded packets |
| A | 0 | 128 | 0 |
| B | 0 | 128 | 0 |
| C | 0 | 128 | 0 |
| D | 0 | 128 | 0 |
| Mode M0 | |||
|---|---|---|---|
| Quadrant | BADHDUFLAG | Total packets | Discarded packets |
| A | 0 | 14861 | 2 |
| B | 0 | 15520 | 2 |
| C | 0 | 15512 | 2 |
| D | 0 | 18266 | 2 |
| Quadrant | Total seconds | Saturated seconds | Saturation percentage |
|---|---|---|---|
| A | 6258 | 100 | 1.597955% |
| B | 6258 | 133 | 2.125280% |
| C | 6258 | 169 | 2.700543% |
| D | 6258 | 294 | 4.697987% |
Noise dominated data is calculated using 1-second bins in cleaned event files. If a bin has >2000 counts, and if more than 50% of those come from <1% of pixels, then it is considered to be noise-dominated and hence unusable.
| Quadrant | # 1 sec bins | Bins with >0 counts | Bins with >2000 counts | High rate bins dominated by noise | Noise dominated (total time) | Noise dominated (detector-on time) | Marked lightcurve |
|---|---|---|---|---|---|---|---|
| A | 7588 | 6260 | 1 | 1 | 0.01% | 0.02% | 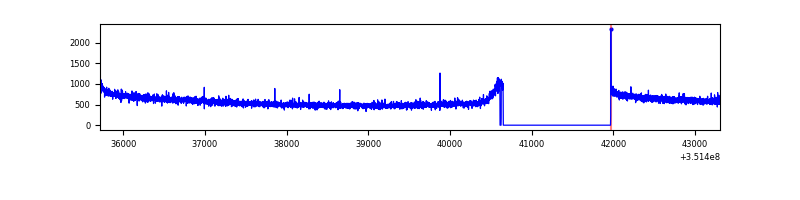 |
| B | 7588 | 6260 | 3 | 3 | 0.04% | 0.05% | 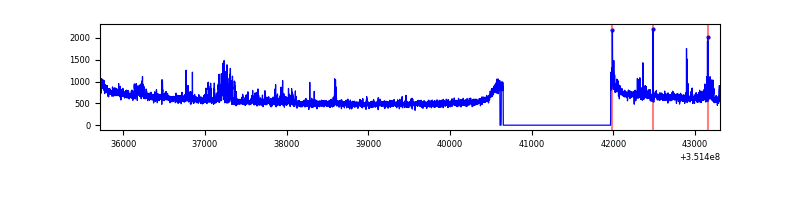 |
| C | 7588 | 6260 | 0 | 0 | 0.00% | 0.00% | 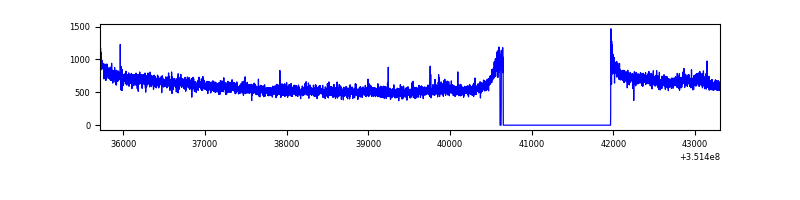 |
| D | 7588 | 6260 | 132 | 132 | 1.74% | 2.11% | 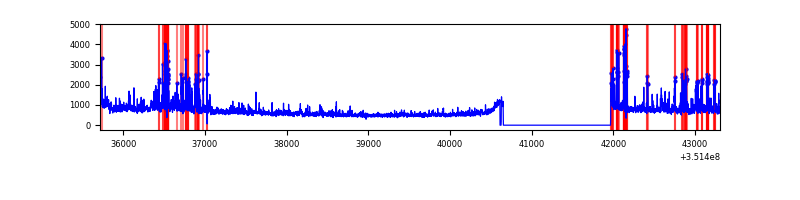 |
Top three noisy pixels from each quadrant. If the there are fewer than three noisy pixels in the level2.evt file, extra rows are filled as -1
| Pixel properties | Quadrant properties | ||||||
|---|---|---|---|---|---|---|---|
| Quadrant | DetID | PixID | Counts | Sigma | Mean | Median | Sigma |
| A | 13 | 254 | 12014 | 60.87 | 931 | 916 | 182.3 |
| A | 3 | 137 | 8168 | 39.78 | 931 | 916 | 182.3 |
| A | 0 | 226 | 7933 | 38.49 | 931 | 916 | 182.3 |
| B | 0 | 183 | 170292 | 998.61 | 918 | 898 | 169.6 |
| B | 12 | 111 | 19998 | 112.6 | 918 | 898 | 169.6 |
| B | 11 | 111 | 18194 | 101.96 | 918 | 898 | 169.6 |
| C | 14 | 238 | 147539 | 711.12 | 900 | 911 | 206.2 |
| C | 3 | 233 | 116831 | 562.19 | 900 | 911 | 206.2 |
| C | 2 | 114 | 14949 | 68.08 | 900 | 911 | 206.2 |
| D | 1 | 52 | 612003 | 2897.43 | 895 | 876 | 210.9 |
| D | 8 | 195 | 429615 | 2032.71 | 895 | 876 | 210.9 |
| D | 2 | 120 | 117677 | 553.77 | 895 | 876 | 210.9 |
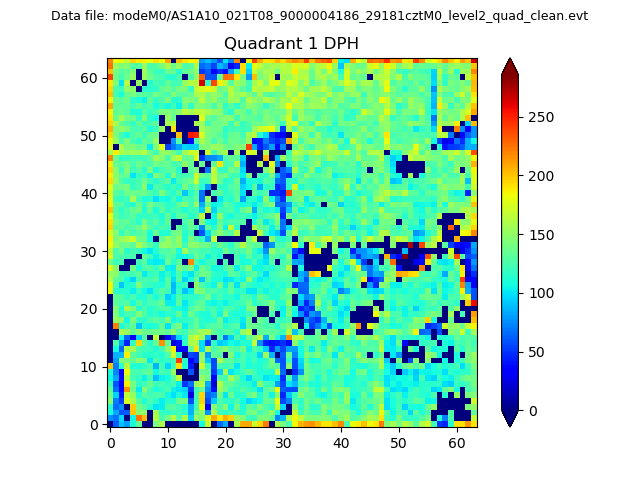
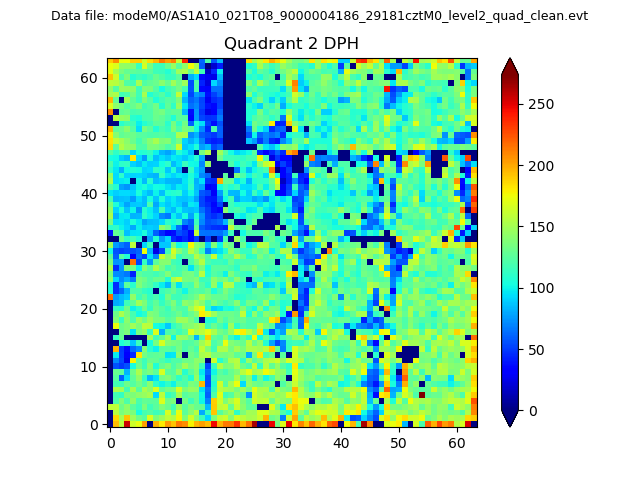
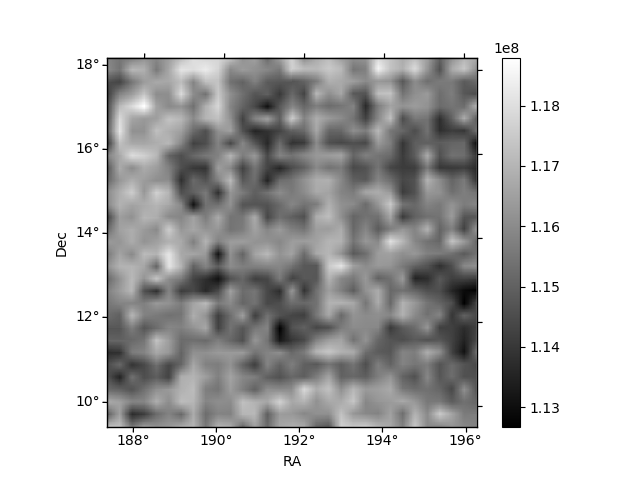
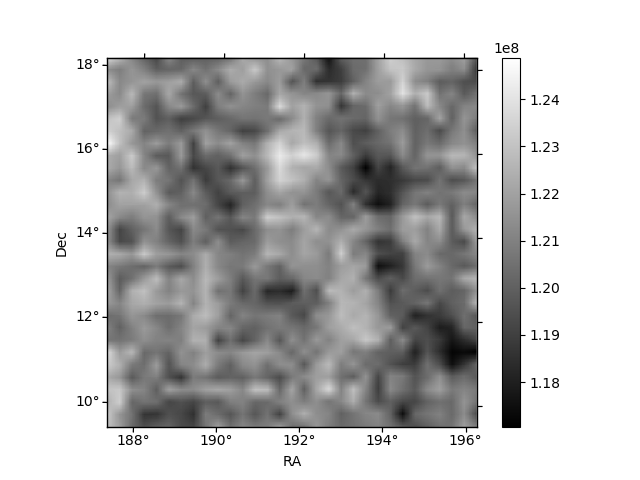
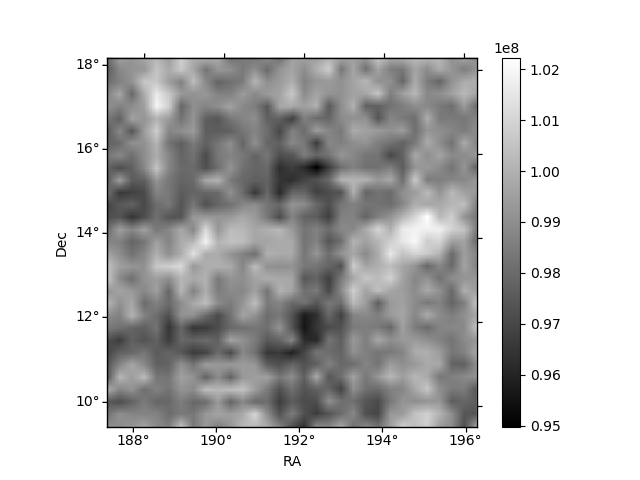
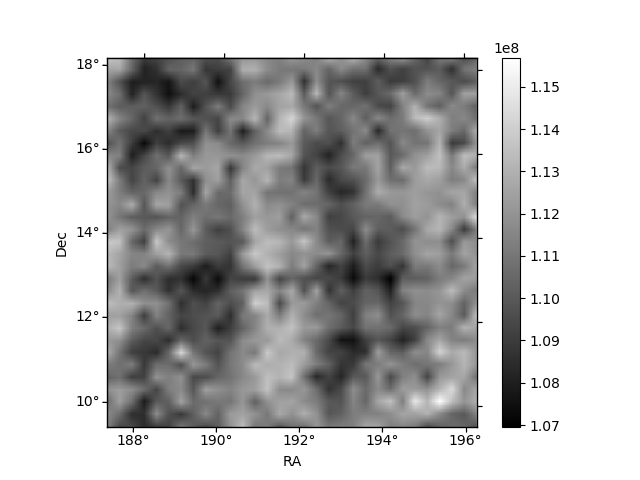
Histogram calculated using DETX and DETY for each event in the final _common_clean file
| Quadrant A |  |
 |
Quadrant B |
|---|---|---|---|
| Quadrant D |  |
 |
Quadrant C |
| Plot type | Count rate plots | Images |
|---|---|---|
| Comparison with Poisson distribution Blue bars denote a histogram of data divided into 1 sec bins. Red curve is a Poisson curve with rate = median count rate of data. |
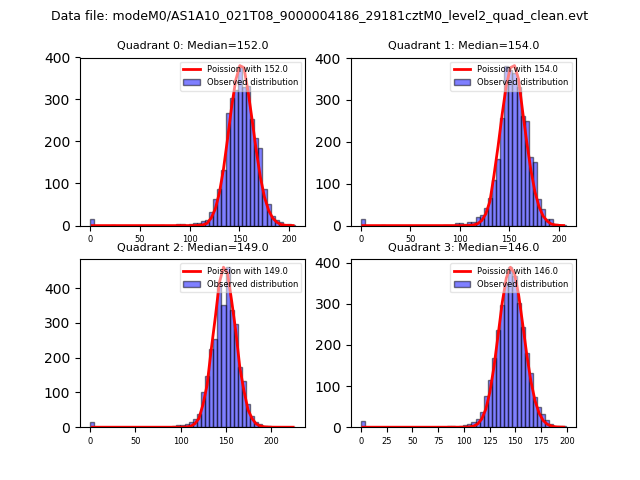 |
 |
| Quadrant-wise count rates Data is divided into 100 sec bins |
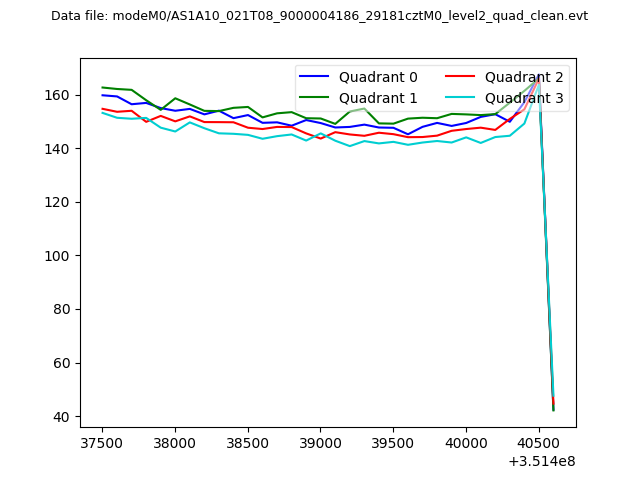 |
|
| Module-wise count rates for Quadrant A Data is divided into 100 sec bins |
 |
 |
| Module-wise count rates for Quadrant B Data is divided into 100 sec bins |
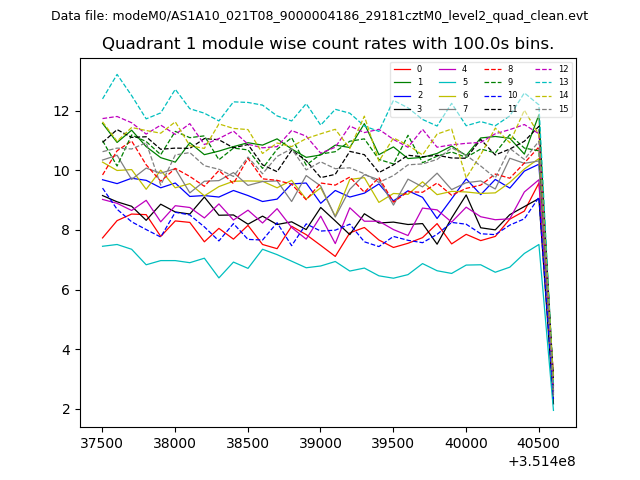 |
 |
| Module-wise count rates for Quadrant C Data is divided into 100 sec bins |
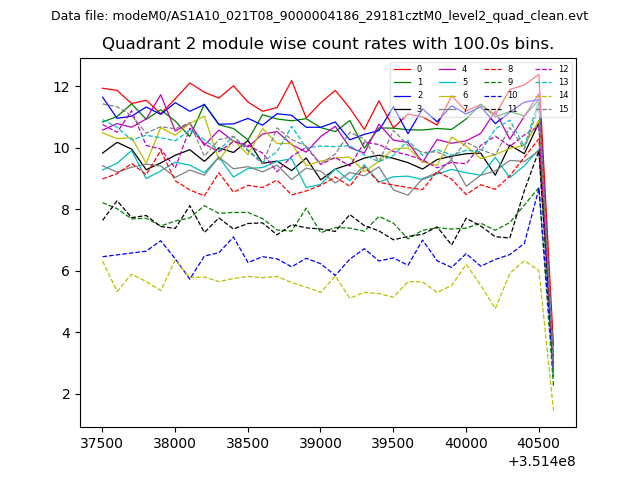 |
 |
| Module-wise count rates for Quadrant D Data is divided into 100 sec bins |
 |
 |
| Parameter | Plot |
|---|---|
| CZT HV Monitor |  |
| D_VDD |  |
| Temperature 1 | 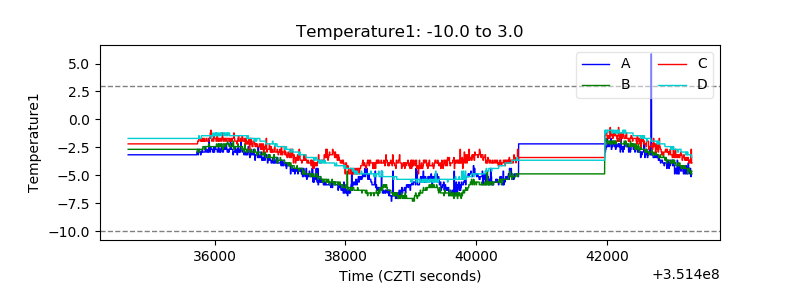 |
| Veto HV Monitor | 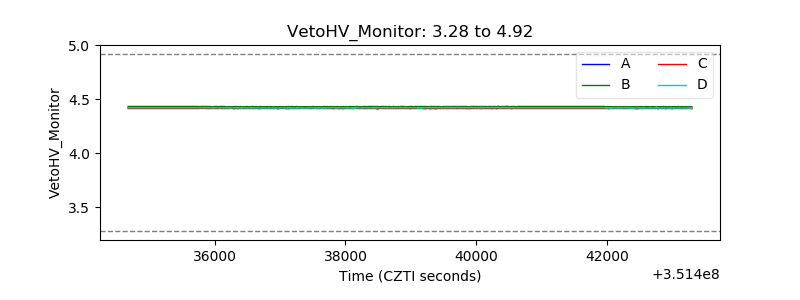 |
| Veto LLD |  |
| Alpha Counter | 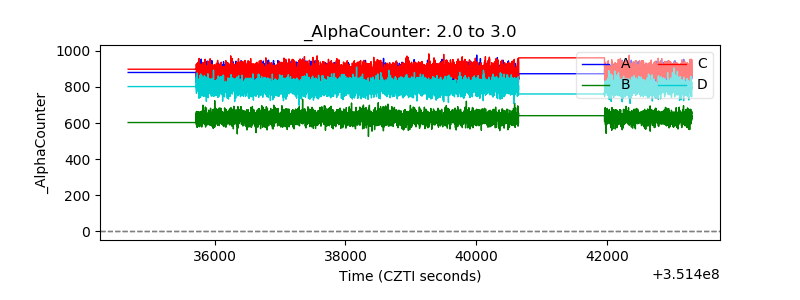 |
| _CPM_Rate | 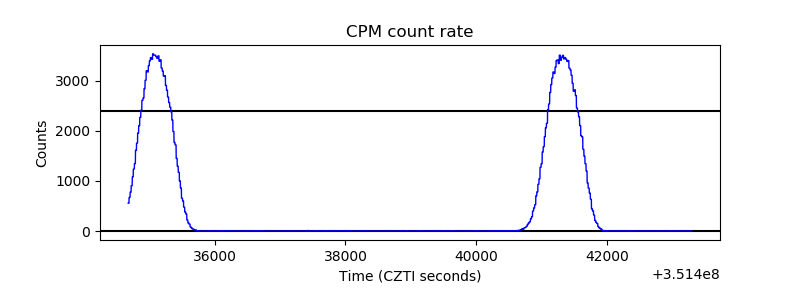 |
| CZT Counter |  |
| +2.5 Volts monitor |  |
| +5 Volts monitor |  |
| _ROLL_ROT | 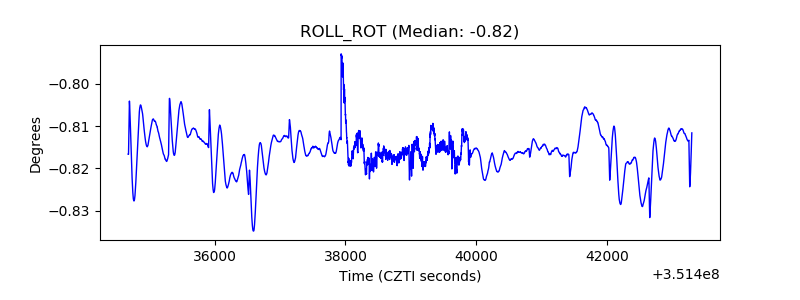 |
| _Roll_DEC | 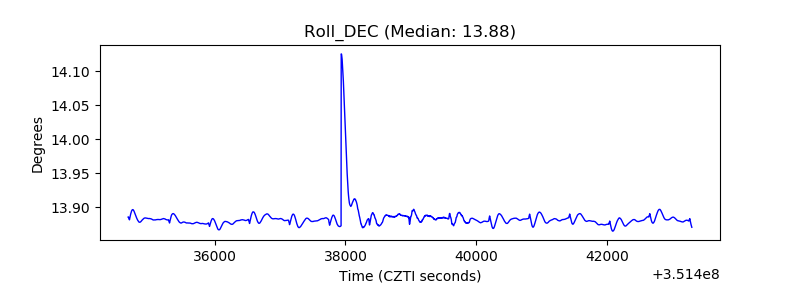 |
| _Roll_RA | 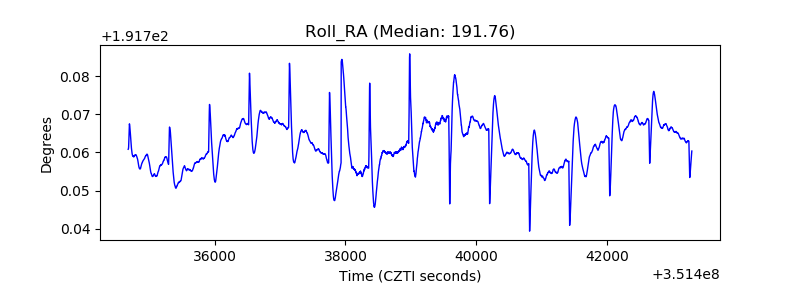 |
| Veto Counter |  |