| Param | Original file | Final file |
|---|---|---|
| Filename | modeM0/AS1A10_021T08_9000004186_29182cztM0_level2.evt | modeM0/AS1A10_021T08_9000004186_29182cztM0_level2_quad_clean.evt |
| Size (bytes) | 525,873,600 | 92,508,480 |
| Size | 501.5 MB | 88.2 MB |
| Events in quadrant A | 3,465,942 | 594,458 |
| Events in quadrant B | 3,681,132 | 609,930 |
| Events in quadrant C | 3,747,067 | 587,538 |
| Events in quadrant D | 4,608,674 | 573,574 |
| Mode M9 | |||
|---|---|---|---|
| Quadrant | BADHDUFLAG | Total packets | Discarded packets |
| A | 0 | 21 | 0 |
| B | 0 | 22 | 0 |
| C | 0 | 22 | 0 |
| D | 0 | 22 | 0 |
| Mode SS | |||
|---|---|---|---|
| Quadrant | BADHDUFLAG | Total packets | Discarded packets |
| A | 0 | 128 | 0 |
| B | 0 | 128 | 0 |
| C | 0 | 128 | 0 |
| D | 0 | 128 | 0 |
| Mode M0 | |||
|---|---|---|---|
| Quadrant | BADHDUFLAG | Total packets | Discarded packets |
| A | 0 | 14336 | 2 |
| B | 0 | 15132 | 2 |
| C | 0 | 15346 | 2 |
| D | 0 | 17975 | 2 |
| Quadrant | Total seconds | Saturated seconds | Saturation percentage |
|---|---|---|---|
| A | 6242 | 78 | 1.249599% |
| B | 6242 | 126 | 2.018584% |
| C | 6242 | 169 | 2.707466% |
| D | 6242 | 251 | 4.021147% |
Noise dominated data is calculated using 1-second bins in cleaned event files. If a bin has >2000 counts, and if more than 50% of those come from <1% of pixels, then it is considered to be noise-dominated and hence unusable.
| Quadrant | # 1 sec bins | Bins with >0 counts | Bins with >2000 counts | High rate bins dominated by noise | Noise dominated (total time) | Noise dominated (detector-on time) | Marked lightcurve |
|---|---|---|---|---|---|---|---|
| A | 7607 | 6243 | 1 | 1 | 0.01% | 0.02% | 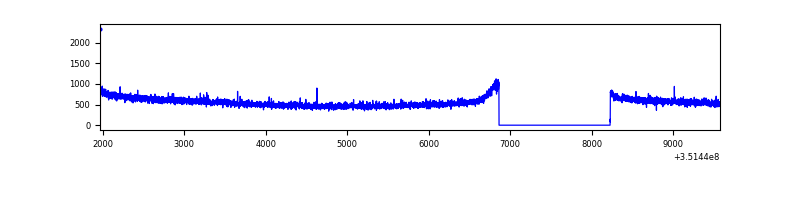 |
| B | 7607 | 6243 | 8 | 8 | 0.11% | 0.13% | 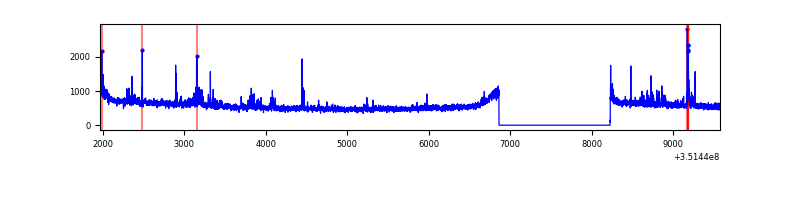 |
| C | 7607 | 6243 | 0 | 0 | 0.00% | 0.00% | 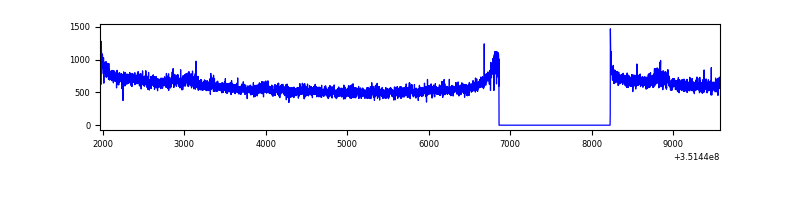 |
| D | 7607 | 6243 | 125 | 125 | 1.64% | 2.00% | 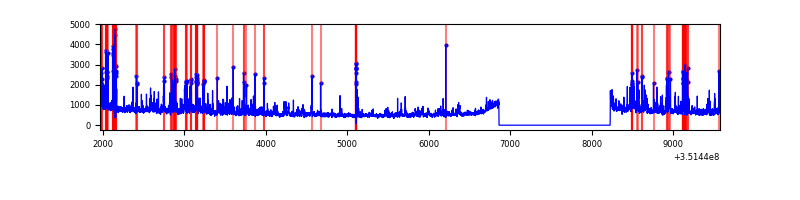 |
Top three noisy pixels from each quadrant. If the there are fewer than three noisy pixels in the level2.evt file, extra rows are filled as -1
| Pixel properties | Quadrant properties | ||||||
|---|---|---|---|---|---|---|---|
| Quadrant | DetID | PixID | Counts | Sigma | Mean | Median | Sigma |
| A | 13 | 254 | 12270 | 64.02 | 897 | 884 | 177.8 |
| A | 3 | 137 | 8175 | 41.0 | 897 | 884 | 177.8 |
| A | 0 | 226 | 7519 | 37.31 | 897 | 884 | 177.8 |
| B | 0 | 183 | 111834 | 668.24 | 894 | 874 | 166.0 |
| B | 5 | 255 | 43194 | 254.87 | 894 | 874 | 166.0 |
| B | 12 | 111 | 19832 | 114.17 | 894 | 874 | 166.0 |
| C | 3 | 233 | 181209 | 896.24 | 874 | 887 | 201.2 |
| C | 14 | 238 | 142605 | 704.37 | 874 | 887 | 201.2 |
| C | 2 | 114 | 15330 | 71.78 | 874 | 887 | 201.2 |
| D | 1 | 52 | 575415 | 2798.51 | 870 | 851 | 205.3 |
| D | 8 | 195 | 486016 | 2363.08 | 870 | 851 | 205.3 |
| D | 13 | 153 | 91517 | 441.6 | 870 | 851 | 205.3 |
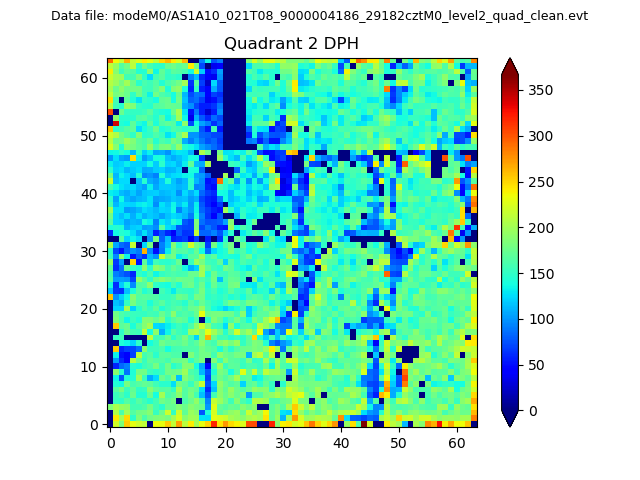
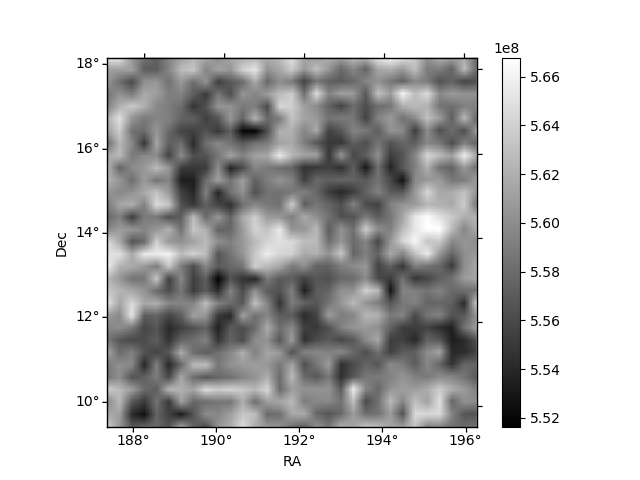
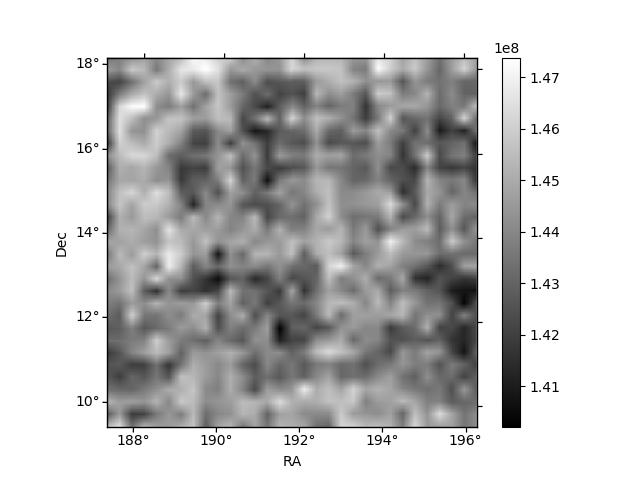
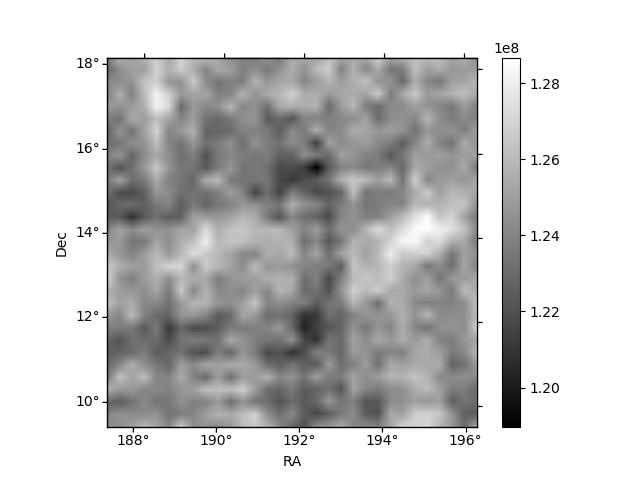
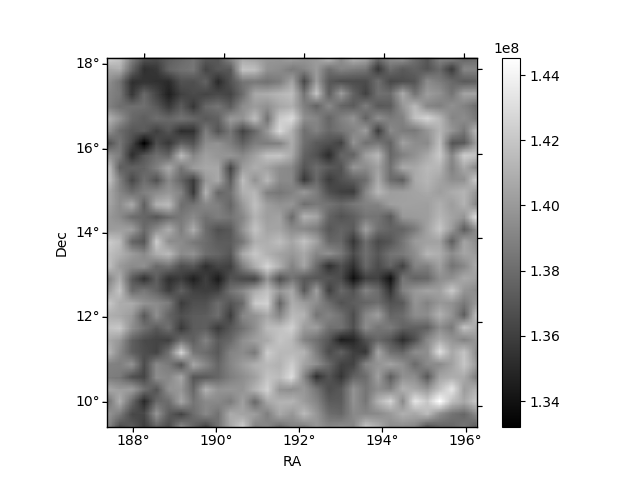
Histogram calculated using DETX and DETY for each event in the final _common_clean file
| Quadrant A | 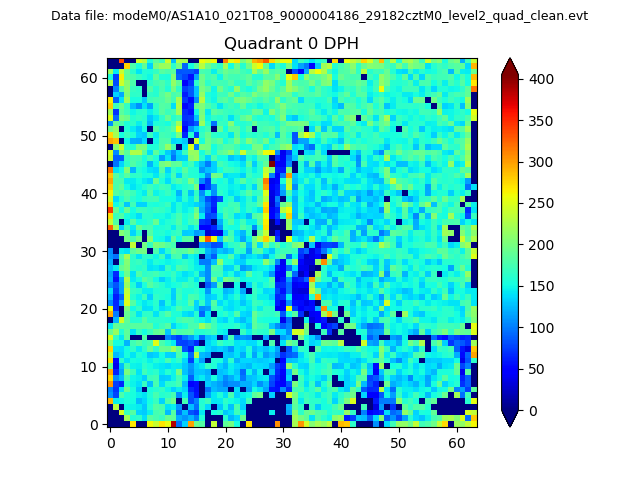 |
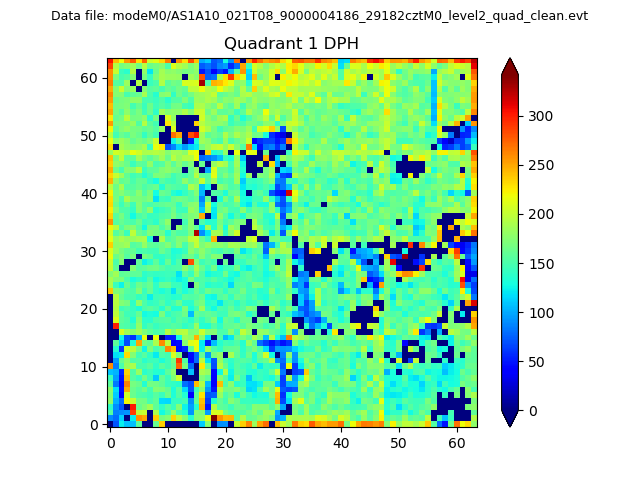 |
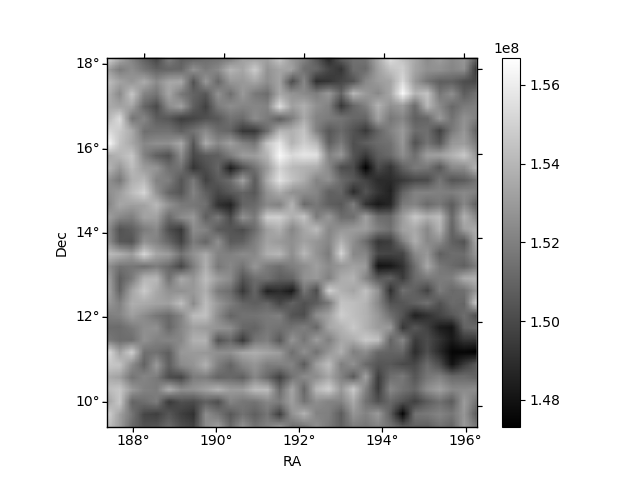
Quadrant B |
|---|---|---|---|
| Quadrant D | 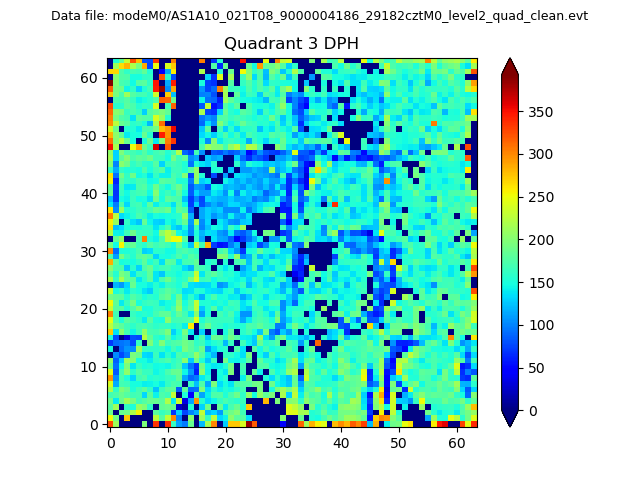 |
 |
Quadrant C |
| Plot type | Count rate plots | Images |
|---|---|---|
| Comparison with Poisson distribution Blue bars denote a histogram of data divided into 1 sec bins. Red curve is a Poisson curve with rate = median count rate of data. |
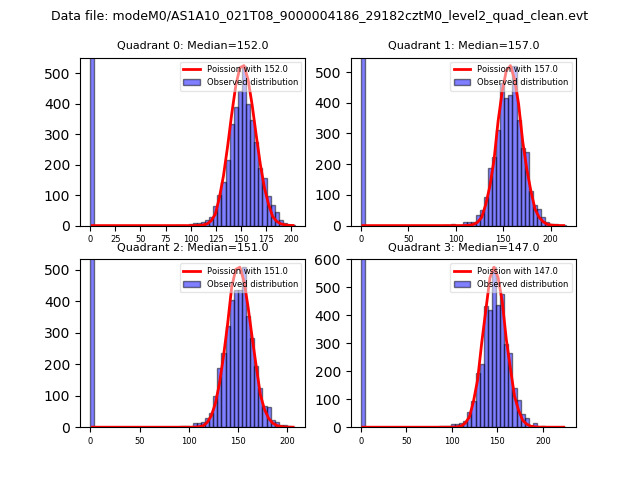 |
 |
| Quadrant-wise count rates Data is divided into 100 sec bins |
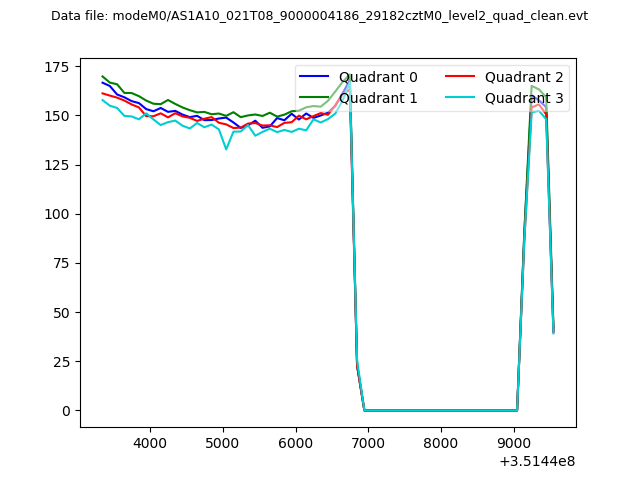 |
|
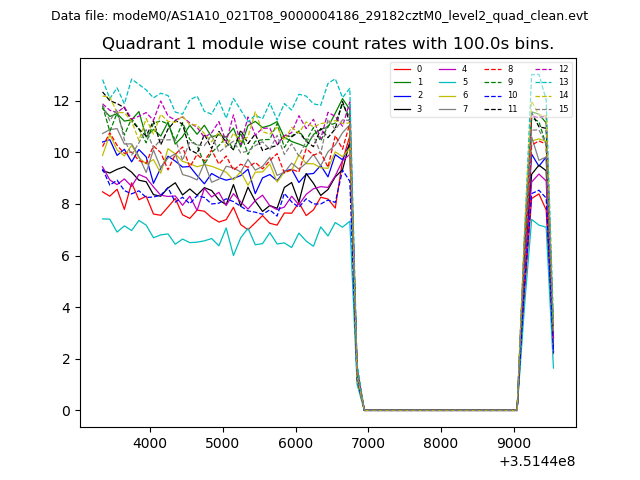
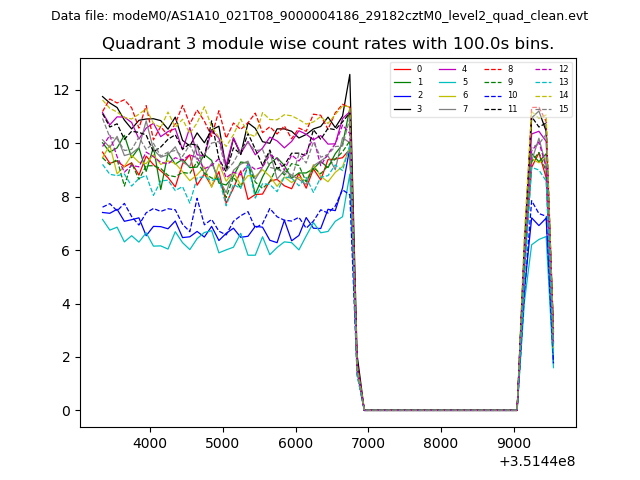
| Module-wise count rates for Quadrant A Data is divided into 100 sec bins |
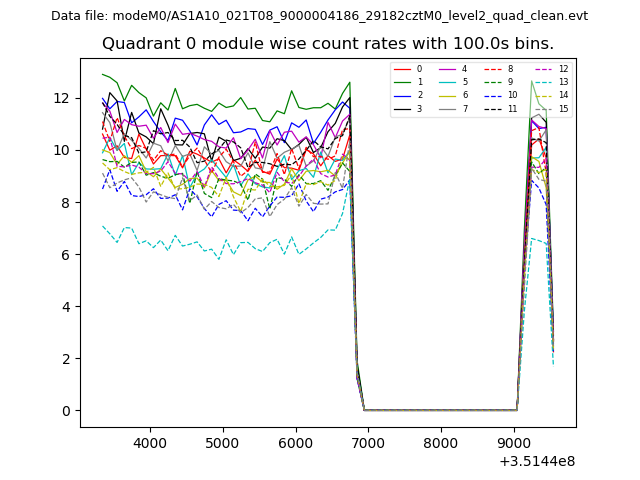 |
 |
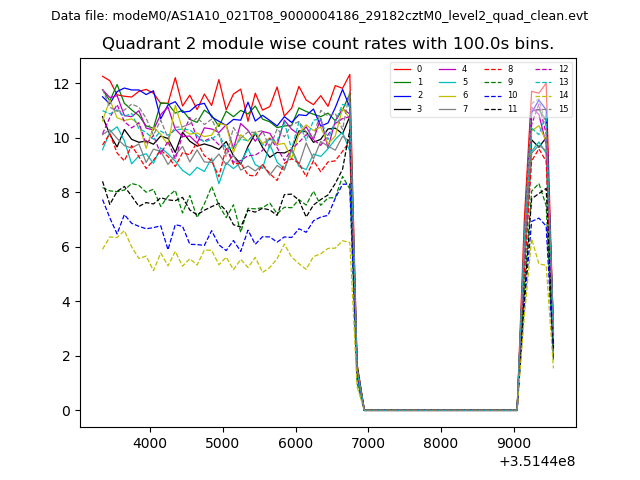
| Module-wise count rates for Quadrant B Data is divided into 100 sec bins |
 |
 |
| Module-wise count rates for Quadrant C Data is divided into 100 sec bins |
 |
 |
| Module-wise count rates for Quadrant D Data is divided into 100 sec bins |
 |
 |
| Parameter | Plot |
|---|---|
| CZT HV Monitor | 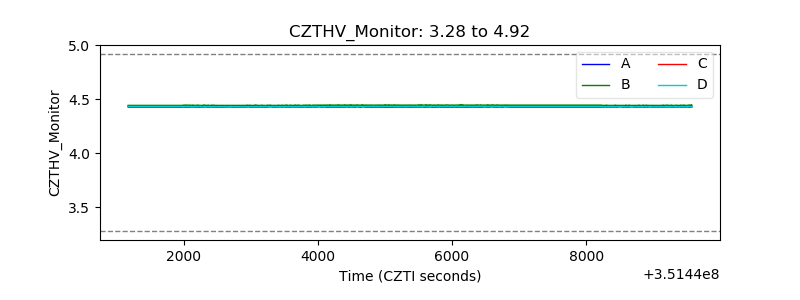 |
| D_VDD | 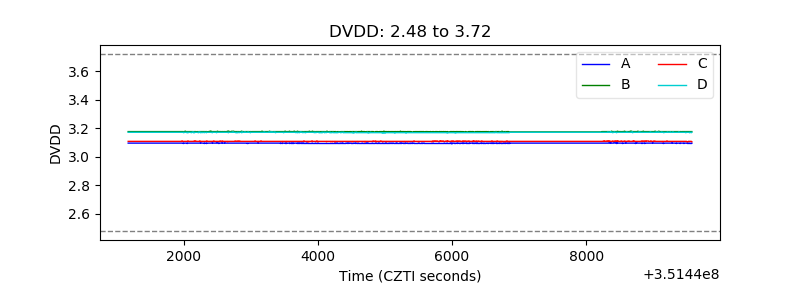 |
| Temperature 1 | 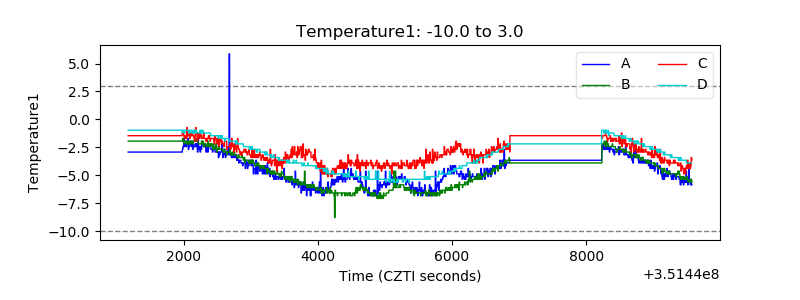 |
| Veto HV Monitor | 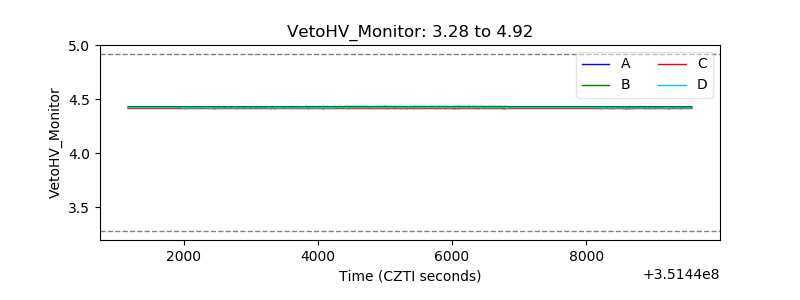 |
| Veto LLD | 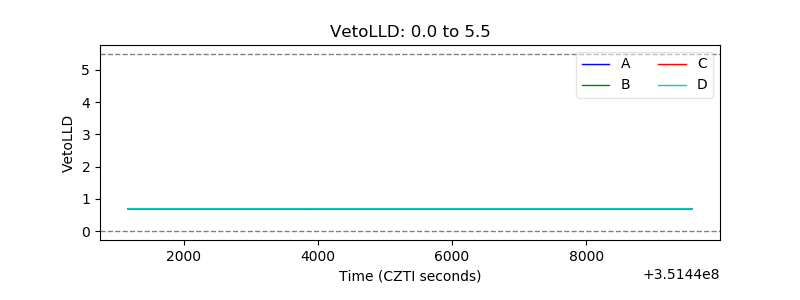 |
| Alpha Counter | 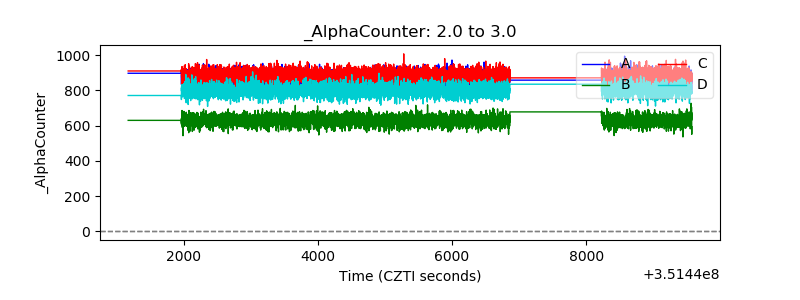 |
| _CPM_Rate | 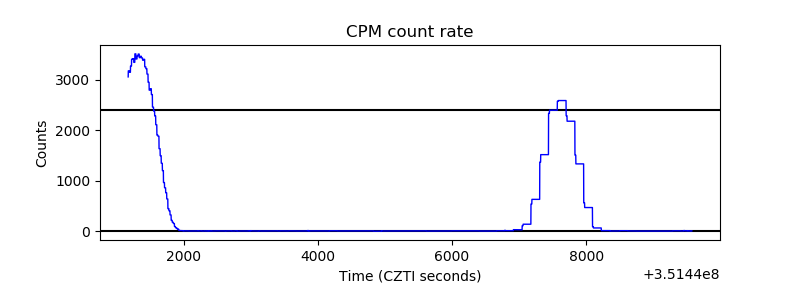 |
| CZT Counter | 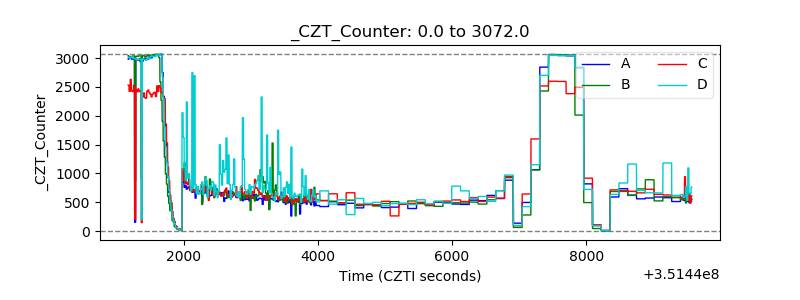 |
| +2.5 Volts monitor | 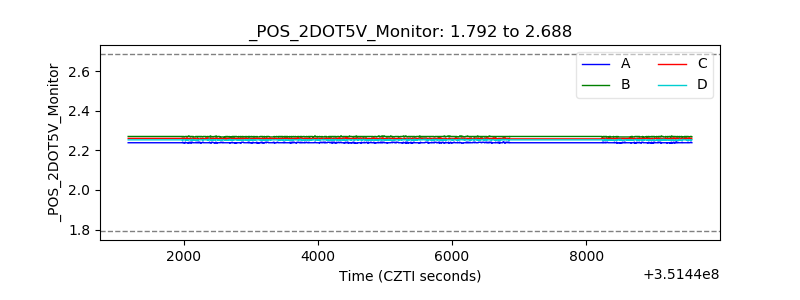 |
| +5 Volts monitor | 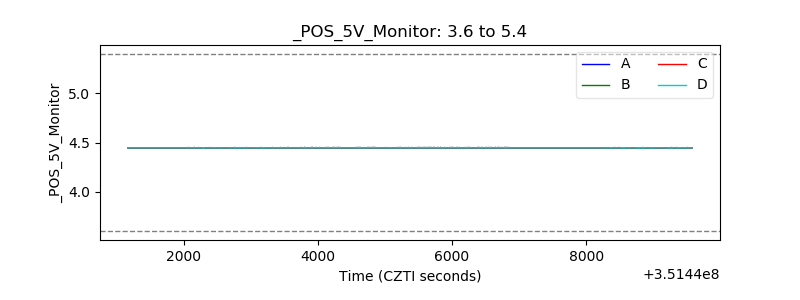 |
| _ROLL_ROT | 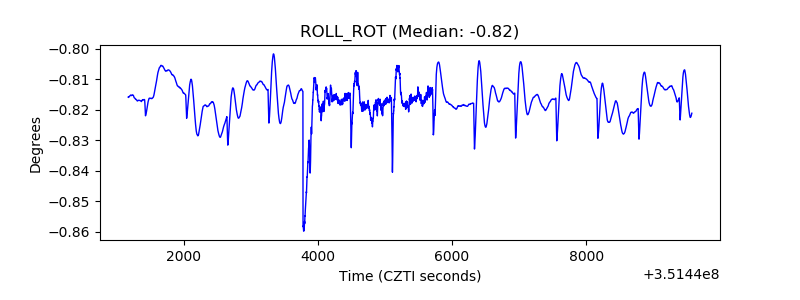 |
| _Roll_DEC | 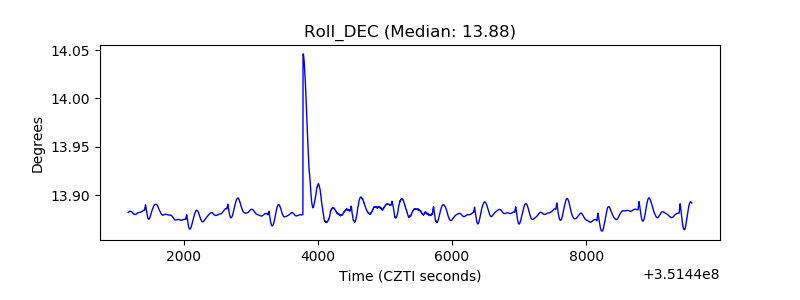 |
| _Roll_RA | 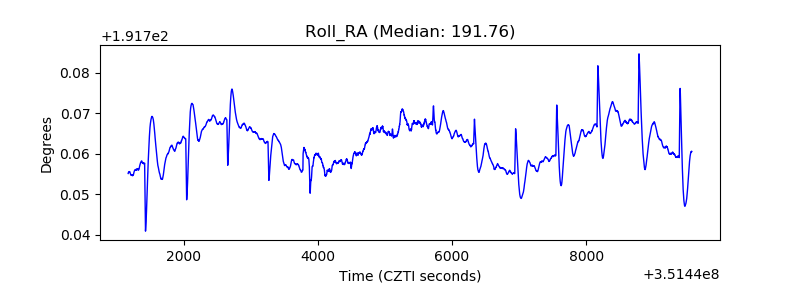 |
| Veto Counter | 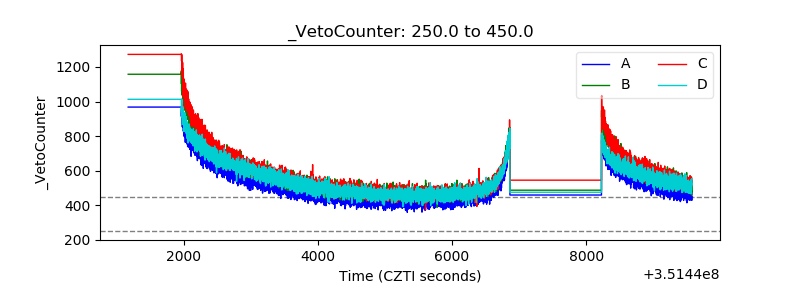 |