| Param | Original file | Final file |
|---|---|---|
| Filename | modeM0/AS1A10_048T07_9000004188cztM0_level2.fits | modeM0/AS1A10_048T07_9000004188cztM0_level2_quad_clean.evt |
| Size (bytes) | 737,925,120 | 590,849,280 |
| Size | 703.7 MB | 563.5 MB |
| Events in quadrant A | 4,637,296 | 3,399,174 |
| Events in quadrant B | 4,427,008 | 3,440,940 |
| Events in quadrant C | 4,411,274 | 3,151,307 |
| Events in quadrant D | 3,906,604 | 2,937,200 |
| Mode M9 | |||
|---|---|---|---|
| Quadrant | BADHDUFLAG | Total packets | Discarded packets |
| A | 0 | 105 | 0 |
| B | 0 | 105 | 0 |
| C | 0 | 105 | 0 |
| D | 0 | 105 | 0 |
| Mode SS | |||
|---|---|---|---|
| Quadrant | BADHDUFLAG | Total packets | Discarded packets |
| A | 0 | 1474 | 0 |
| B | 0 | 1474 | 0 |
| C | 0 | 1474 | 0 |
| D | 0 | 1474 | 0 |
| Mode M0 | |||
|---|---|---|---|
| Quadrant | BADHDUFLAG | Total packets | Discarded packets |
| A | 0 | 154977 | 0 |
| B | 0 | 159927 | 0 |
| C | 0 | 238085 | 0 |
| D | 0 | 217688 | 0 |
| Quadrant | Total seconds | Saturated seconds | Saturation percentage |
|---|---|---|---|
| A | 72375 | 943 | 1.302936% |
| B | 72375 | 1400 | 1.934370% |
| C | 72375 | 5221 | 7.213817% |
| D | 72374 | 4308 | 5.952414% |
Noise dominated data is calculated using 1-second bins in cleaned event files. If a bin has >2000 counts, and if more than 50% of those come from <1% of pixels, then it is considered to be noise-dominated and hence unusable.
| Quadrant | # 1 sec bins | Bins with >0 counts | Bins with >2000 counts | High rate bins dominated by noise | Noise dominated (total time) | Noise dominated (detector-on time) | Marked lightcurve |
|---|---|---|---|---|---|---|---|
| A | 82975 | 72374 | 0 | 0 | 0.00% | 0.00% | 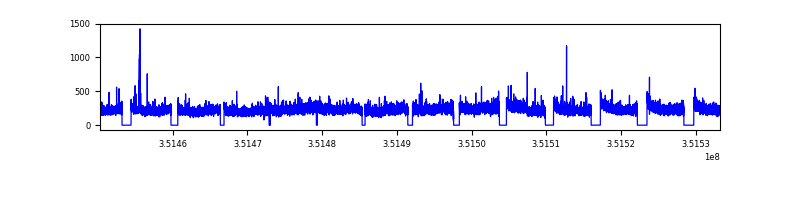 |
| B | 82975 | 72374 | 0 | 0 | 0.00% | 0.00% |  |
| C | 82975 | 72374 | 0 | 0 | 0.00% | 0.00% |  |
| D | 82975 | 72212 | 0 | 0 | 0.00% | 0.00% |  |
Top three noisy pixels from each quadrant. If the there are fewer than three noisy pixels in the level2.evt file, extra rows are filled as -1
| Pixel properties | Quadrant properties | ||||||
|---|---|---|---|---|---|---|---|
| Quadrant | DetID | PixID | Counts | Sigma | Mean | Median | Sigma |
| A | 0 | 29 | 4406 | 11.09 | 1208 | 1134 | 295.1 |
| A | 7 | 110 | 3735 | 8.81 | 1208 | 1134 | 295.1 |
| A | 0 | 30 | 3442 | 7.82 | 1208 | 1134 | 295.1 |
| B | 2 | 9 | 3549 | 10.66 | 1170 | 1116 | 228.2 |
| B | 2 | 8 | 3058 | 8.51 | 1170 | 1116 | 228.2 |
| B | 3 | 80 | 2887 | 7.76 | 1170 | 1116 | 228.2 |
| C | 1 | 80 | 3403 | 7.85 | 1165 | 1092 | 294.3 |
| C | 1 | 81 | 3326 | 7.59 | 1165 | 1092 | 294.3 |
| C | 12 | 241 | 3023 | 6.56 | 1165 | 1092 | 294.3 |
| D | 15 | 46 | 2896 | 6.42 | 1114 | 1020 | 292.4 |
| D | 10 | 189 | 2751 | 5.92 | 1114 | 1020 | 292.4 |
| D | 7 | 3 | 2691 | 5.71 | 1114 | 1020 | 292.4 |
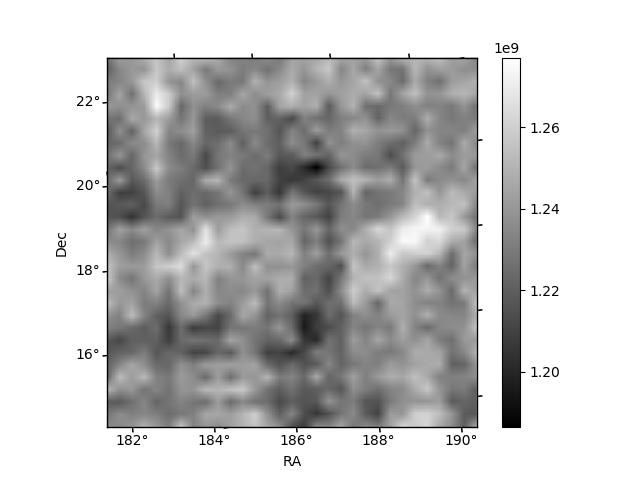
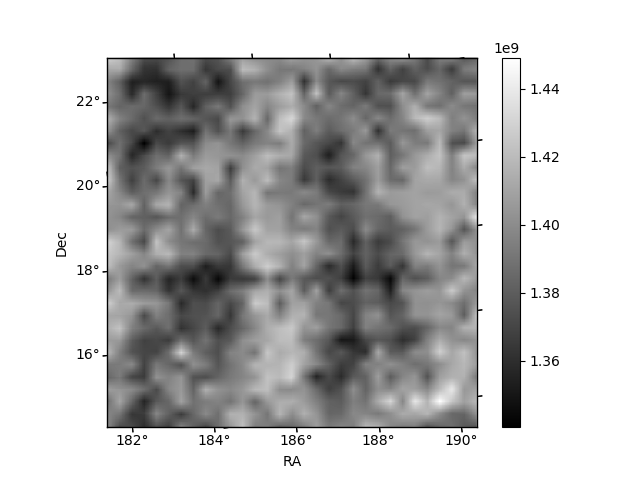
Histogram calculated using DETX and DETY for each event in the final _common_clean file
| Quadrant A | 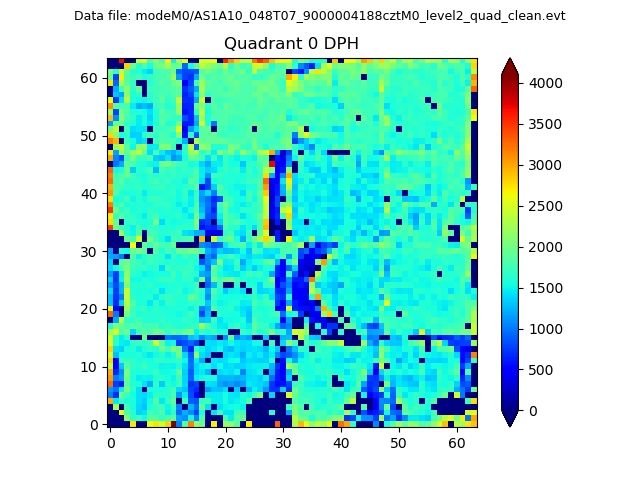 |
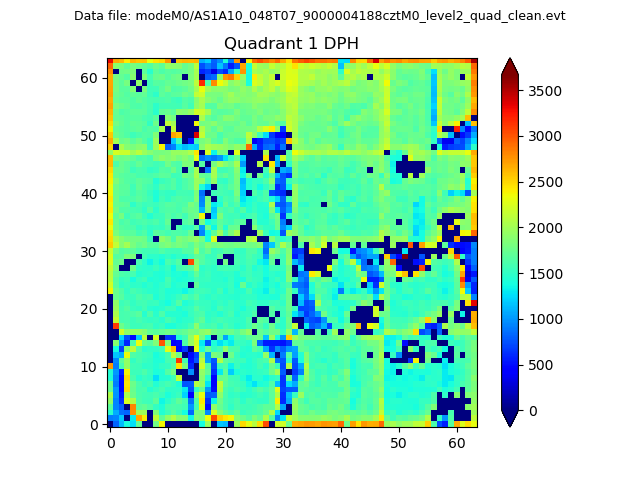 |
Quadrant B |
|---|---|---|---|
| Quadrant D | 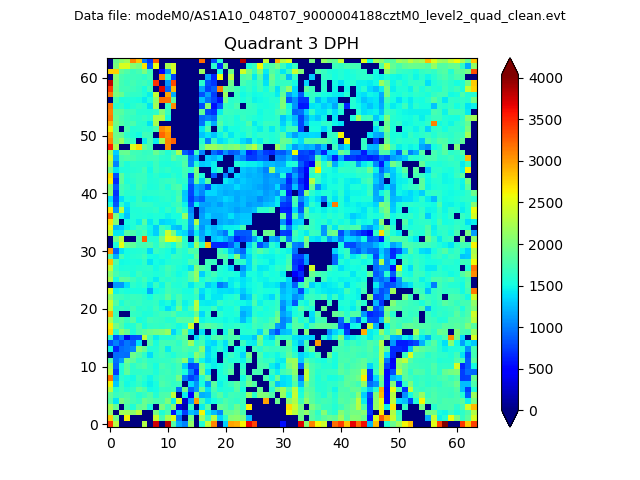 |
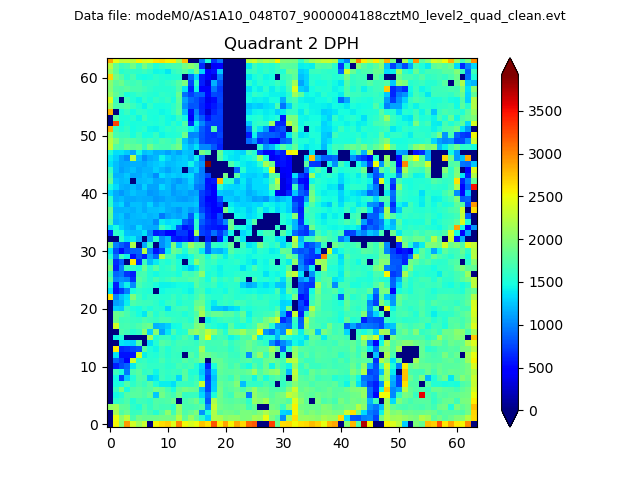 |
Quadrant C |
| Plot type | Count rate plots | Images |
|---|---|---|
| Comparison with Poisson distribution Blue bars denote a histogram of data divided into 1 sec bins. Red curve is a Poisson curve with rate = median count rate of data. |
 |
 |
| Quadrant-wise count rates Data is divided into 100 sec bins |
 |
|
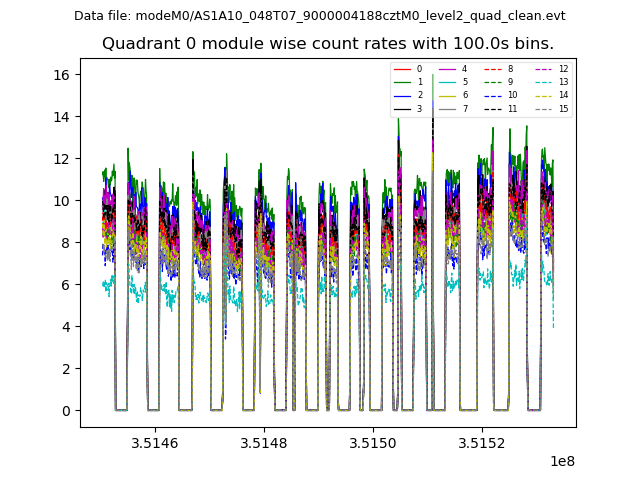
| Module-wise count rates for Quadrant A Data is divided into 100 sec bins |
 |
 |
| Module-wise count rates for Quadrant B Data is divided into 100 sec bins |
 |
 |
| Module-wise count rates for Quadrant C Data is divided into 100 sec bins |
 |
 |
| Module-wise count rates for Quadrant D Data is divided into 100 sec bins |
 |
 |
| Parameter | Plot |
|---|---|
| CZT HV Monitor | 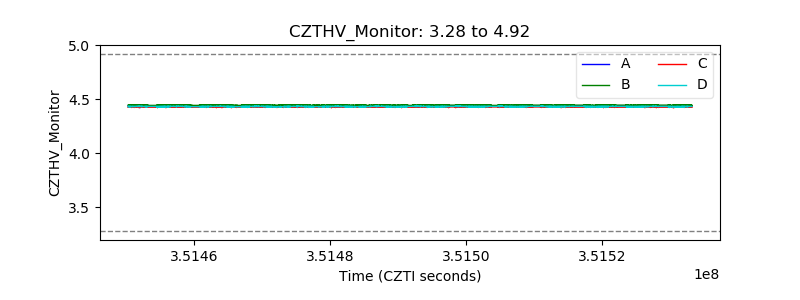 |
| D_VDD | 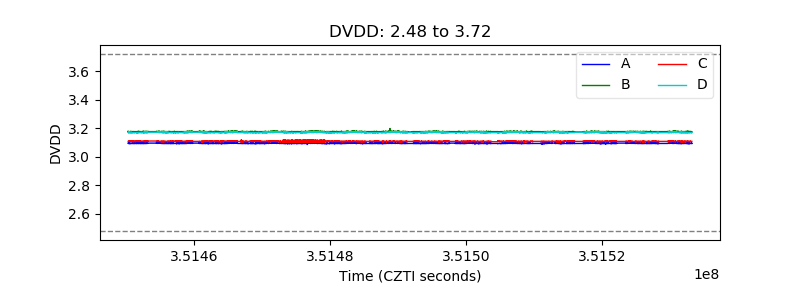 |
| Temperature 1 |  |
| Veto HV Monitor |  |
| Veto LLD | 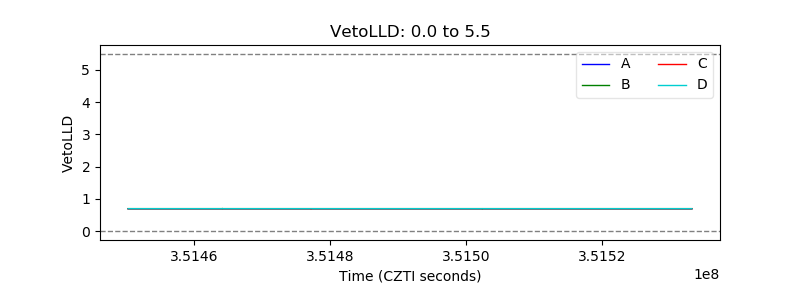 |
| Alpha Counter |  |
| _CPM_Rate |  |
| CZT Counter |  |
| +2.5 Volts monitor |  |
| +5 Volts monitor | 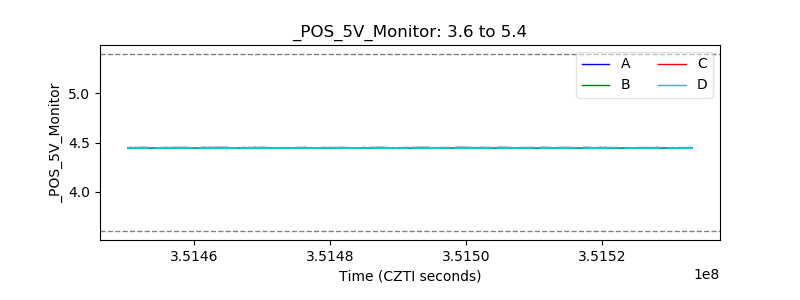 |
| _ROLL_ROT |  |
| _Roll_DEC |  |
| _Roll_RA | 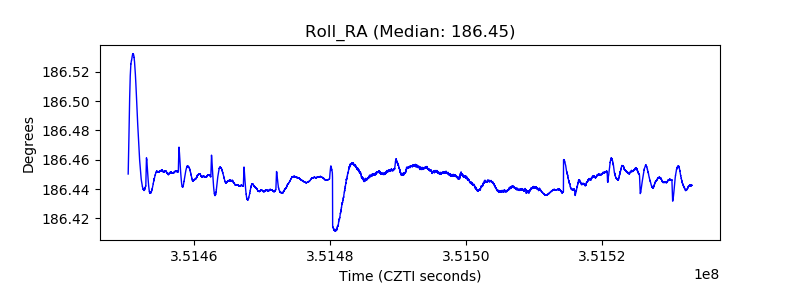 |
| Veto Counter |  |