| Param | Original file | Final file |
|---|---|---|
| Filename | modeM0/AS1A10_048T07_9000004188_29185cztM0_level2.evt | modeM0/AS1A10_048T07_9000004188_29185cztM0_level2_quad_clean.evt |
| Size (bytes) | 676,601,280 | 102,435,840 |
| Size | 645.3 MB | 97.7 MB |
| Events in quadrant A | 3,486,350 | 664,525 |
| Events in quadrant B | 3,863,047 | 680,621 |
| Events in quadrant C | 8,100,886 | 622,940 |
| Events in quadrant D | 4,558,113 | 636,708 |
| Mode M9 | |||
|---|---|---|---|
| Quadrant | BADHDUFLAG | Total packets | Discarded packets |
| A | 0 | 10 | 0 |
| B | 0 | 11 | 0 |
| C | 0 | 11 | 0 |
| D | 0 | 11 | 0 |
| Mode SS | |||
|---|---|---|---|
| Quadrant | BADHDUFLAG | Total packets | Discarded packets |
| A | 0 | 144 | 0 |
| B | 0 | 144 | 0 |
| C | 0 | 144 | 0 |
| D | 0 | 144 | 0 |
| Mode M0 | |||
|---|---|---|---|
| Quadrant | BADHDUFLAG | Total packets | Discarded packets |
| A | 0 | 14928 | 2 |
| B | 0 | 16137 | 2 |
| C | 0 | 29133 | 2 |
| D | 0 | 18399 | 2 |
| Quadrant | Total seconds | Saturated seconds | Saturation percentage |
|---|---|---|---|
| A | 7147 | 49 | 0.685602% |
| B | 7147 | 164 | 2.294669% |
| C | 7147 | 761 | 10.647824% |
| D | 7146 | 102 | 1.427372% |
Noise dominated data is calculated using 1-second bins in cleaned event files. If a bin has >2000 counts, and if more than 50% of those come from <1% of pixels, then it is considered to be noise-dominated and hence unusable.
| Quadrant | # 1 sec bins | Bins with >0 counts | Bins with >2000 counts | High rate bins dominated by noise | Noise dominated (total time) | Noise dominated (detector-on time) | Marked lightcurve |
|---|---|---|---|---|---|---|---|
| A | 7647 | 7148 | 0 | 0 | 0.00% | 0.00% | 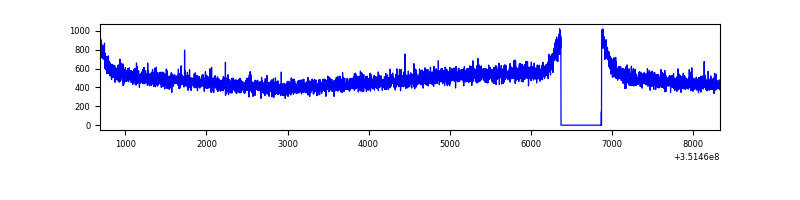 |
| B | 7647 | 7147 | 15 | 15 | 0.20% | 0.21% | 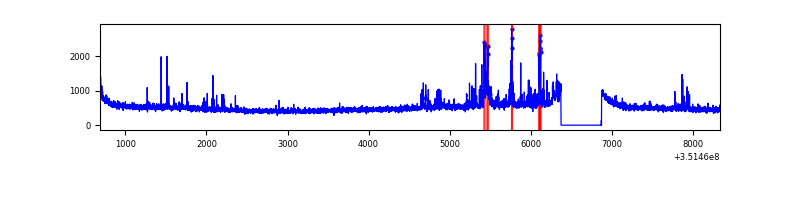 |
| C | 7647 | 7148 | 338 | 338 | 4.42% | 4.73% | 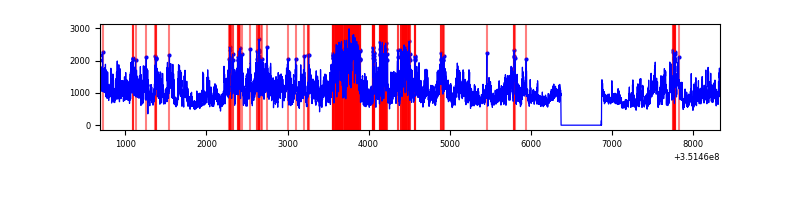 |
| D | 7646 | 7147 | 41 | 41 | 0.54% | 0.57% | 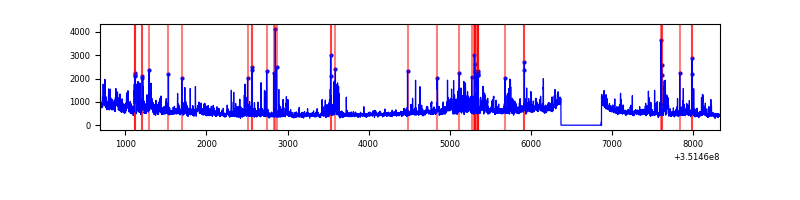 |
Top three noisy pixels from each quadrant. If the there are fewer than three noisy pixels in the level2.evt file, extra rows are filled as -1
| Pixel properties | Quadrant properties | ||||||
|---|---|---|---|---|---|---|---|
| Quadrant | DetID | PixID | Counts | Sigma | Mean | Median | Sigma |
| A | 13 | 254 | 13406 | 69.05 | 901 | 884 | 181.3 |
| A | 15 | 174 | 9853 | 49.46 | 901 | 884 | 181.3 |
| A | 3 | 137 | 9000 | 44.75 | 901 | 884 | 181.3 |
| B | 0 | 183 | 202882 | 1160.32 | 900 | 874 | 174.1 |
| B | 0 | 190 | 48215 | 271.92 | 900 | 874 | 174.1 |
| B | 5 | 255 | 43987 | 247.64 | 900 | 874 | 174.1 |
| C | 3 | 233 | 4622134 | 22990.72 | 854 | 861 | 201.0 |
| C | 14 | 238 | 133600 | 660.37 | 854 | 861 | 201.0 |
| C | 2 | 114 | 16572 | 78.16 | 854 | 861 | 201.0 |
| D | 1 | 52 | 633681 | 3000.55 | 873 | 849 | 210.9 |
| D | 8 | 195 | 476330 | 2254.48 | 873 | 849 | 210.9 |
| D | 13 | 153 | 78009 | 365.85 | 873 | 849 | 210.9 |
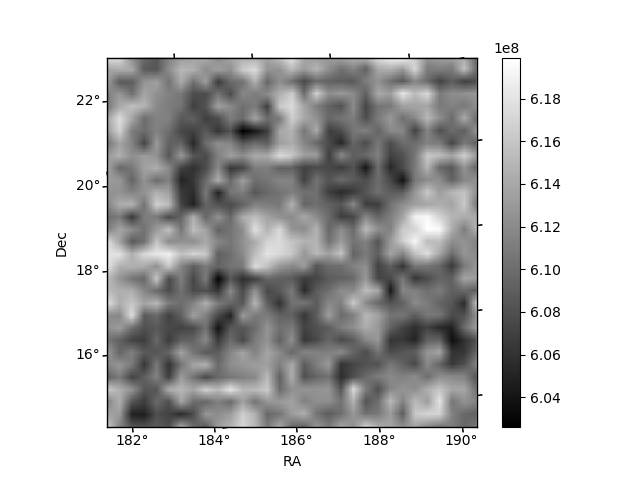
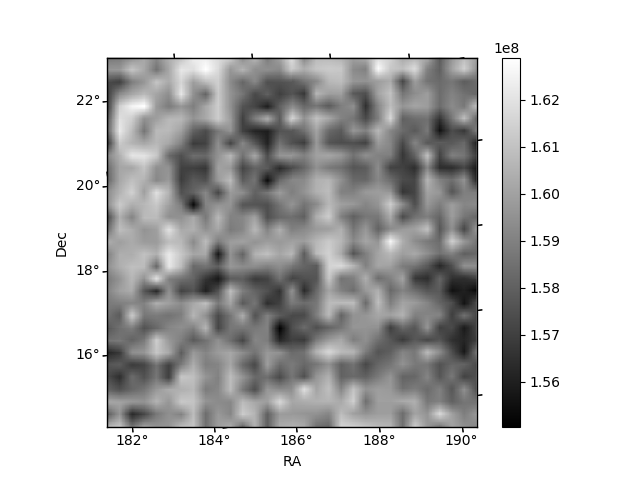
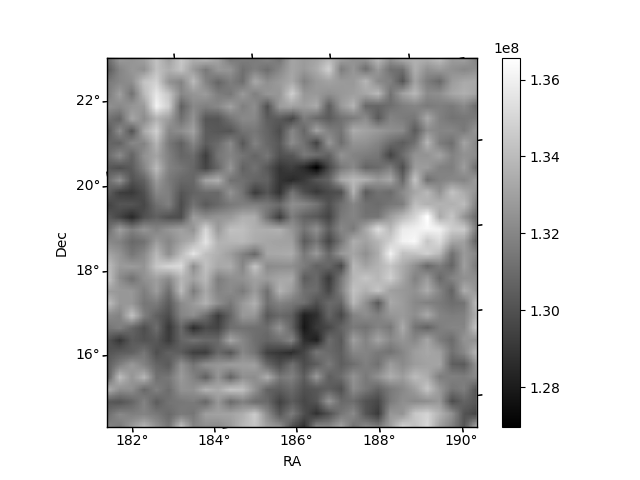
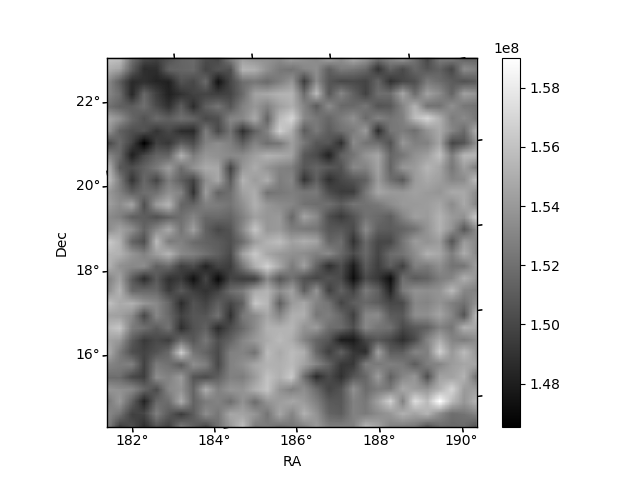
Histogram calculated using DETX and DETY for each event in the final _common_clean file
| Quadrant A | 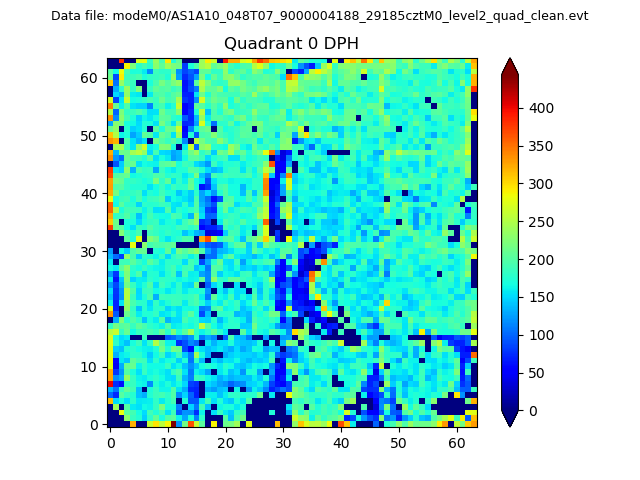 |
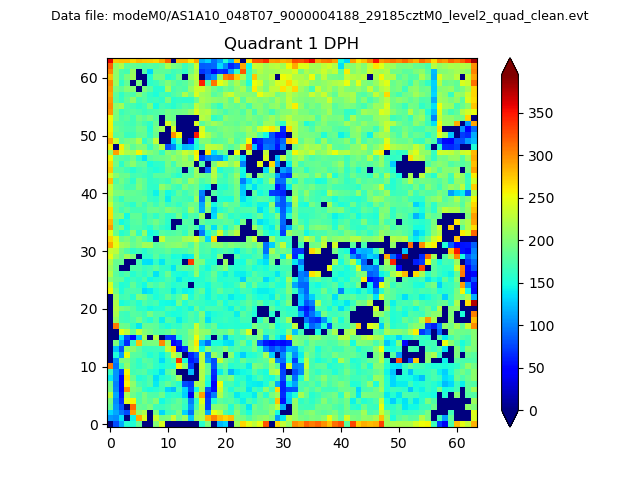 |
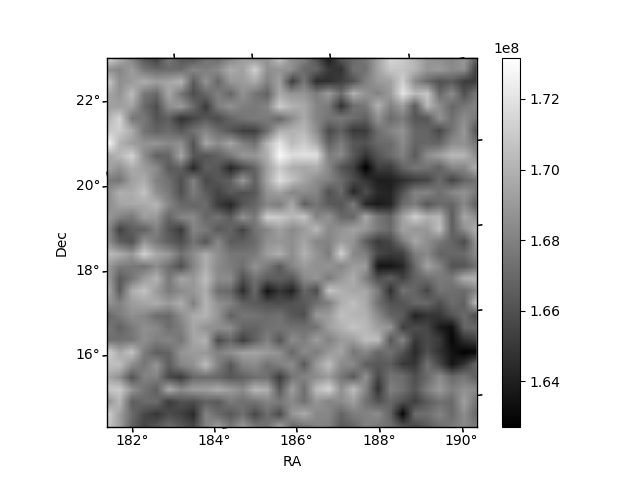
Quadrant B |
|---|---|---|---|
| Quadrant D | 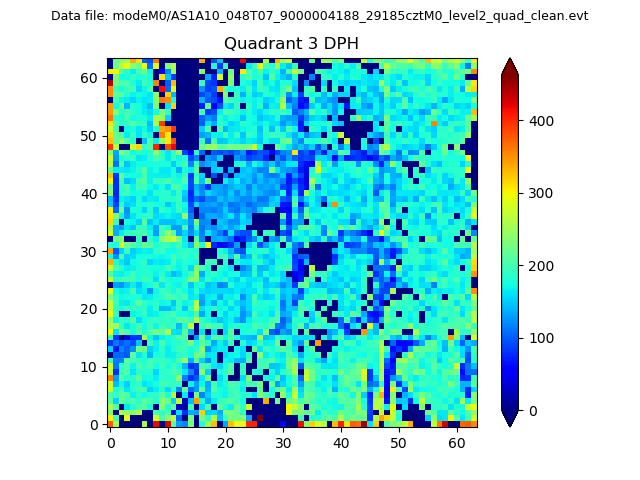 |
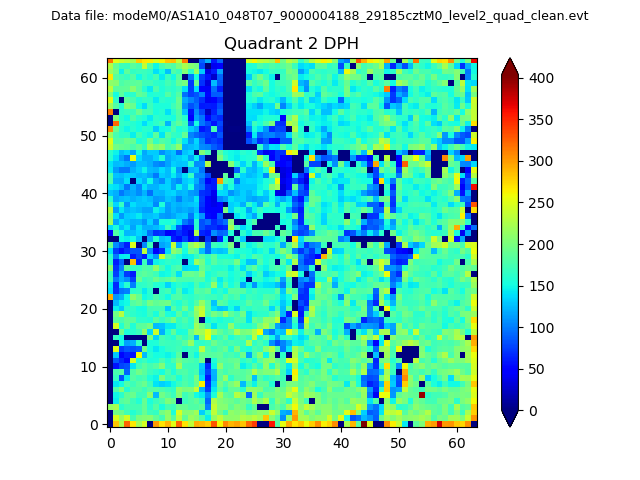 |
Quadrant C |
| Plot type | Count rate plots | Images |
|---|---|---|
| Comparison with Poisson distribution Blue bars denote a histogram of data divided into 1 sec bins. Red curve is a Poisson curve with rate = median count rate of data. |
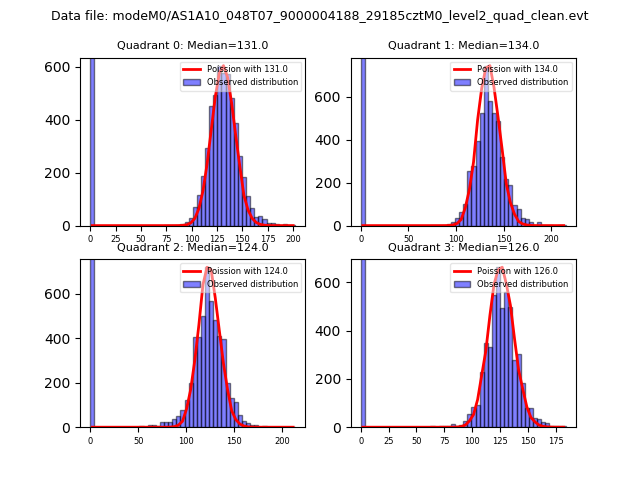 |
 |
| Quadrant-wise count rates Data is divided into 100 sec bins |
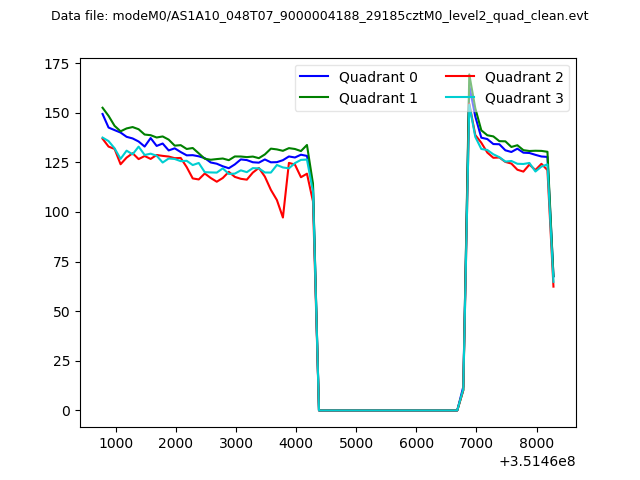 |
|
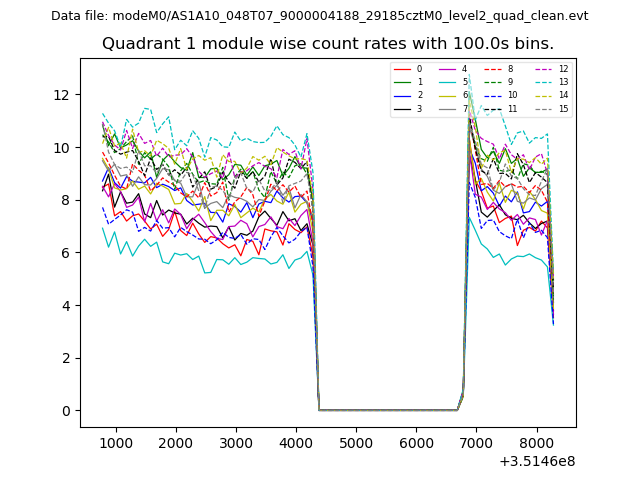
| Module-wise count rates for Quadrant A Data is divided into 100 sec bins |
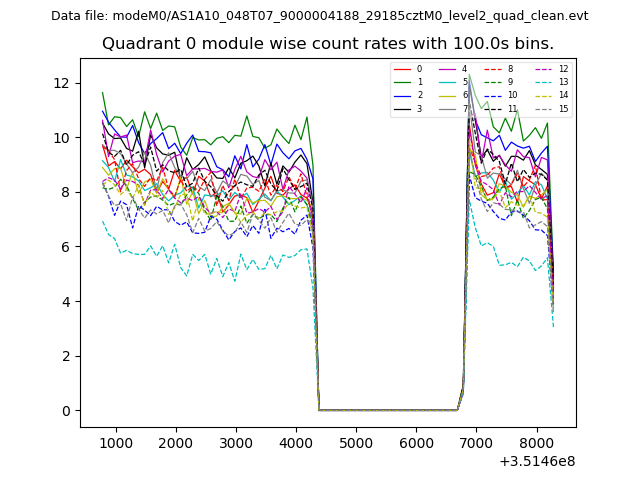 |
 |
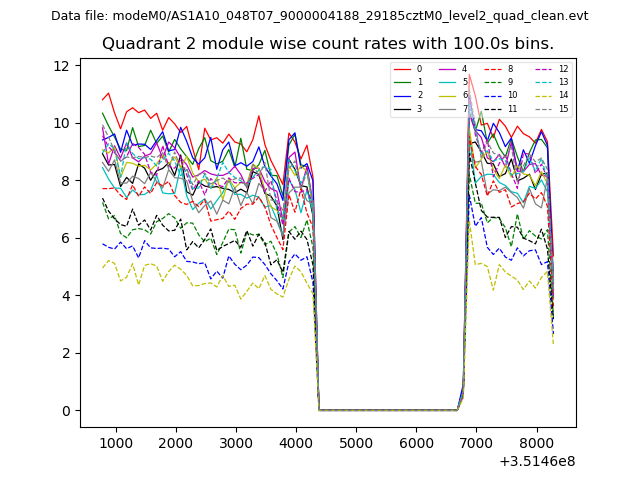
| Module-wise count rates for Quadrant B Data is divided into 100 sec bins |
 |
 |
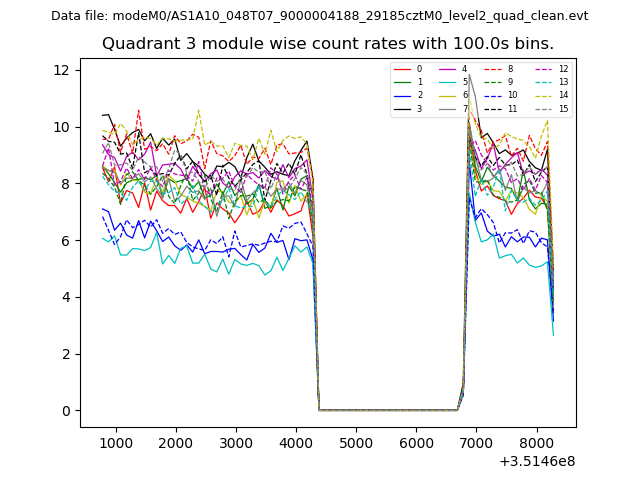
| Module-wise count rates for Quadrant C Data is divided into 100 sec bins |
 |
 |
| Module-wise count rates for Quadrant D Data is divided into 100 sec bins |
 |
 |
| Parameter | Plot |
|---|---|
| CZT HV Monitor | 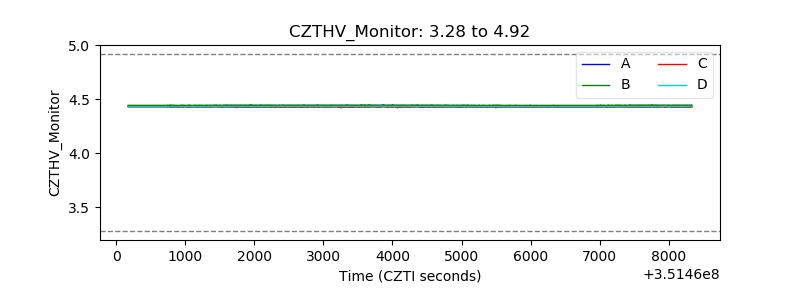 |
| D_VDD | 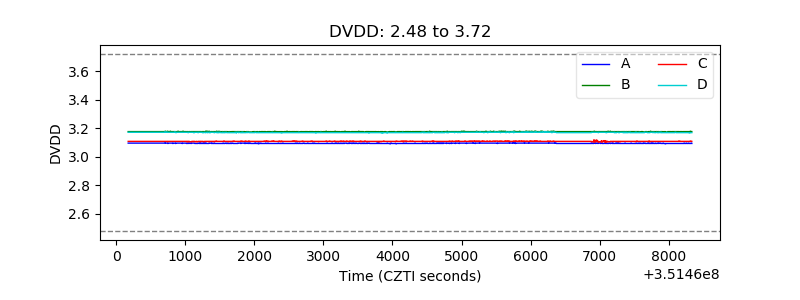 |
| Temperature 1 | 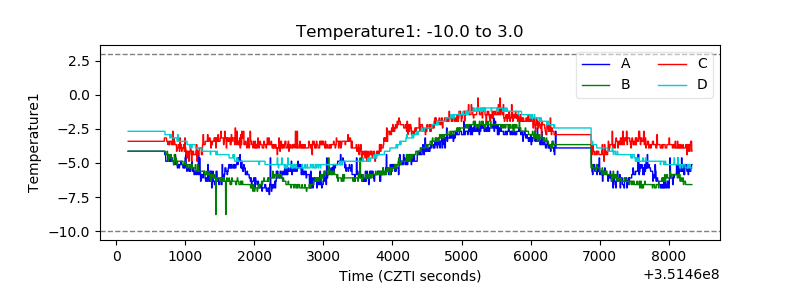 |
| Veto HV Monitor | 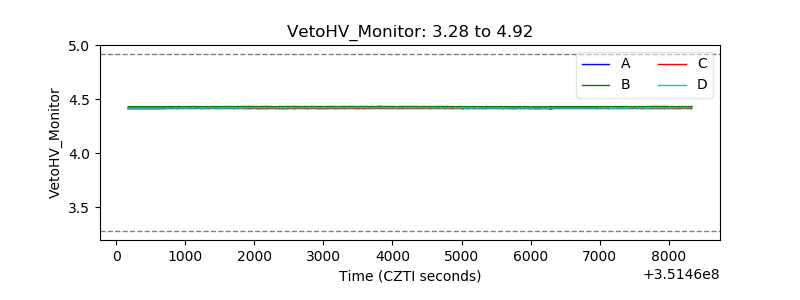 |
| Veto LLD | 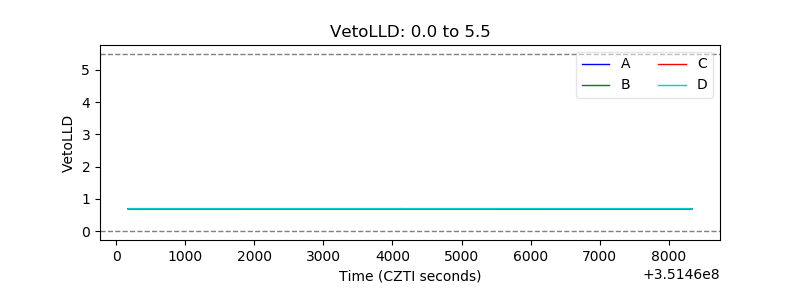 |
| Alpha Counter | 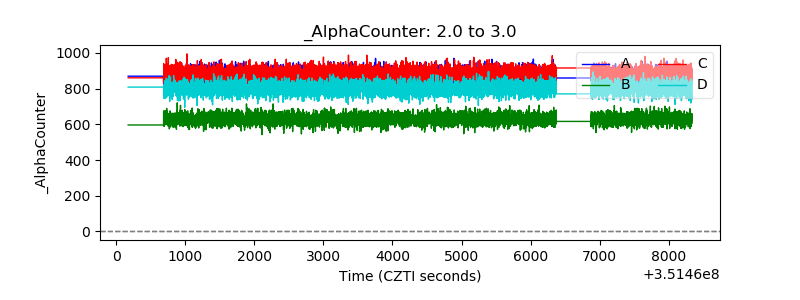 |
| _CPM_Rate | 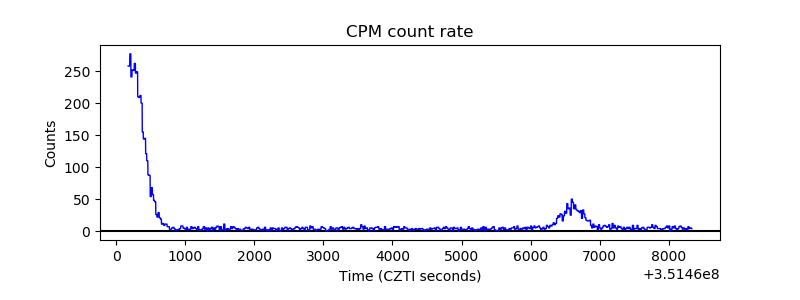 |
| CZT Counter |  |
| +2.5 Volts monitor | 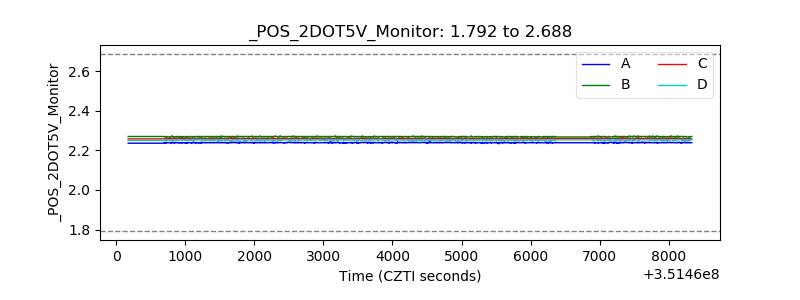 |
| +5 Volts monitor | 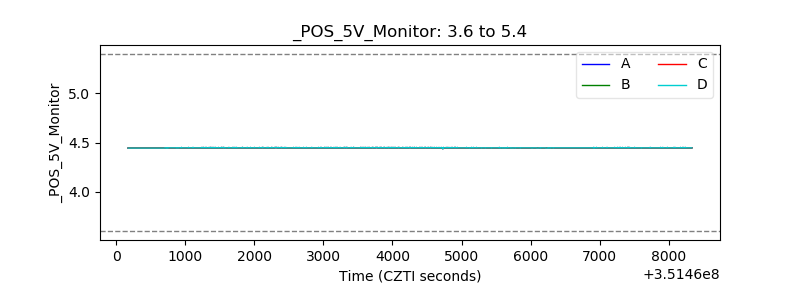 |
| _ROLL_ROT | 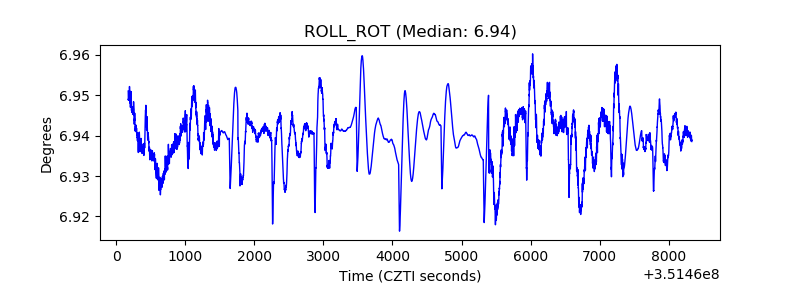 |
| _Roll_DEC | 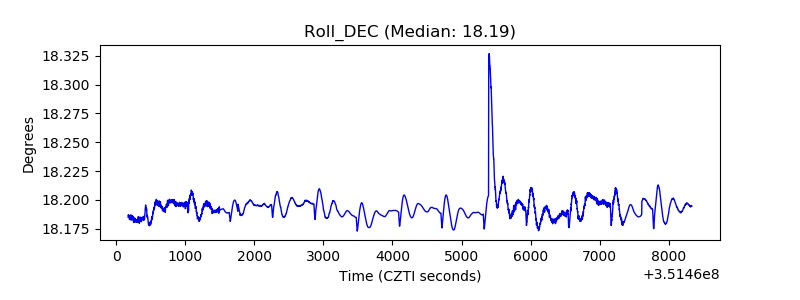 |
| _Roll_RA | 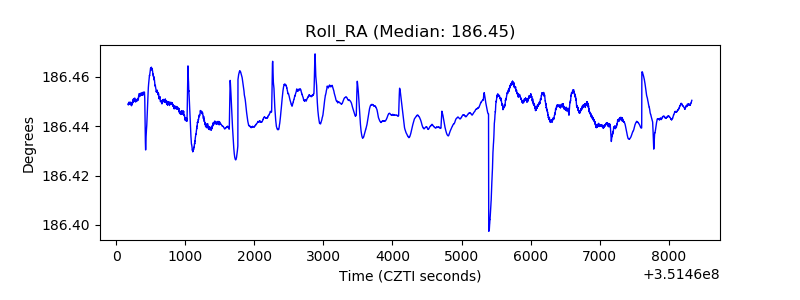 |
| Veto Counter | 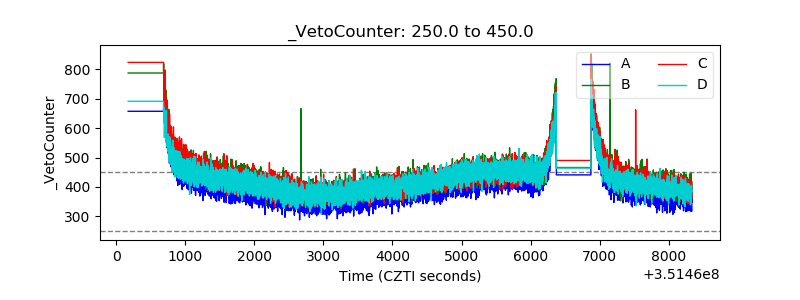 |