| Param | Original file | Final file |
|---|---|---|
| Filename | modeM0/AS1A10_048T07_9000004188_29186cztM0_level2.evt | modeM0/AS1A10_048T07_9000004188_29186cztM0_level2_quad_clean.evt |
| Size (bytes) | 690,264,000 | 109,434,240 |
| Size | 658.3 MB | 104.4 MB |
| Events in quadrant A | 4,037,626 | 701,035 |
| Events in quadrant B | 4,318,892 | 713,706 |
| Events in quadrant C | 6,469,971 | 671,191 |
| Events in quadrant D | 5,531,087 | 666,326 |
| Mode M9 | |||
|---|---|---|---|
| Quadrant | BADHDUFLAG | Total packets | Discarded packets |
| A | 0 | 6 | 0 |
| B | 0 | 6 | 0 |
| C | 0 | 6 | 0 |
| D | 0 | 6 | 0 |
| Mode SS | |||
|---|---|---|---|
| Quadrant | BADHDUFLAG | Total packets | Discarded packets |
| A | 0 | 166 | 0 |
| B | 0 | 166 | 0 |
| C | 0 | 166 | 0 |
| D | 0 | 166 | 0 |
| Mode M0 | |||
|---|---|---|---|
| Quadrant | BADHDUFLAG | Total packets | Discarded packets |
| A | 0 | 17239 | 2 |
| B | 0 | 18129 | 2 |
| C | 0 | 24887 | 3 |
| D | 0 | 22120 | 2 |
| Quadrant | Total seconds | Saturated seconds | Saturation percentage |
|---|---|---|---|
| A | 8082 | 129 | 1.596140% |
| B | 8082 | 291 | 3.600594% |
| C | 8081 | 584 | 7.226828% |
| D | 8081 | 279 | 3.452543% |
Noise dominated data is calculated using 1-second bins in cleaned event files. If a bin has >2000 counts, and if more than 50% of those come from <1% of pixels, then it is considered to be noise-dominated and hence unusable.
| Quadrant | # 1 sec bins | Bins with >0 counts | Bins with >2000 counts | High rate bins dominated by noise | Noise dominated (total time) | Noise dominated (detector-on time) | Marked lightcurve |
|---|---|---|---|---|---|---|---|
| A | 8687 | 8086 | 0 | 0 | 0.00% | 0.00% | 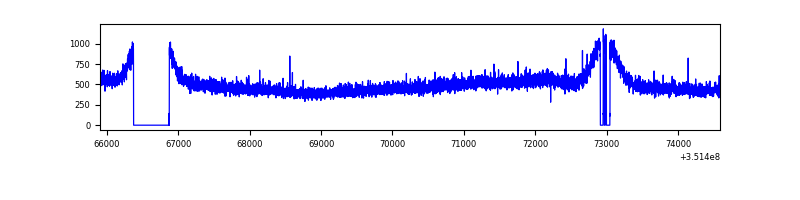 |
| B | 8687 | 8085 | 7 | 7 | 0.08% | 0.09% | 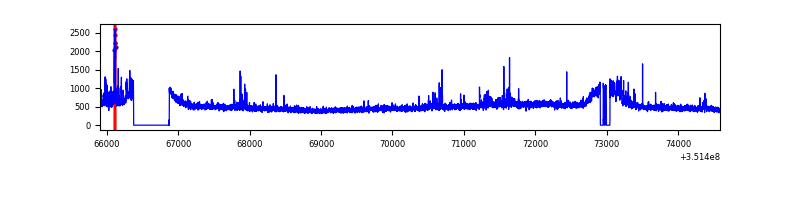 |
| C | 8686 | 8085 | 40 | 40 | 0.46% | 0.49% | 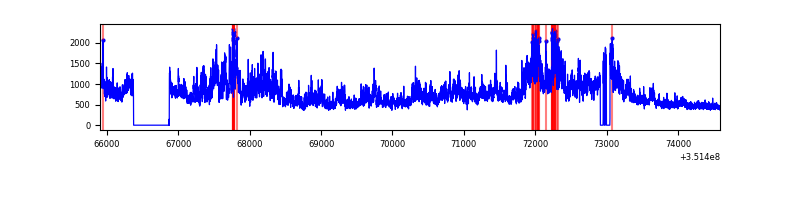 |
| D | 8686 | 8085 | 120 | 120 | 1.38% | 1.48% | 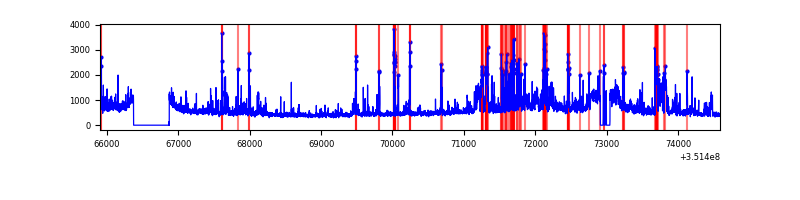 |
Top three noisy pixels from each quadrant. If the there are fewer than three noisy pixels in the level2.evt file, extra rows are filled as -1
| Pixel properties | Quadrant properties | ||||||
|---|---|---|---|---|---|---|---|
| Quadrant | DetID | PixID | Counts | Sigma | Mean | Median | Sigma |
| A | 13 | 254 | 15164 | 66.75 | 1045 | 1023 | 211.9 |
| A | 3 | 137 | 10710 | 45.72 | 1045 | 1023 | 211.9 |
| A | 0 | 226 | 8828 | 36.84 | 1045 | 1023 | 211.9 |
| B | 0 | 183 | 160105 | 777.29 | 1039 | 1009 | 204.7 |
| B | 5 | 255 | 34919 | 165.67 | 1039 | 1009 | 204.7 |
| B | 10 | 245 | 26958 | 126.78 | 1039 | 1009 | 204.7 |
| C | 3 | 233 | 2431807 | 10433.29 | 989 | 997 | 233.0 |
| C | 14 | 238 | 156061 | 665.55 | 989 | 997 | 233.0 |
| C | 2 | 114 | 19313 | 78.61 | 989 | 997 | 233.0 |
| D | 1 | 52 | 1016781 | 4173.19 | 1004 | 976 | 243.4 |
| D | 8 | 195 | 534071 | 2190.09 | 1004 | 976 | 243.4 |
| D | 13 | 153 | 100474 | 408.76 | 1004 | 976 | 243.4 |
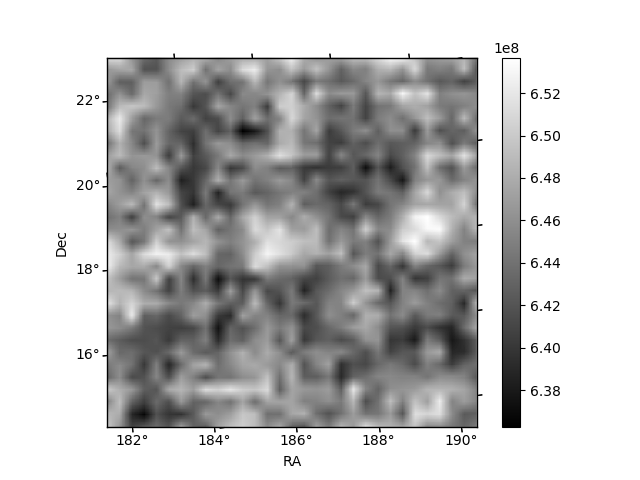
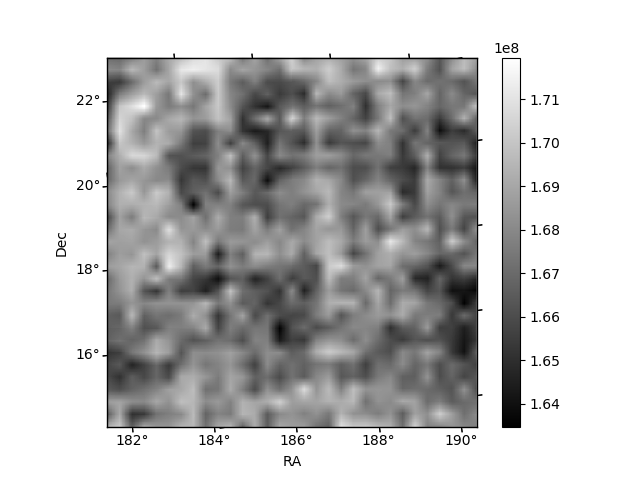
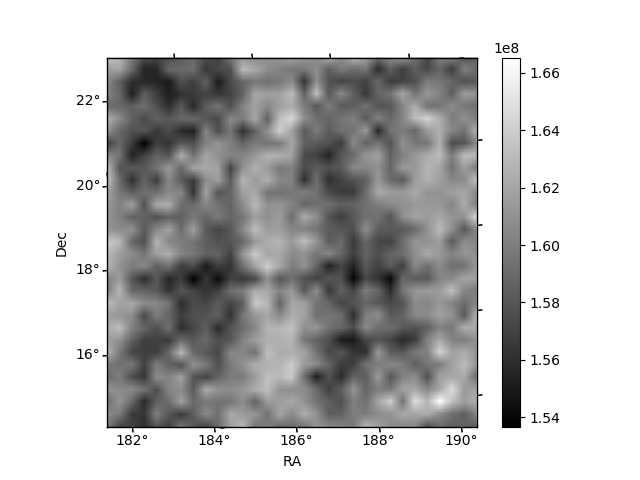
Histogram calculated using DETX and DETY for each event in the final _common_clean file
| Quadrant A | 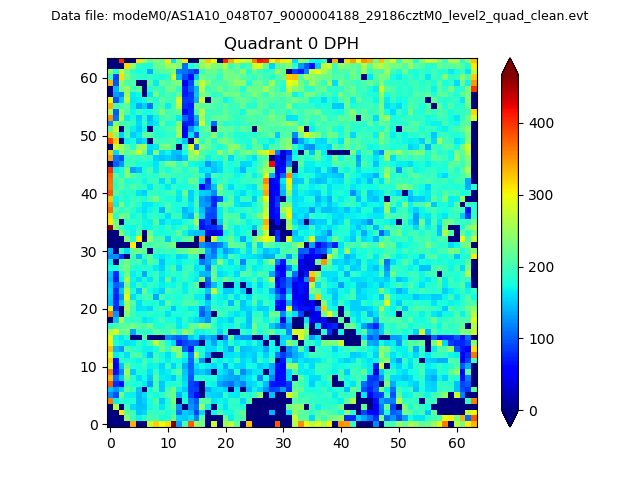 |
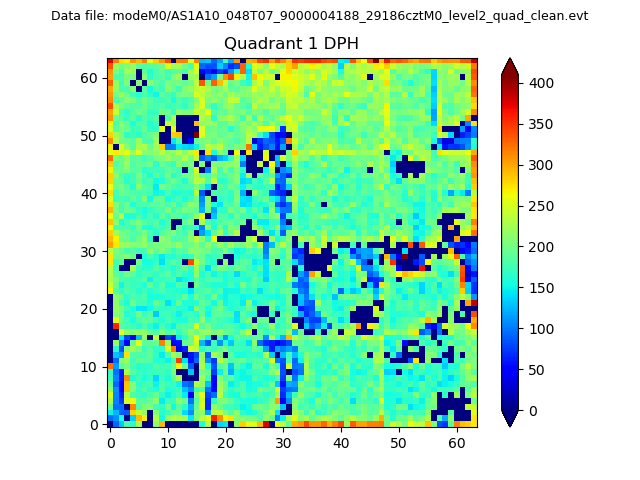 |
Quadrant B |
|---|---|---|---|
| Quadrant D | 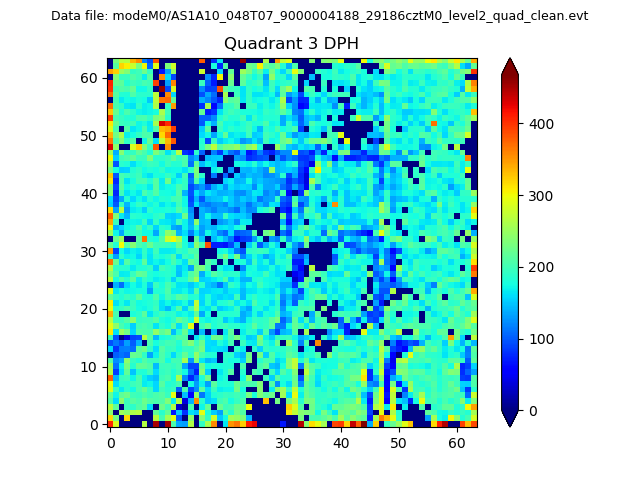 |
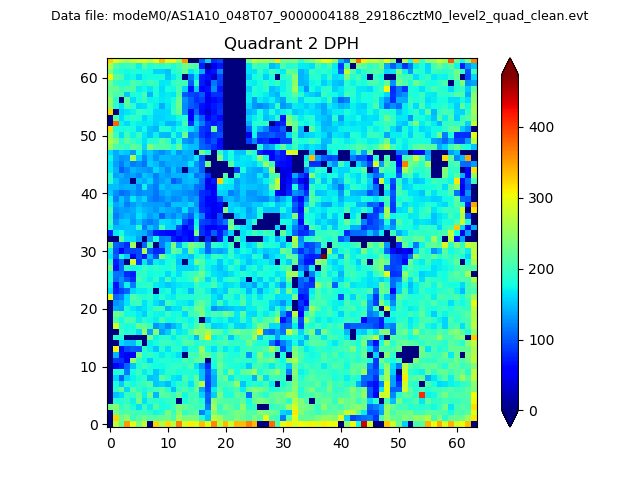 |
Quadrant C |
| Plot type | Count rate plots | Images |
|---|---|---|
| Comparison with Poisson distribution Blue bars denote a histogram of data divided into 1 sec bins. Red curve is a Poisson curve with rate = median count rate of data. |
 |
 |
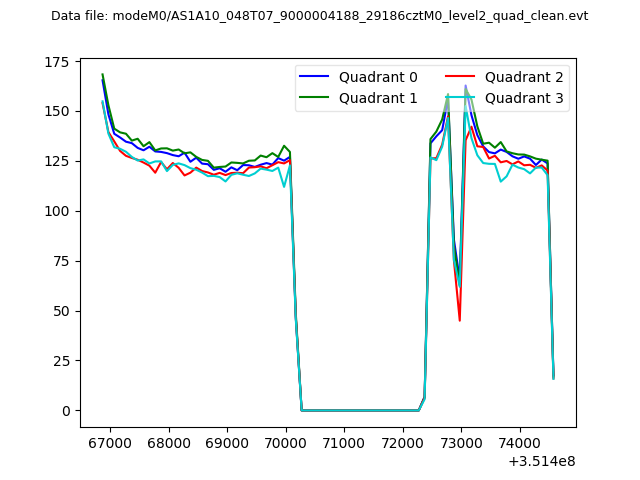
| Quadrant-wise count rates Data is divided into 100 sec bins |
 |
|
| Module-wise count rates for Quadrant A Data is divided into 100 sec bins |
 |
 |
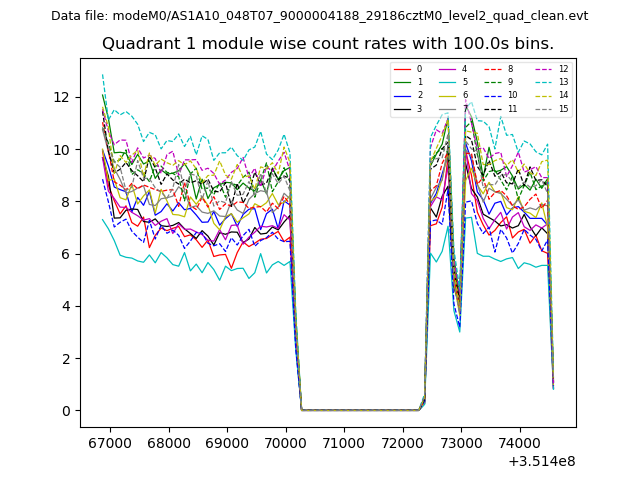
| Module-wise count rates for Quadrant B Data is divided into 100 sec bins |
 |
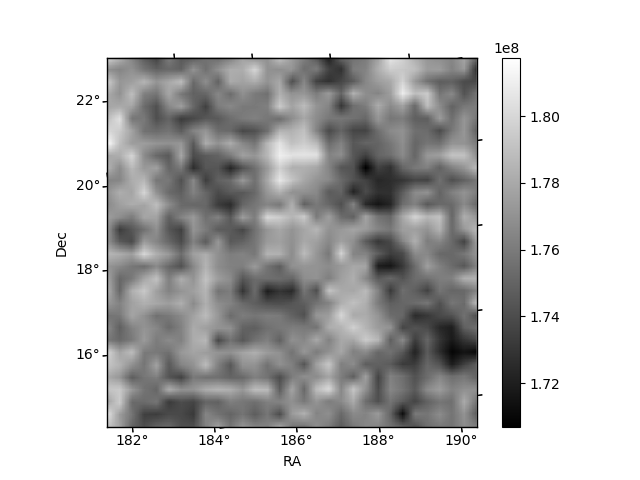 |
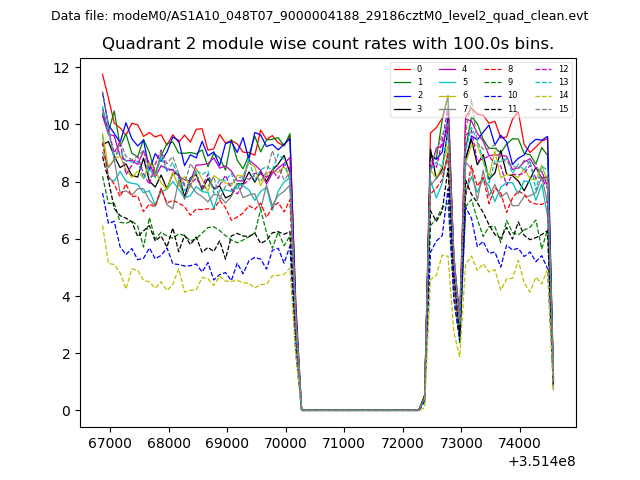
| Module-wise count rates for Quadrant C Data is divided into 100 sec bins |
 |
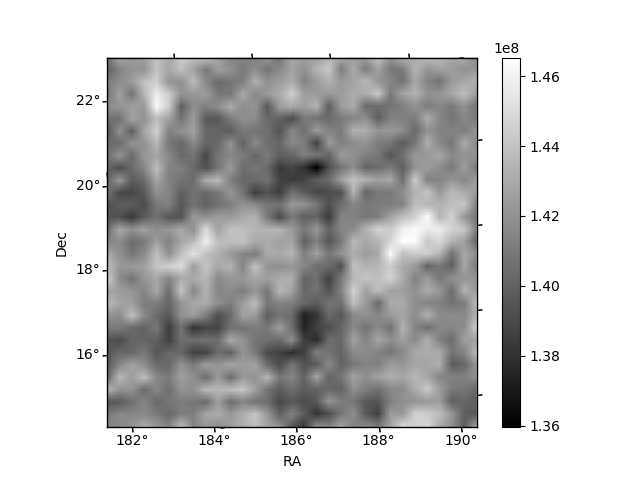 |
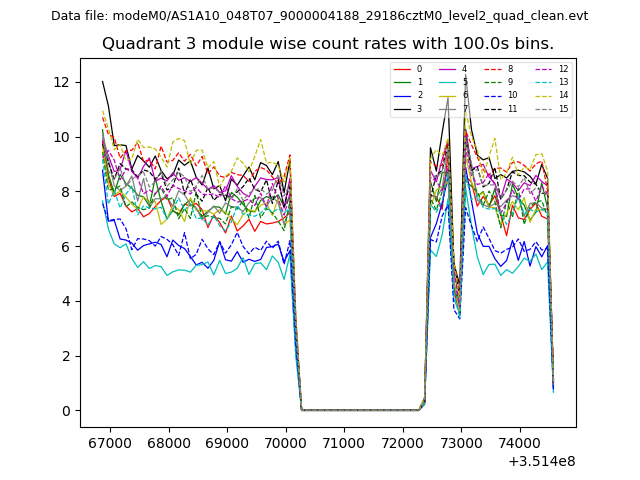
| Module-wise count rates for Quadrant D Data is divided into 100 sec bins |
 |
 |
| Parameter | Plot |
|---|---|
| CZT HV Monitor | 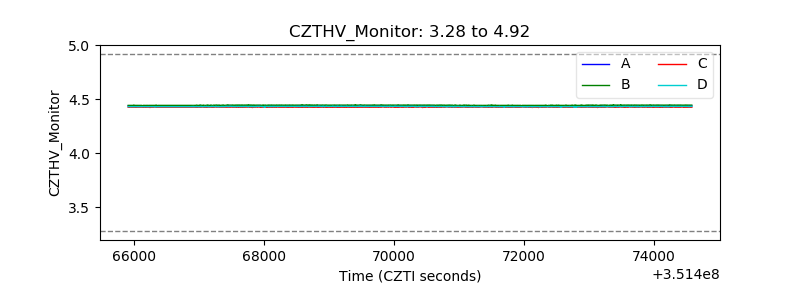 |
| D_VDD | 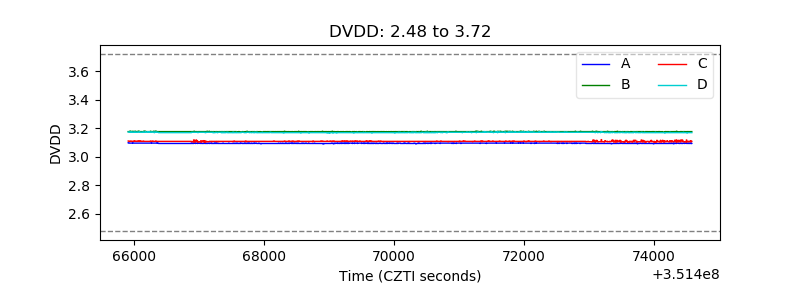 |
| Temperature 1 | 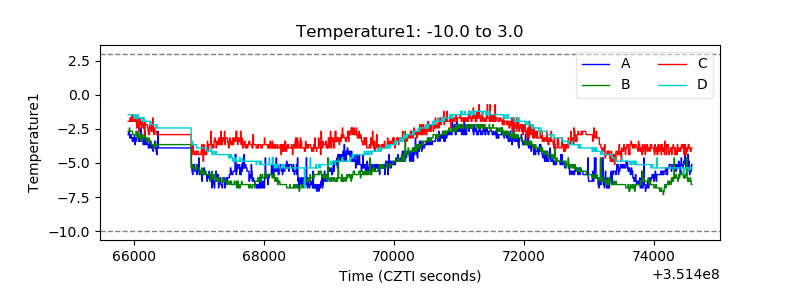 |
| Veto HV Monitor | 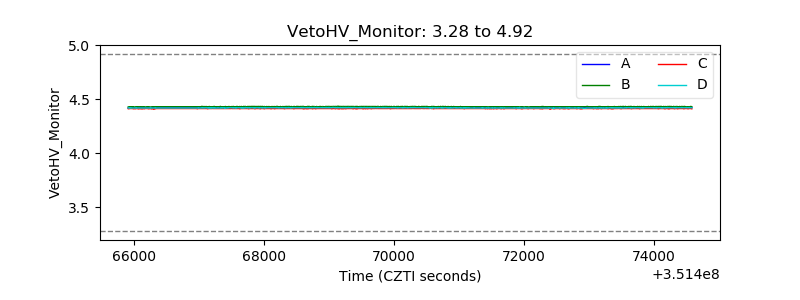 |
| Veto LLD | 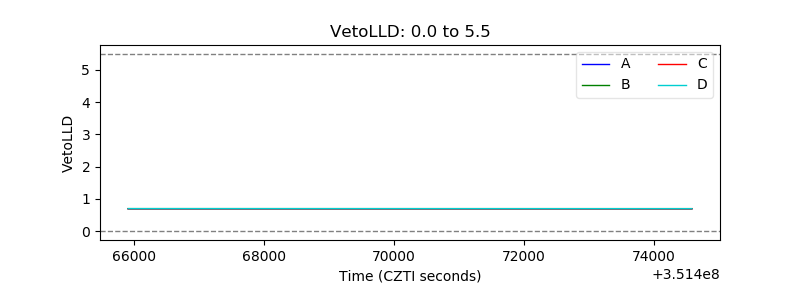 |
| Alpha Counter | 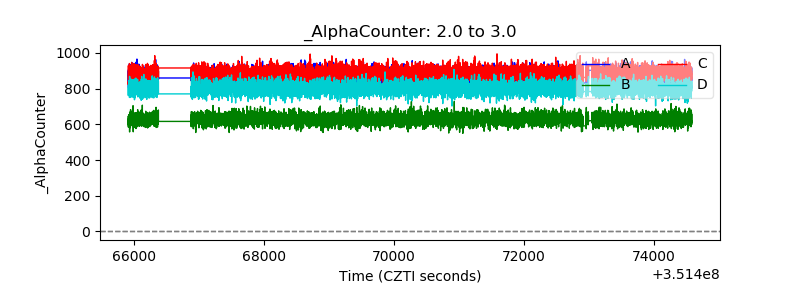 |
| _CPM_Rate | 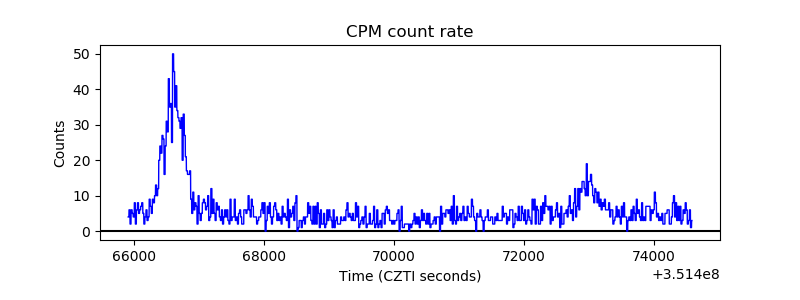 |
| CZT Counter | 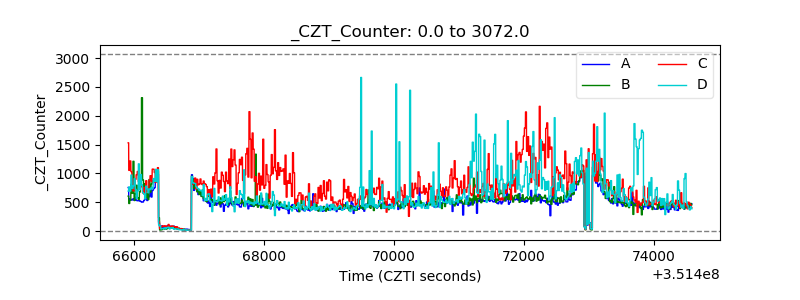 |
| +2.5 Volts monitor | 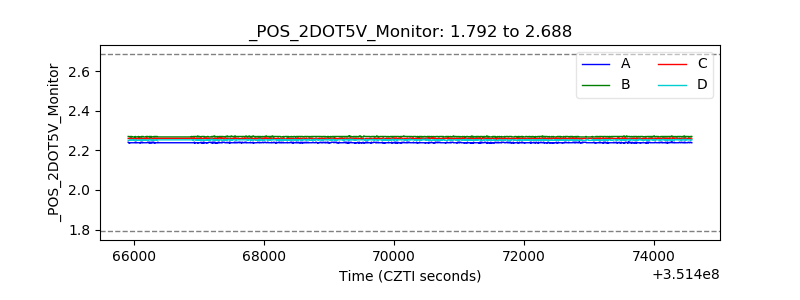 |
| +5 Volts monitor |  |
| _ROLL_ROT | 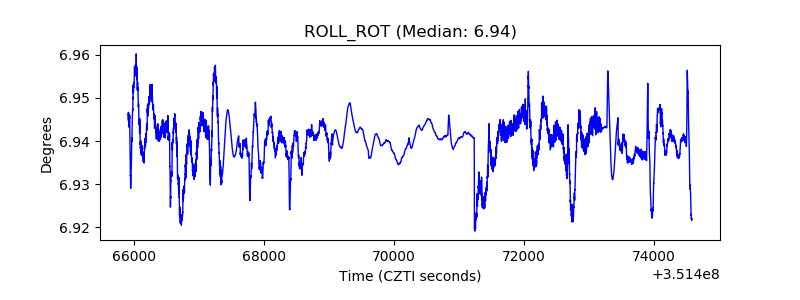 |
| _Roll_DEC | 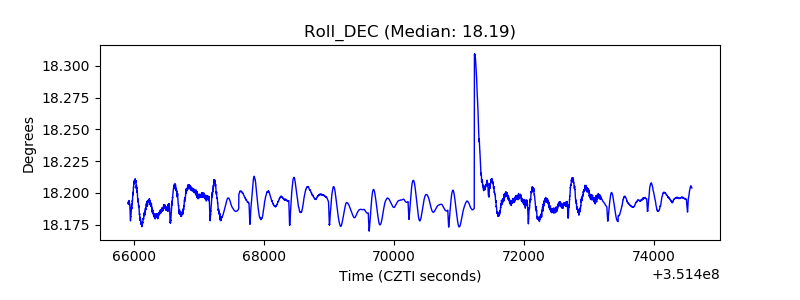 |
| _Roll_RA | 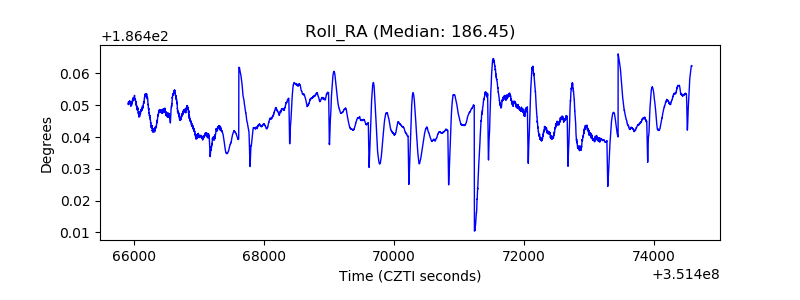 |
| Veto Counter | 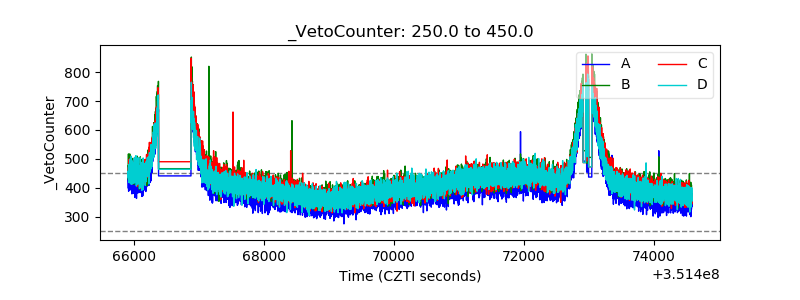 |