| Param | Original file | Final file |
|---|---|---|
| Filename | modeM0/AS1A10_048T07_9000004188_29191cztM0_level2.evt | modeM0/AS1A10_048T07_9000004188_29191cztM0_level2_quad_clean.evt |
| Size (bytes) | 2,703,144,960 | 367,329,600 |
| Size | 2.5 GB | 350.3 MB |
| Events in quadrant A | 15,565,406 | 2,304,958 |
| Events in quadrant B | 15,325,176 | 2,360,449 |
| Events in quadrant C | 24,869,841 | 2,223,663 |
| Events in quadrant D | 24,079,485 | 2,166,147 |
| Mode M9 | |||
|---|---|---|---|
| Quadrant | BADHDUFLAG | Total packets | Discarded packets |
| A | 0 | 28 | 0 |
| B | 0 | 28 | 0 |
| C | 0 | 28 | 0 |
| D | 0 | 28 | 0 |
| Mode SS | |||
|---|---|---|---|
| Quadrant | BADHDUFLAG | Total packets | Discarded packets |
| A | 0 | 614 | 0 |
| B | 0 | 614 | 0 |
| C | 0 | 614 | 0 |
| D | 0 | 614 | 0 |
| Mode M0 | |||
|---|---|---|---|
| Quadrant | BADHDUFLAG | Total packets | Discarded packets |
| A | 0 | 63475 | 5 |
| B | 0 | 64436 | 5 |
| C | 0 | 95064 | 5 |
| D | 0 | 91830 | 8 |
| Quadrant | Total seconds | Saturated seconds | Saturation percentage |
|---|---|---|---|
| A | 30106 | 394 | 1.308709% |
| B | 30106 | 503 | 1.670763% |
| C | 30106 | 1919 | 6.374145% |
| D | 30105 | 2057 | 6.832752% |
Noise dominated data is calculated using 1-second bins in cleaned event files. If a bin has >2000 counts, and if more than 50% of those come from <1% of pixels, then it is considered to be noise-dominated and hence unusable.
| Quadrant | # 1 sec bins | Bins with >0 counts | Bins with >2000 counts | High rate bins dominated by noise | Noise dominated (total time) | Noise dominated (detector-on time) | Marked lightcurve |
|---|---|---|---|---|---|---|---|
| A | 33006 | 30111 | 0 | 0 | 0.00% | 0.00% | 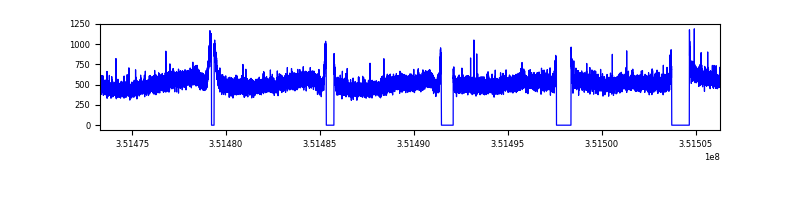 |
| B | 33006 | 30111 | 23 | 23 | 0.07% | 0.08% | 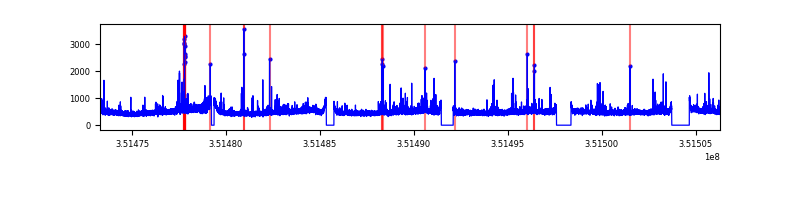 |
| C | 33006 | 30111 | 501 | 501 | 1.52% | 1.66% | 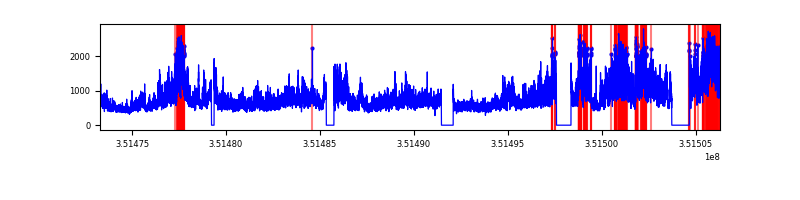 |
| D | 33006 | 30111 | 1381 | 1381 | 4.18% | 4.59% | 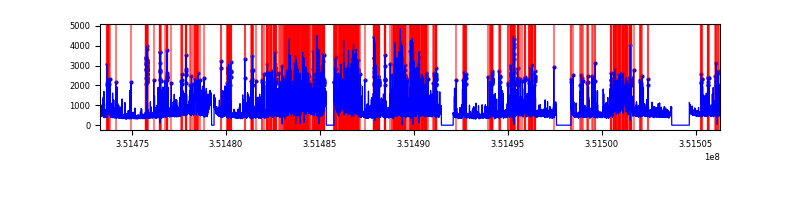 |
Top three noisy pixels from each quadrant. If the there are fewer than three noisy pixels in the level2.evt file, extra rows are filled as -1
| Pixel properties | Quadrant properties | ||||||
|---|---|---|---|---|---|---|---|
| Quadrant | DetID | PixID | Counts | Sigma | Mean | Median | Sigma |
| A | 1 | 113 | 1228819 | 1641.19 | 3715 | 3631 | 746.5 |
| A | 13 | 254 | 53244 | 66.46 | 3715 | 3631 | 746.5 |
| A | 3 | 137 | 37733 | 45.68 | 3715 | 3631 | 746.5 |
| B | 0 | 183 | 503146 | 710.73 | 3680 | 3586 | 702.9 |
| B | 0 | 190 | 103136 | 141.63 | 3680 | 3586 | 702.9 |
| B | 12 | 111 | 90480 | 123.63 | 3680 | 3586 | 702.9 |
| C | 3 | 233 | 10515290 | 12842.46 | 3518 | 3540 | 818.5 |
| C | 14 | 238 | 562404 | 682.78 | 3518 | 3540 | 818.5 |
| C | 2 | 114 | 69797 | 80.95 | 3518 | 3540 | 818.5 |
| D | 1 | 52 | 7696101 | 9200.2 | 3513 | 3418 | 836.1 |
| D | 8 | 195 | 1969571 | 2351.46 | 3513 | 3418 | 836.1 |
| D | 13 | 153 | 564911 | 671.53 | 3513 | 3418 | 836.1 |
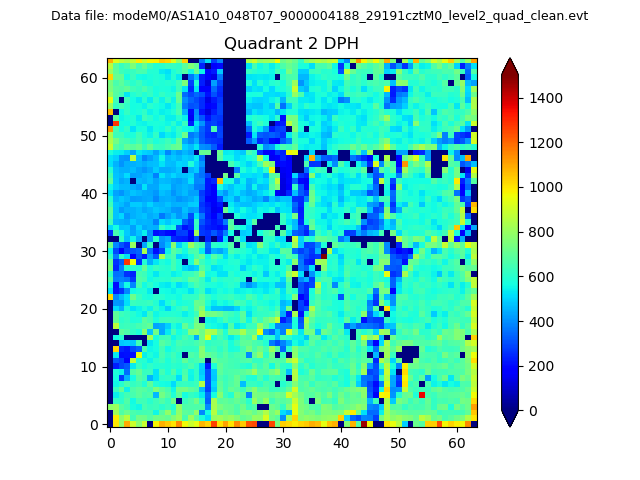
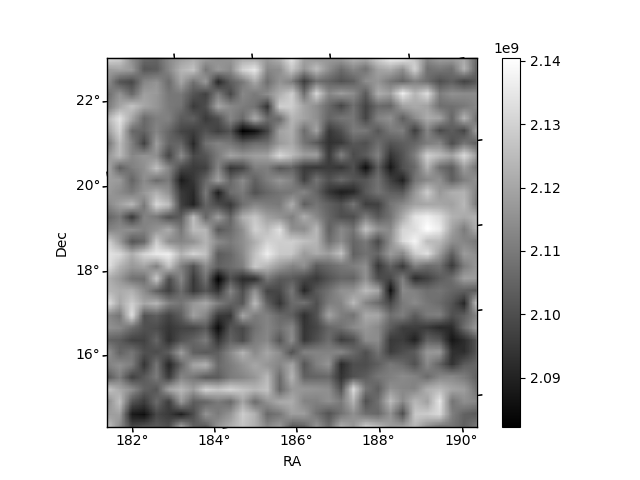
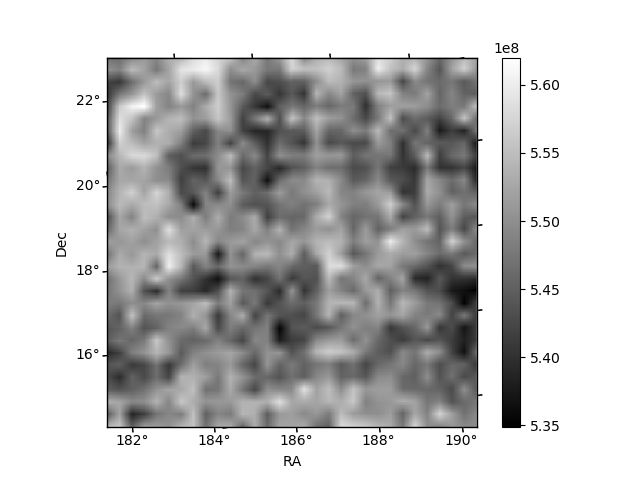
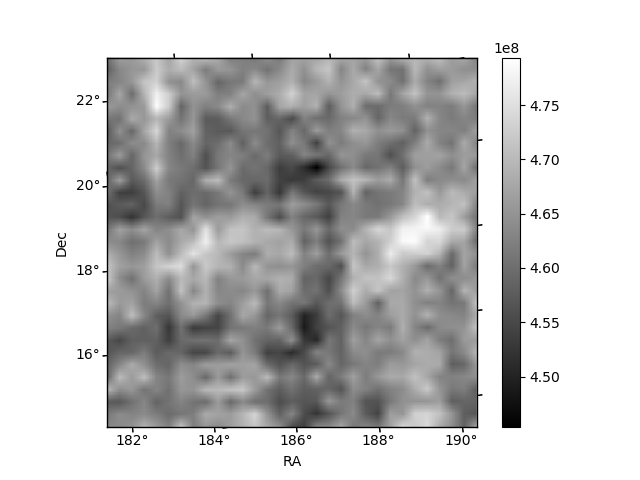
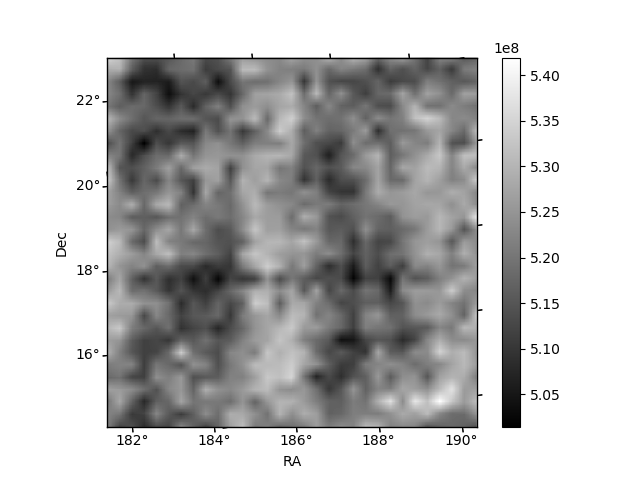
Histogram calculated using DETX and DETY for each event in the final _common_clean file
| Quadrant A | 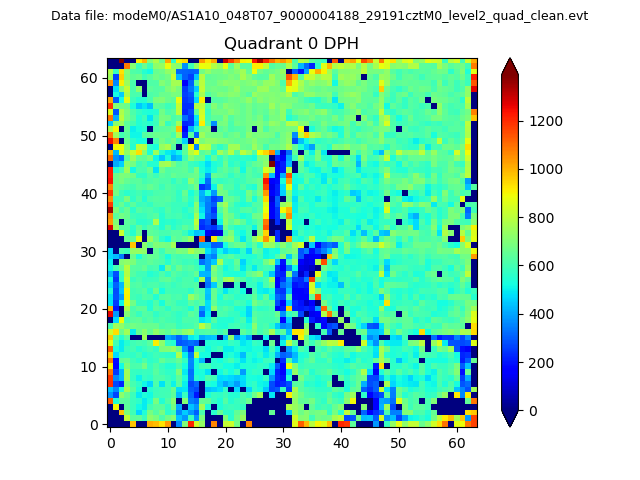 |
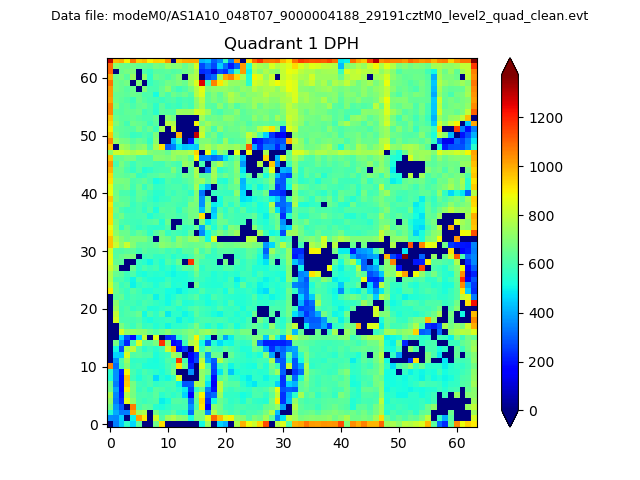 |
Quadrant B |
|---|---|---|---|
| Quadrant D | 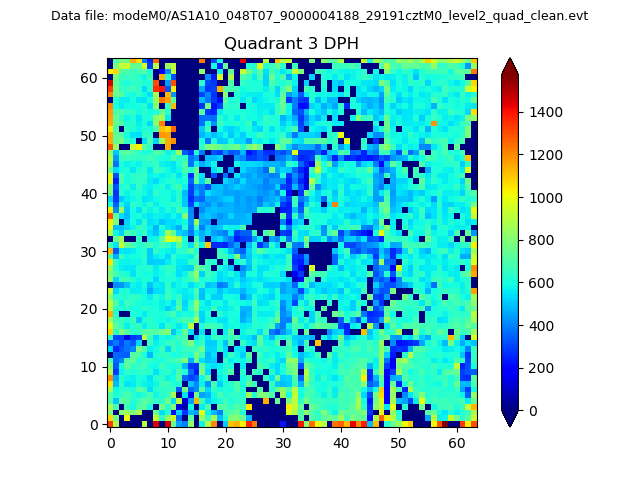 |
 |
Quadrant C |
| Plot type | Count rate plots | Images |
|---|---|---|
| Comparison with Poisson distribution Blue bars denote a histogram of data divided into 1 sec bins. Red curve is a Poisson curve with rate = median count rate of data. |
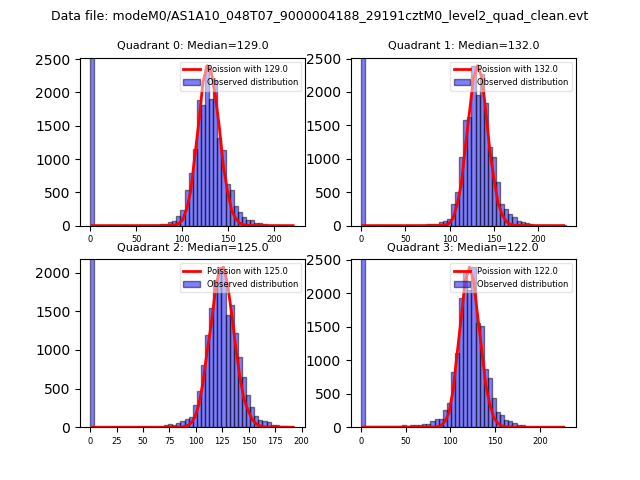 |
 |
| Quadrant-wise count rates Data is divided into 100 sec bins |
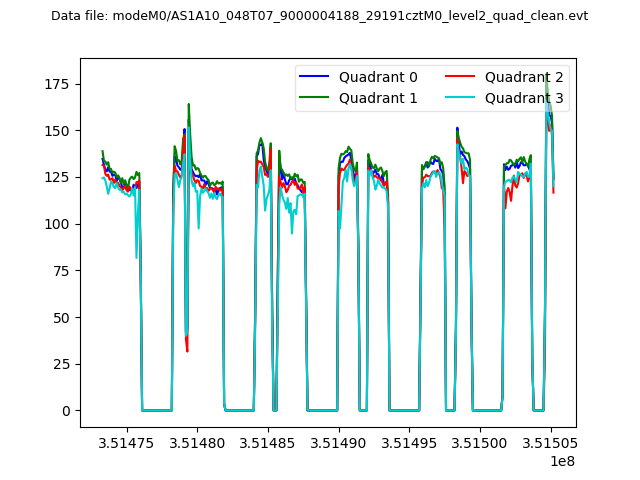 |
|
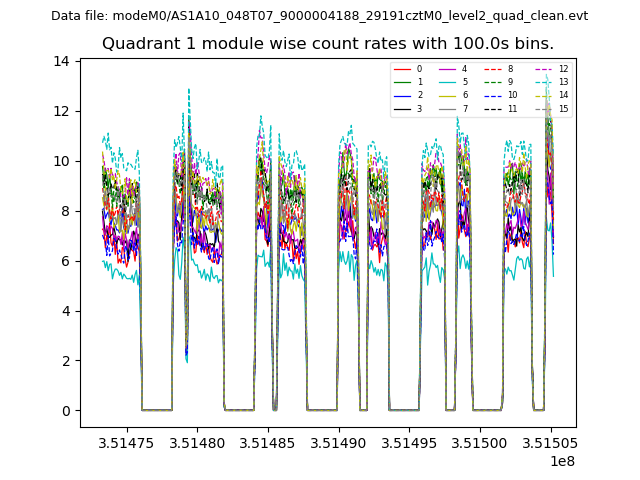
| Module-wise count rates for Quadrant A Data is divided into 100 sec bins |
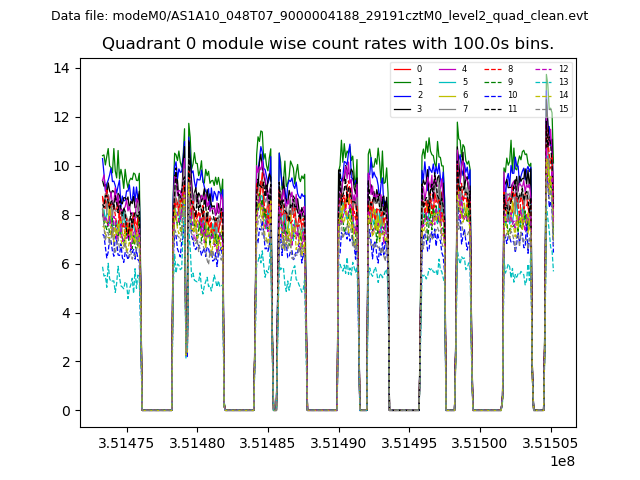 |
 |
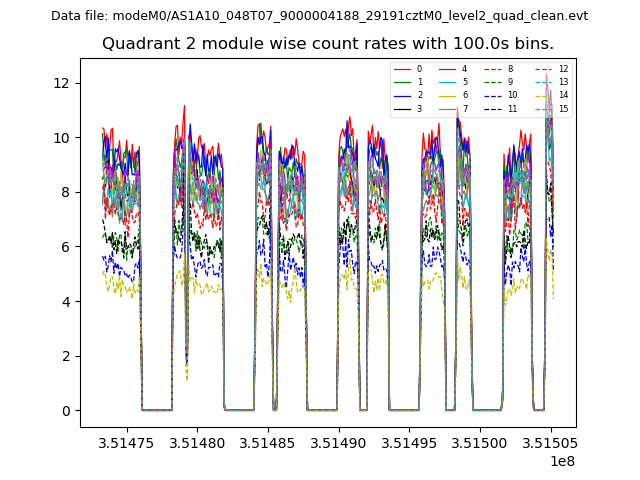
| Module-wise count rates for Quadrant B Data is divided into 100 sec bins |
 |
 |
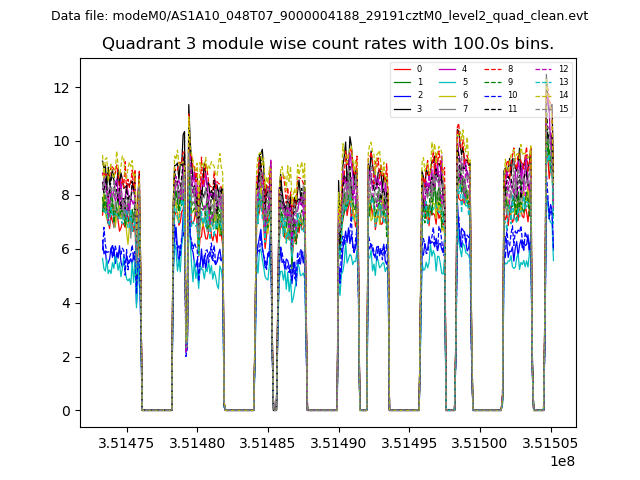
| Module-wise count rates for Quadrant C Data is divided into 100 sec bins |
 |
 |
| Module-wise count rates for Quadrant D Data is divided into 100 sec bins |
 |
 |
| Parameter | Plot |
|---|---|
| CZT HV Monitor | 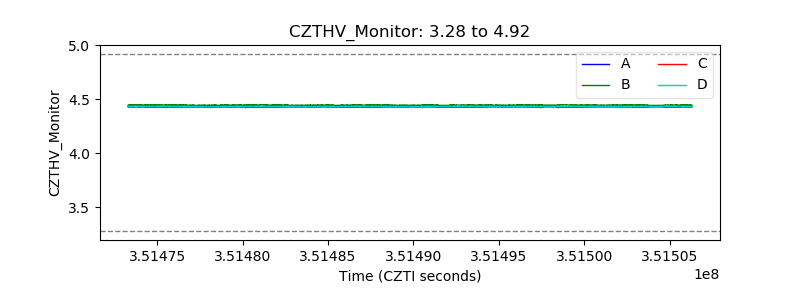 |
| D_VDD | 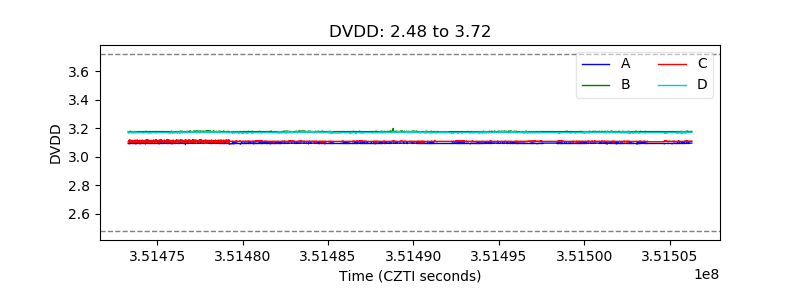 |
| Temperature 1 | 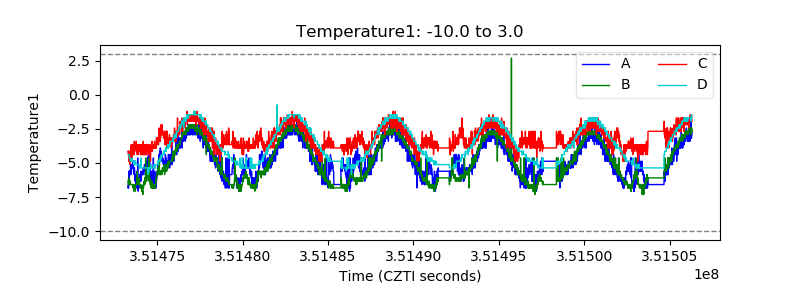 |
| Veto HV Monitor | 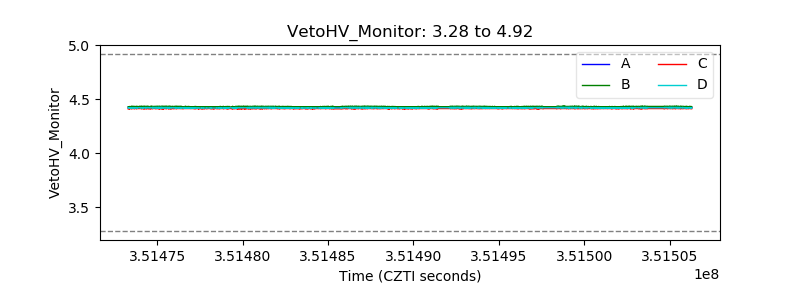 |
| Veto LLD | 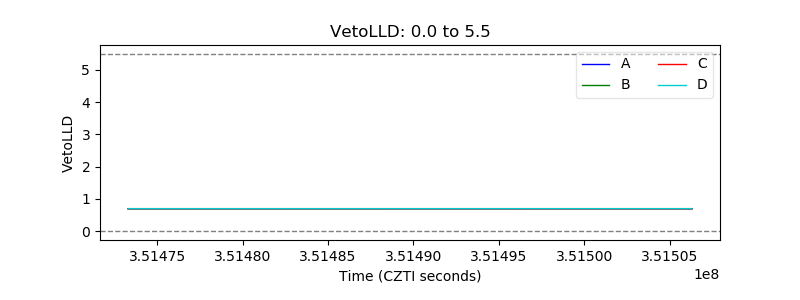 |
| Alpha Counter | 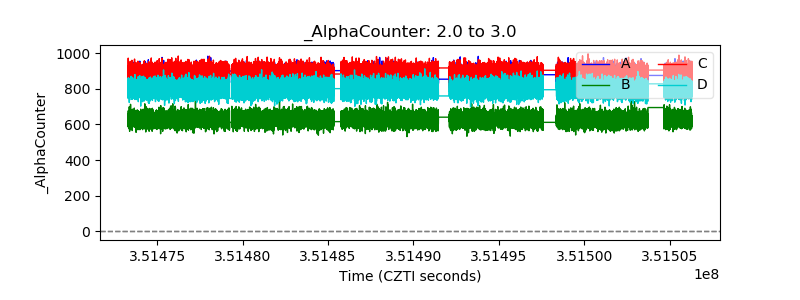 |
| _CPM_Rate | 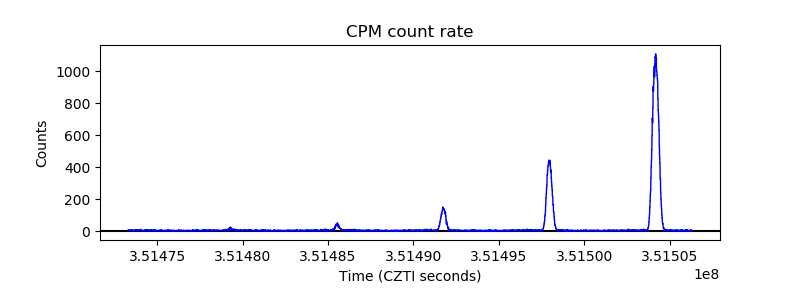 |
| CZT Counter | 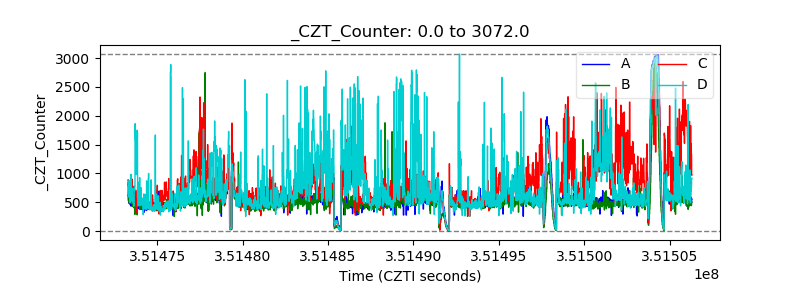 |
| +2.5 Volts monitor |  |
| +5 Volts monitor |  |
| _ROLL_ROT | 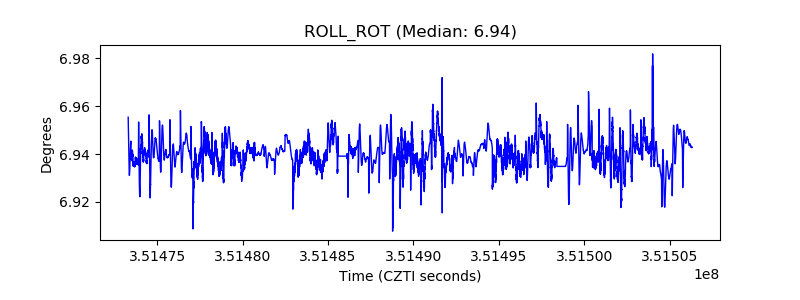 |
| _Roll_DEC | 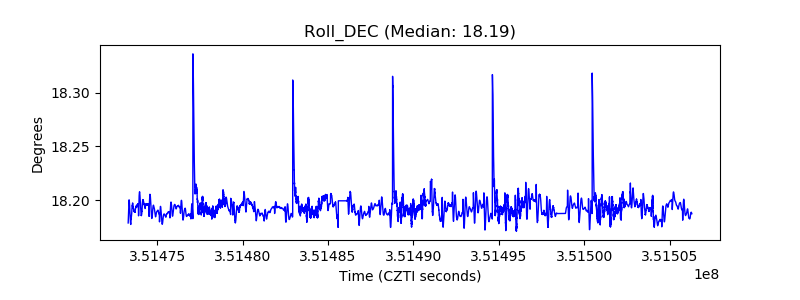 |
| _Roll_RA | 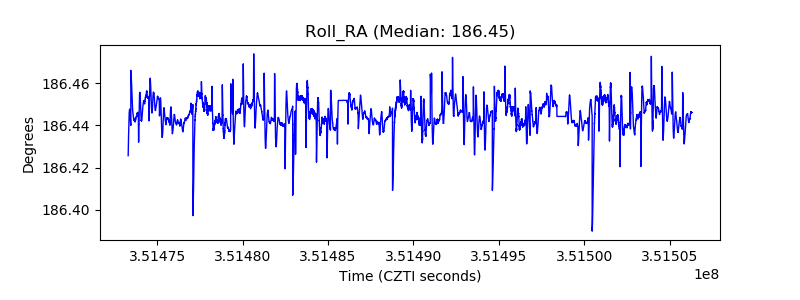 |
| Veto Counter | 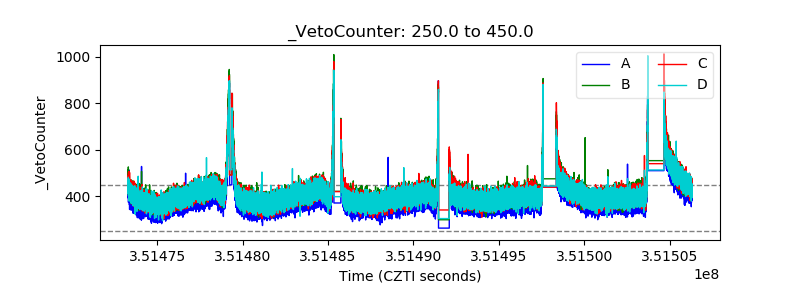 |