| Param | Original file | Final file |
|---|---|---|
| Filename | modeM0/AS1A10_048T07_9000004188_29193cztM0_level2.evt | modeM0/AS1A10_048T07_9000004188_29193cztM0_level2_quad_clean.evt |
| Size (bytes) | 720,535,680 | 72,169,920 |
| Size | 687.2 MB | 68.8 MB |
| Events in quadrant A | 3,629,327 | 444,699 |
| Events in quadrant B | 3,573,864 | 452,233 |
| Events in quadrant C | 8,720,887 | 402,125 |
| Events in quadrant D | 5,446,756 | 420,378 |
| Mode M9 | |||
|---|---|---|---|
| Quadrant | BADHDUFLAG | Total packets | Discarded packets |
| A | 0 | 11 | 0 |
| B | 0 | 12 | 0 |
| C | 0 | 12 | 0 |
| D | 0 | 12 | 0 |
| Mode SS | |||
|---|---|---|---|
| Quadrant | BADHDUFLAG | Total packets | Discarded packets |
| A | 0 | 136 | 0 |
| B | 0 | 136 | 0 |
| C | 0 | 136 | 0 |
| D | 0 | 136 | 0 |
| Mode M0 | |||
|---|---|---|---|
| Quadrant | BADHDUFLAG | Total packets | Discarded packets |
| A | 0 | 15007 | 2 |
| B | 0 | 14756 | 2 |
| C | 0 | 30626 | 4 |
| D | 0 | 21061 | 2 |
| Quadrant | Total seconds | Saturated seconds | Saturation percentage |
|---|---|---|---|
| A | 6678 | 80 | 1.197963% |
| B | 6678 | 88 | 1.317760% |
| C | 6677 | 1265 | 18.945634% |
| D | 6677 | 445 | 6.664670% |
Noise dominated data is calculated using 1-second bins in cleaned event files. If a bin has >2000 counts, and if more than 50% of those come from <1% of pixels, then it is considered to be noise-dominated and hence unusable.
| Quadrant | # 1 sec bins | Bins with >0 counts | Bins with >2000 counts | High rate bins dominated by noise | Noise dominated (total time) | Noise dominated (detector-on time) | Marked lightcurve |
|---|---|---|---|---|---|---|---|
| A | 7773 | 6679 | 0 | 0 | 0.00% | 0.00% | 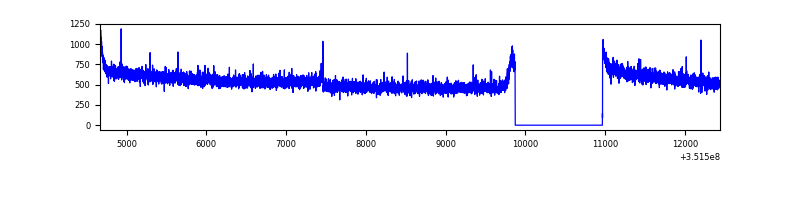 |
| B | 7773 | 6679 | 1 | 1 | 0.01% | 0.01% | 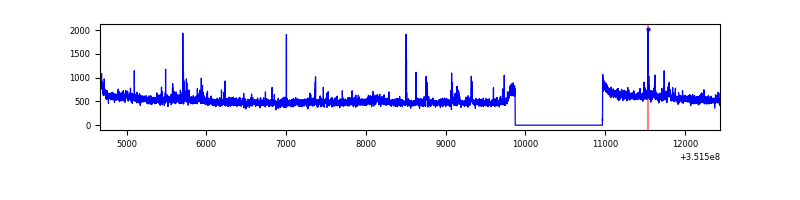 |
| C | 7772 | 6678 | 625 | 625 | 8.04% | 9.36% | 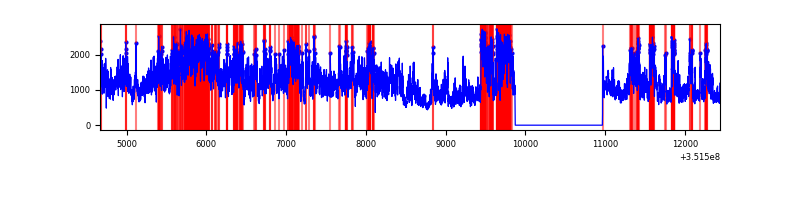 |
| D | 7772 | 6678 | 335 | 335 | 4.31% | 5.02% | 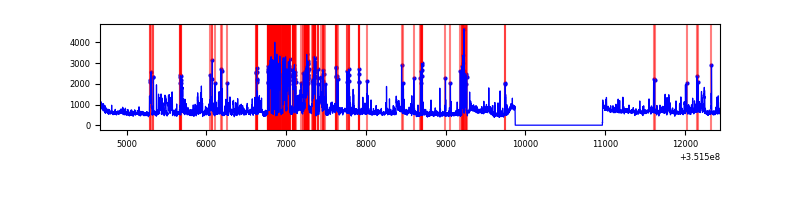 |
Top three noisy pixels from each quadrant. If the there are fewer than three noisy pixels in the level2.evt file, extra rows are filled as -1
| Pixel properties | Quadrant properties | ||||||
|---|---|---|---|---|---|---|---|
| Quadrant | DetID | PixID | Counts | Sigma | Mean | Median | Sigma |
| A | 1 | 113 | 179994 | 1005.29 | 894 | 877 | 178.2 |
| A | 13 | 254 | 12172 | 63.39 | 894 | 877 | 178.2 |
| A | 3 | 137 | 8531 | 42.96 | 894 | 877 | 178.2 |
| B | 0 | 183 | 72564 | 427.67 | 877 | 856 | 167.7 |
| B | 12 | 111 | 20667 | 118.15 | 877 | 856 | 167.7 |
| B | 11 | 111 | 19165 | 109.2 | 877 | 856 | 167.7 |
| C | 3 | 233 | 5398425 | 28527.75 | 815 | 822 | 189.2 |
| C | 14 | 238 | 130560 | 685.7 | 815 | 822 | 189.2 |
| C | 2 | 114 | 15342 | 76.74 | 815 | 822 | 189.2 |
| D | 1 | 52 | 1546327 | 7695.15 | 846 | 824 | 200.8 |
| D | 8 | 195 | 462158 | 2297.01 | 846 | 824 | 200.8 |
| D | 7 | 80 | 109916 | 543.18 | 846 | 824 | 200.8 |
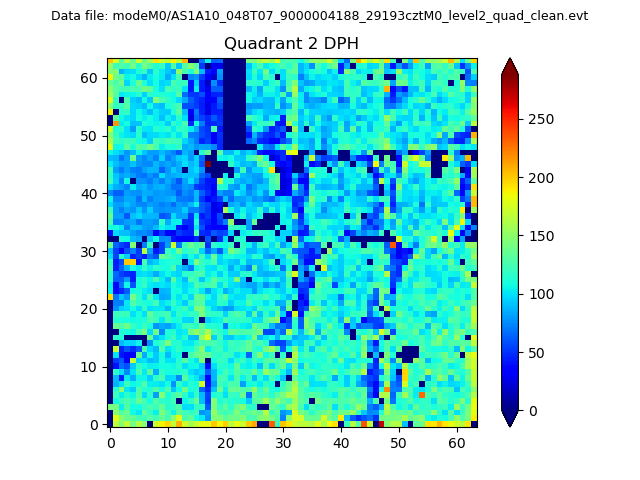
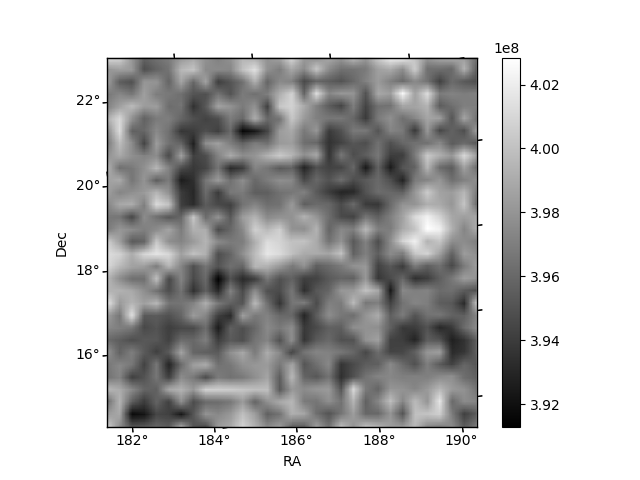
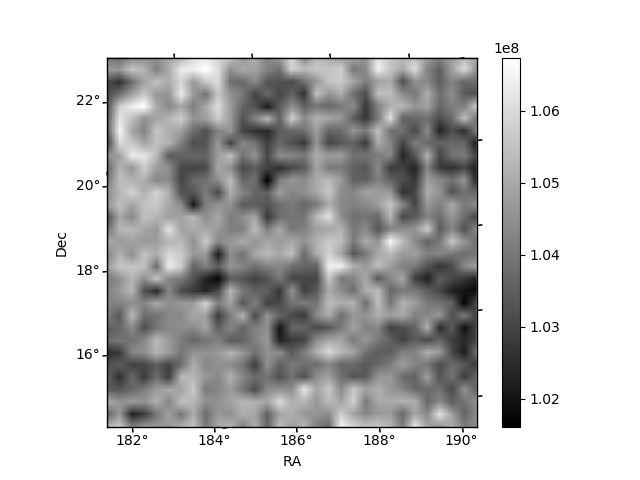
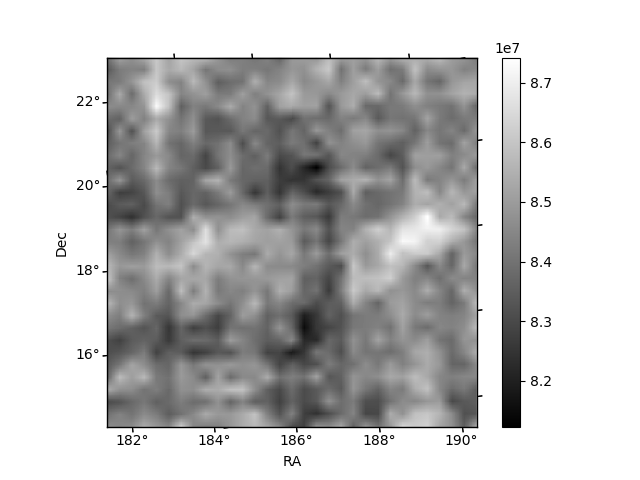
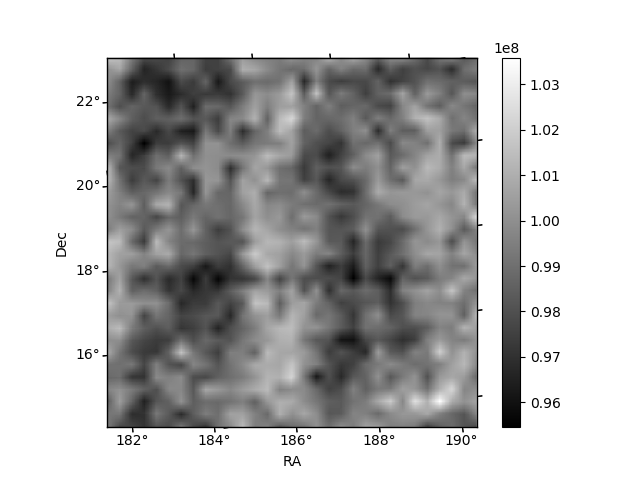
Histogram calculated using DETX and DETY for each event in the final _common_clean file
| Quadrant A | 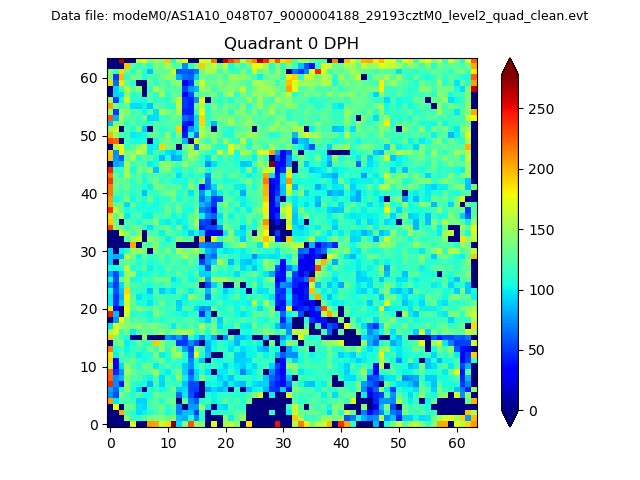 |
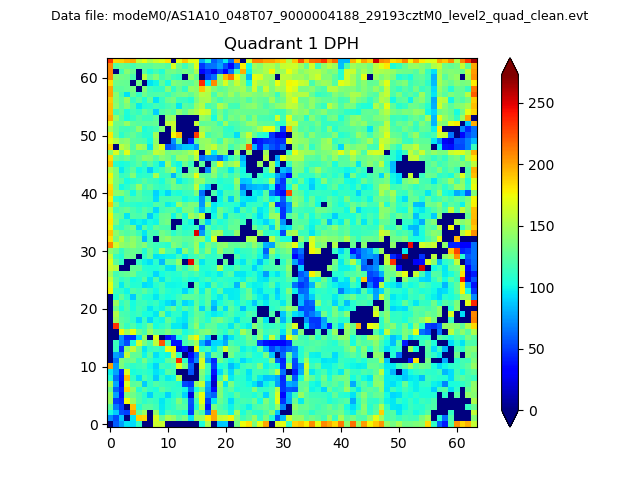 |
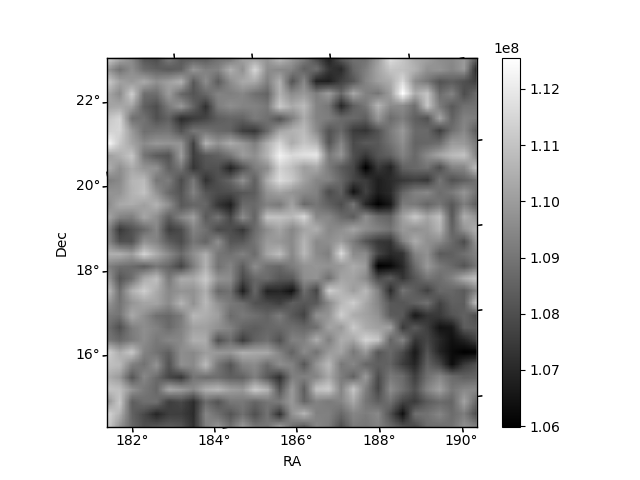
Quadrant B |
|---|---|---|---|
| Quadrant D | 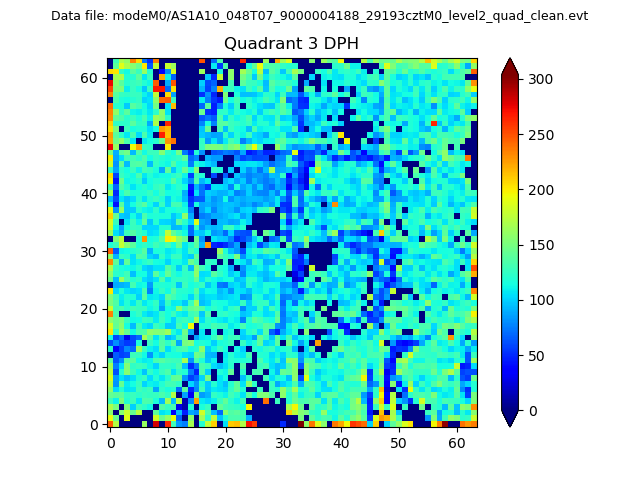 |
 |
Quadrant C |
| Plot type | Count rate plots | Images |
|---|---|---|
| Comparison with Poisson distribution Blue bars denote a histogram of data divided into 1 sec bins. Red curve is a Poisson curve with rate = median count rate of data. |
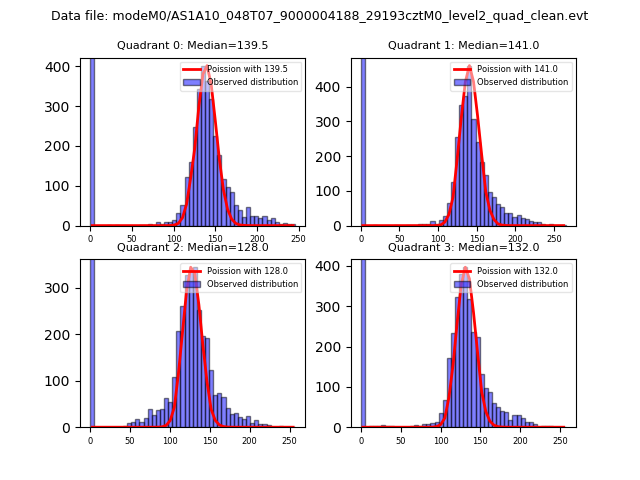 |
 |
| Quadrant-wise count rates Data is divided into 100 sec bins |
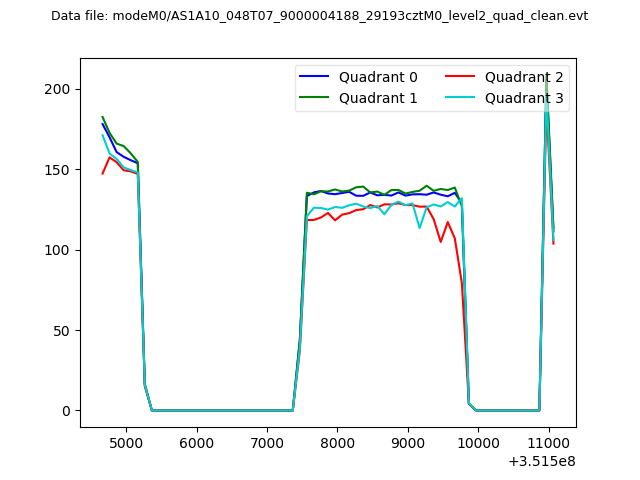 |
|
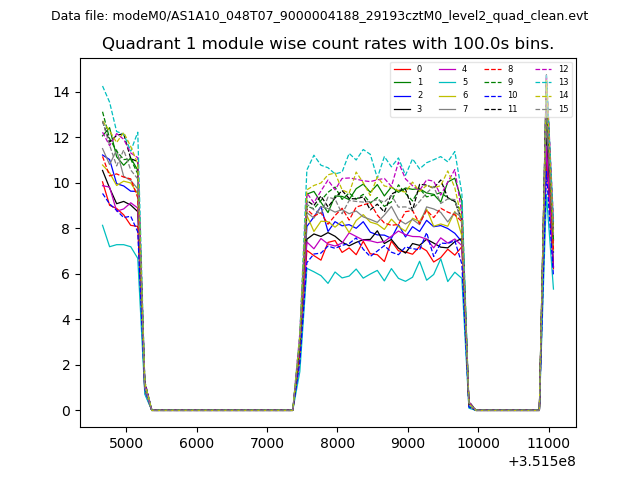
| Module-wise count rates for Quadrant A Data is divided into 100 sec bins |
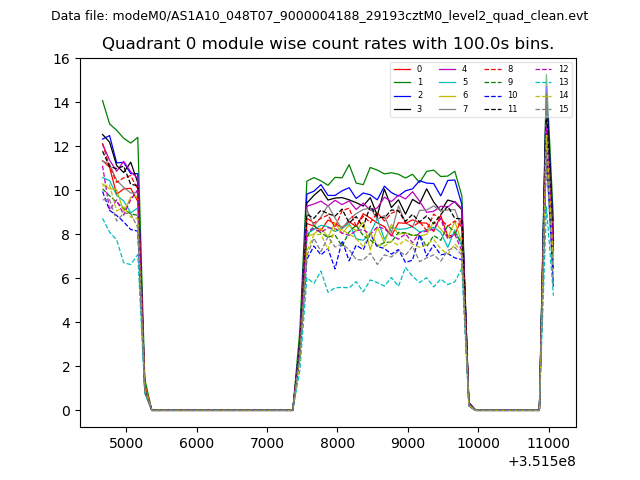 |
 |
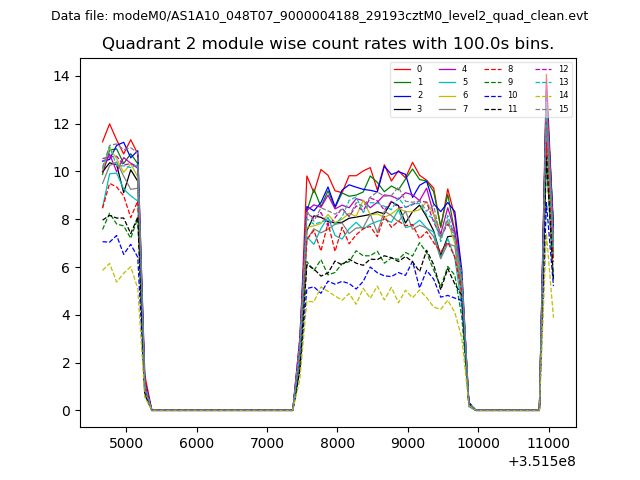
| Module-wise count rates for Quadrant B Data is divided into 100 sec bins |
 |
 |
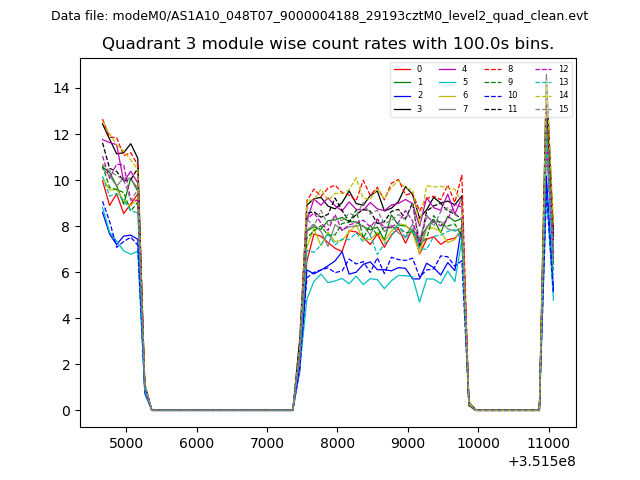
| Module-wise count rates for Quadrant C Data is divided into 100 sec bins |
 |
 |
| Module-wise count rates for Quadrant D Data is divided into 100 sec bins |
 |
 |
| Parameter | Plot |
|---|---|
| CZT HV Monitor | 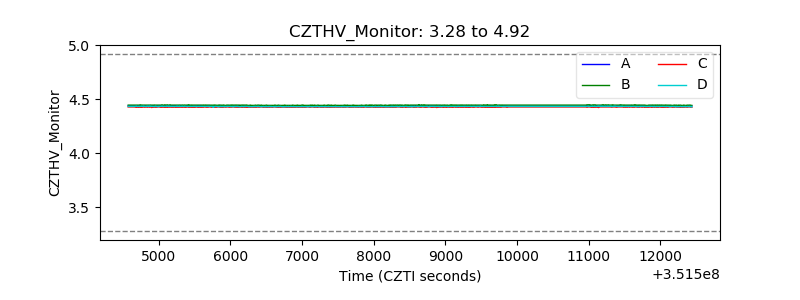 |
| D_VDD | 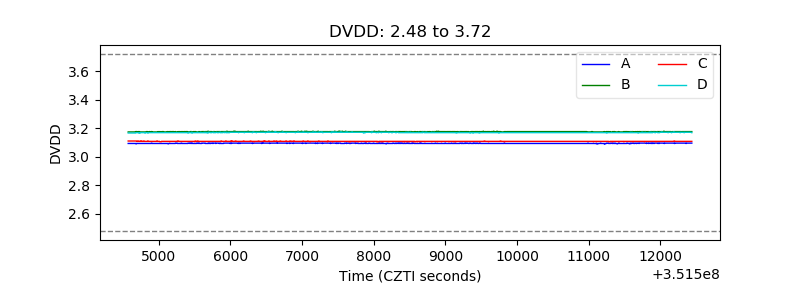 |
| Temperature 1 | 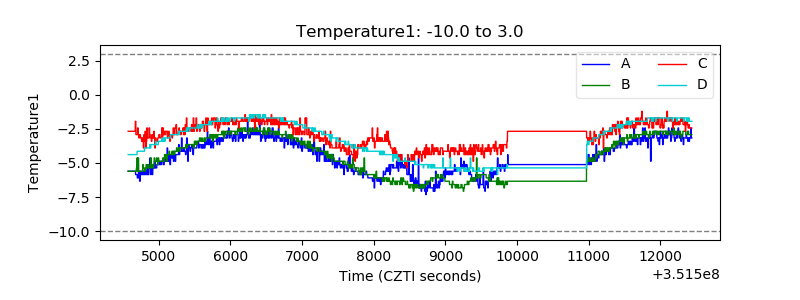 |
| Veto HV Monitor | 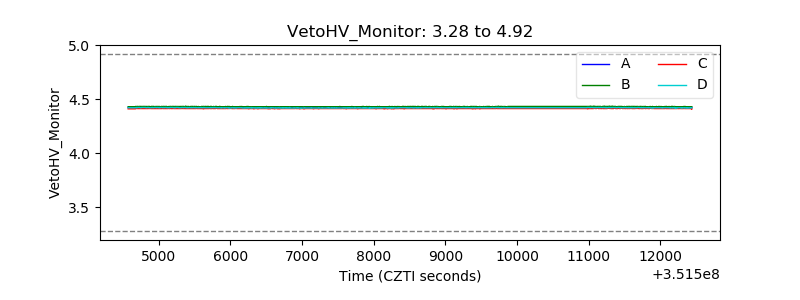 |
| Veto LLD | 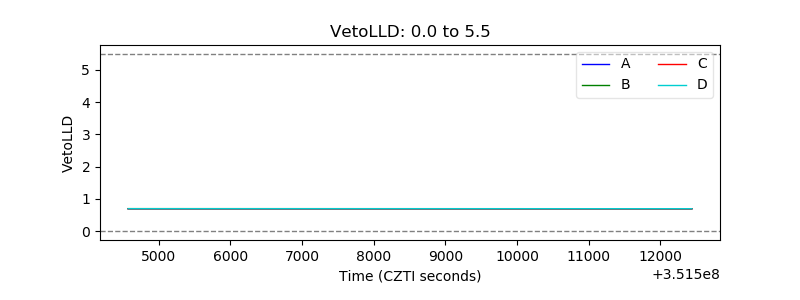 |
| Alpha Counter | 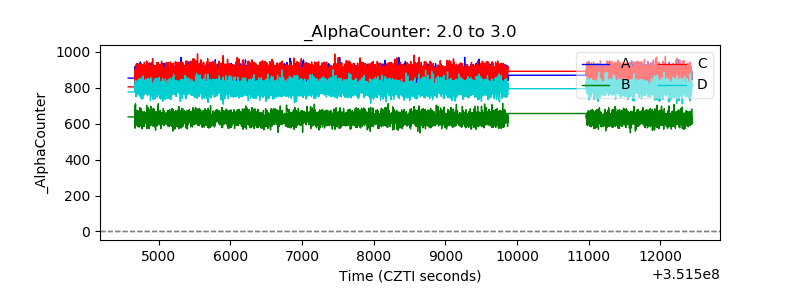 |
| _CPM_Rate | 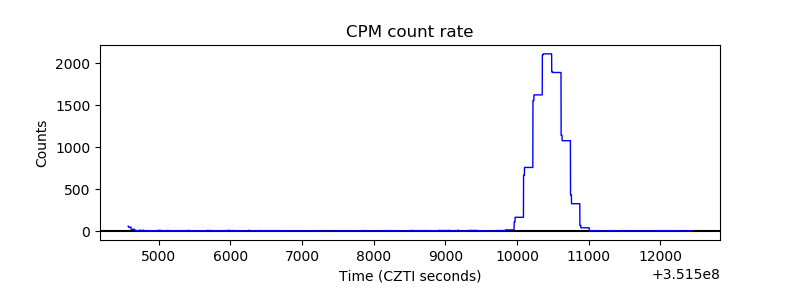 |
| CZT Counter | 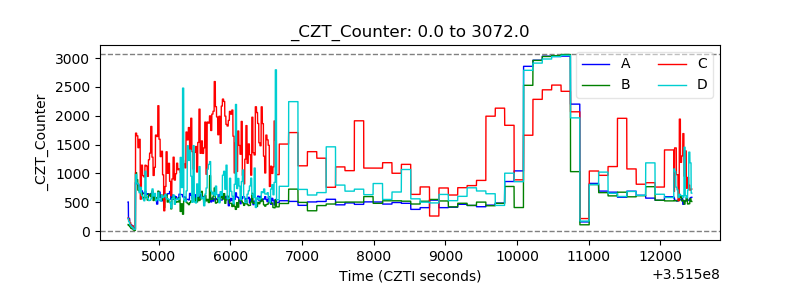 |
| +2.5 Volts monitor |  |
| +5 Volts monitor |  |
| _ROLL_ROT | 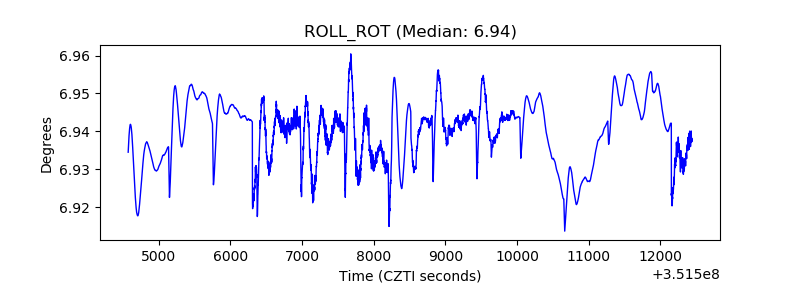 |
| _Roll_DEC | 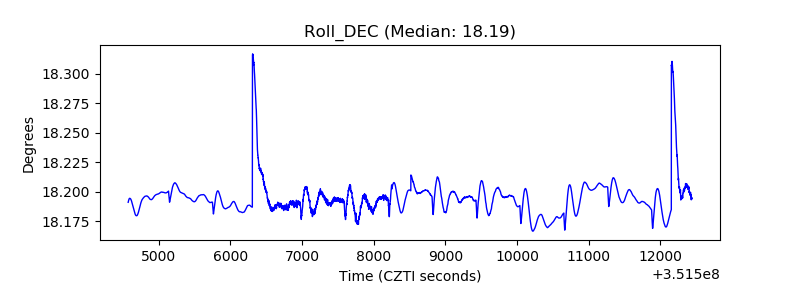 |
| _Roll_RA | 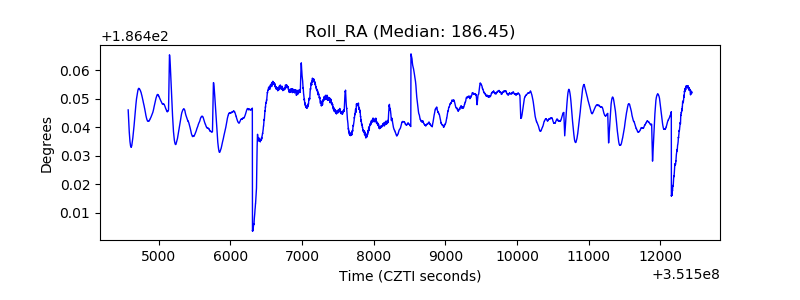 |
| Veto Counter | 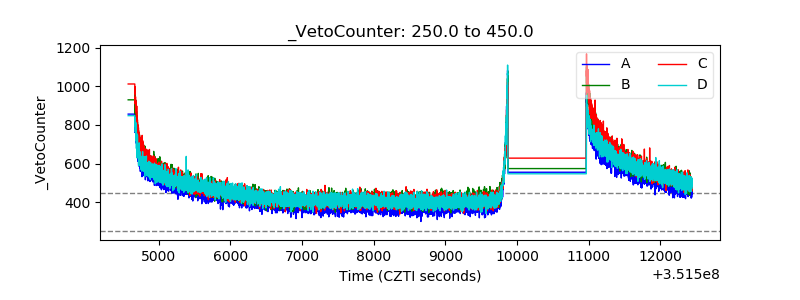 |