| Param | Original file | Final file |
|---|---|---|
| Filename | modeM0/AS1A10_048T07_9000004188_29195cztM0_level2.evt | modeM0/AS1A10_048T07_9000004188_29195cztM0_level2_quad_clean.evt |
| Size (bytes) | 615,968,640 | 71,611,200 |
| Size | 587.4 MB | 68.3 MB |
| Events in quadrant A | 3,574,781 | 441,048 |
| Events in quadrant B | 3,789,923 | 447,013 |
| Events in quadrant C | 5,344,965 | 424,731 |
| Events in quadrant D | 5,518,365 | 414,902 |
| Mode M9 | |||
|---|---|---|---|
| Quadrant | BADHDUFLAG | Total packets | Discarded packets |
| A | 0 | 13 | 0 |
| B | 0 | 14 | 0 |
| C | 0 | 14 | 0 |
| D | 0 | 14 | 0 |
| Mode SS | |||
|---|---|---|---|
| Quadrant | BADHDUFLAG | Total packets | Discarded packets |
| A | 0 | 128 | 0 |
| B | 0 | 128 | 0 |
| C | 0 | 128 | 0 |
| D | 0 | 128 | 0 |
| Mode M0 | |||
|---|---|---|---|
| Quadrant | BADHDUFLAG | Total packets | Discarded packets |
| A | 0 | 14840 | 2 |
| B | 0 | 15544 | 2 |
| C | 0 | 20550 | 2 |
| D | 0 | 20823 | 2 |
| Quadrant | Total seconds | Saturated seconds | Saturation percentage |
|---|---|---|---|
| A | 6314 | 90 | 1.425404% |
| B | 6313 | 114 | 1.805798% |
| C | 6313 | 333 | 5.274830% |
| D | 6313 | 361 | 5.718359% |
Noise dominated data is calculated using 1-second bins in cleaned event files. If a bin has >2000 counts, and if more than 50% of those come from <1% of pixels, then it is considered to be noise-dominated and hence unusable.
| Quadrant | # 1 sec bins | Bins with >0 counts | Bins with >2000 counts | High rate bins dominated by noise | Noise dominated (total time) | Noise dominated (detector-on time) | Marked lightcurve |
|---|---|---|---|---|---|---|---|
| A | 7609 | 6315 | 0 | 0 | 0.00% | 0.00% | 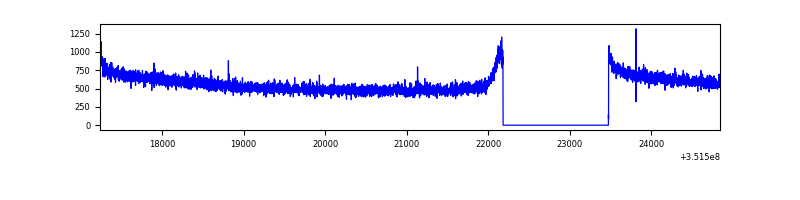 |
| B | 7608 | 6314 | 3 | 3 | 0.04% | 0.05% | 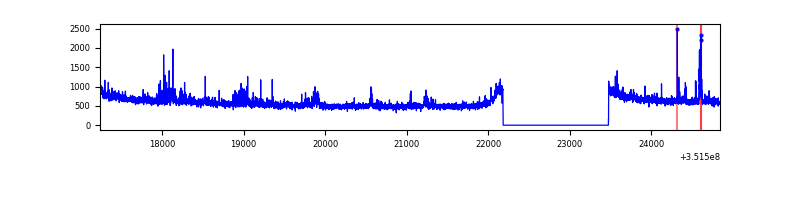 |
| C | 7608 | 6314 | 30 | 30 | 0.39% | 0.48% | 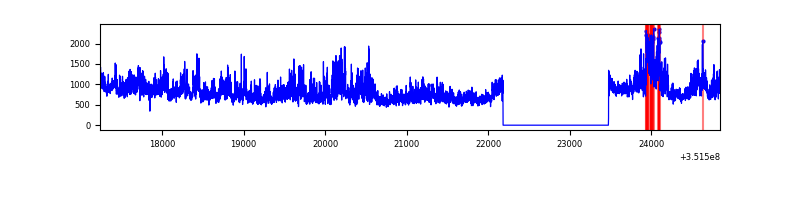 |
| D | 7608 | 6314 | 261 | 261 | 3.43% | 4.13% | 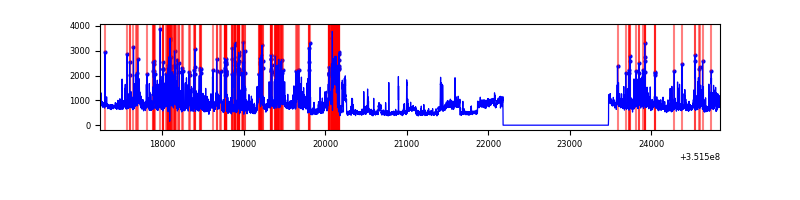 |
Top three noisy pixels from each quadrant. If the there are fewer than three noisy pixels in the level2.evt file, extra rows are filled as -1
| Pixel properties | Quadrant properties | ||||||
|---|---|---|---|---|---|---|---|
| Quadrant | DetID | PixID | Counts | Sigma | Mean | Median | Sigma |
| A | 13 | 254 | 11680 | 58.75 | 927 | 912 | 183.3 |
| A | 3 | 137 | 8202 | 39.77 | 927 | 912 | 183.3 |
| A | 0 | 226 | 7969 | 38.5 | 927 | 912 | 183.3 |
| B | 0 | 183 | 167388 | 983.54 | 913 | 895 | 169.3 |
| B | 12 | 111 | 19726 | 111.24 | 913 | 895 | 169.3 |
| B | 11 | 111 | 18445 | 103.67 | 913 | 895 | 169.3 |
| C | 3 | 233 | 1720474 | 8402.87 | 888 | 898 | 204.6 |
| C | 14 | 238 | 148125 | 719.44 | 888 | 898 | 204.6 |
| C | 2 | 114 | 15264 | 70.2 | 888 | 898 | 204.6 |
| D | 1 | 52 | 1246925 | 6014.79 | 894 | 878 | 207.2 |
| D | 8 | 195 | 608982 | 2935.38 | 894 | 878 | 207.2 |
| D | 13 | 104 | 186939 | 898.13 | 894 | 878 | 207.2 |
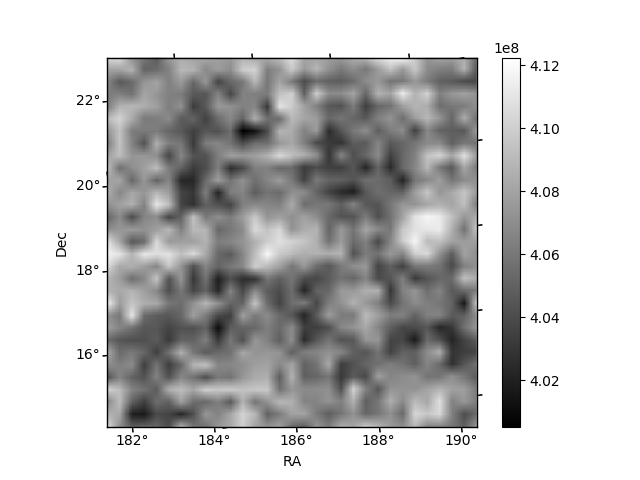
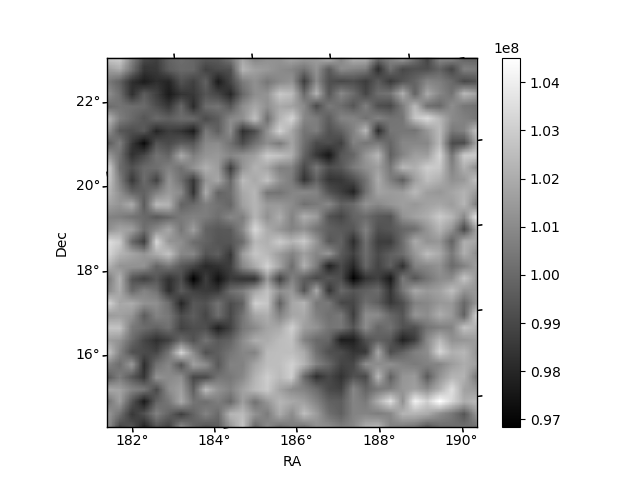
Histogram calculated using DETX and DETY for each event in the final _common_clean file
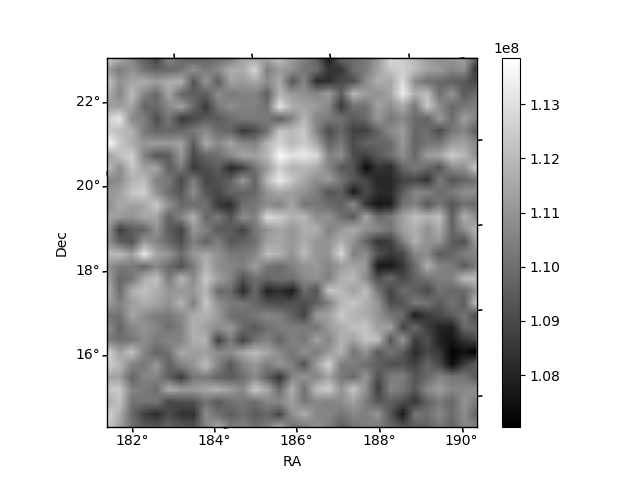
| Quadrant A | 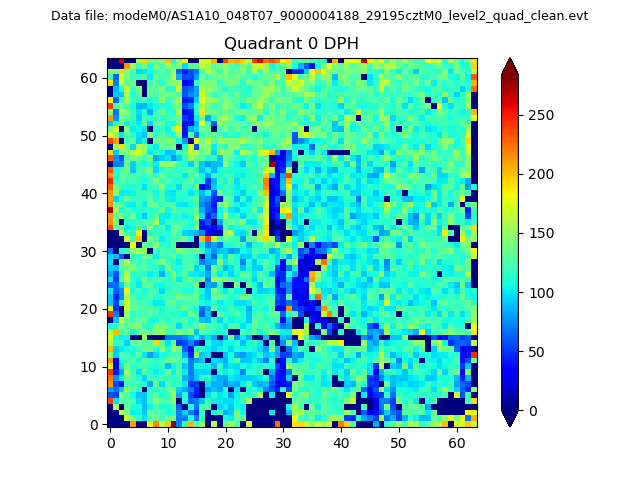 |
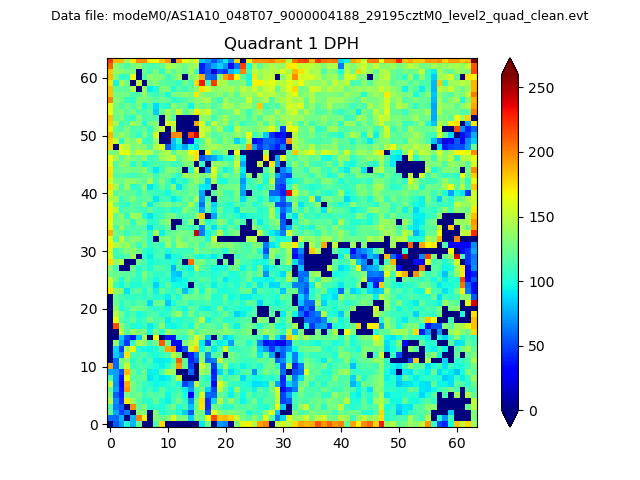 |
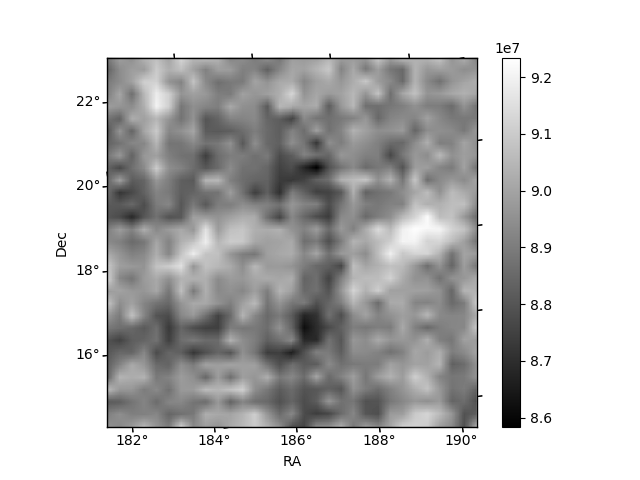
Quadrant B |
|---|---|---|---|
| Quadrant D | 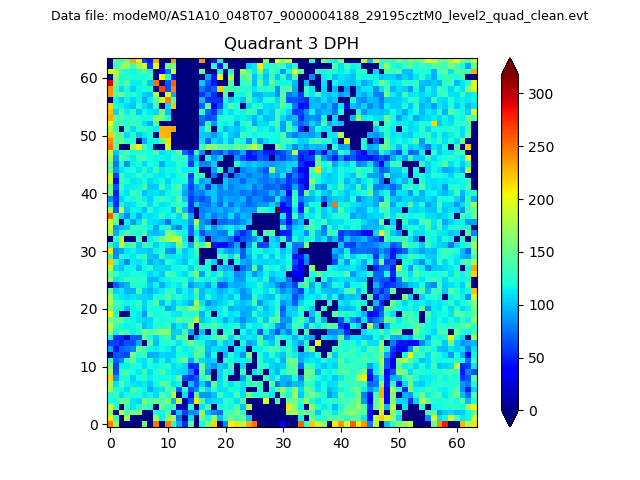 |
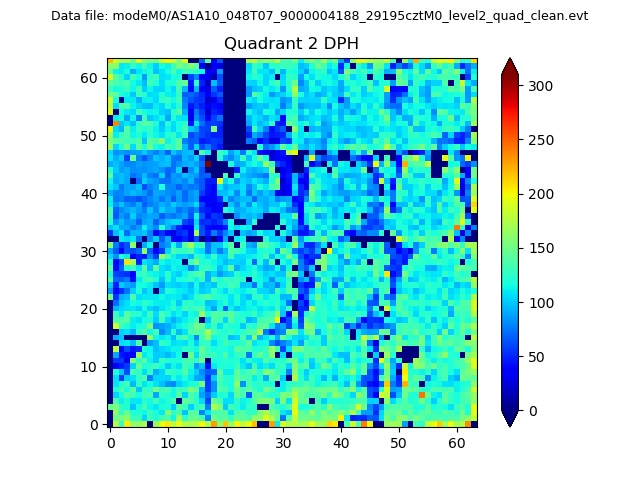 |
Quadrant C |
| Plot type | Count rate plots | Images |
|---|---|---|
| Comparison with Poisson distribution Blue bars denote a histogram of data divided into 1 sec bins. Red curve is a Poisson curve with rate = median count rate of data. |
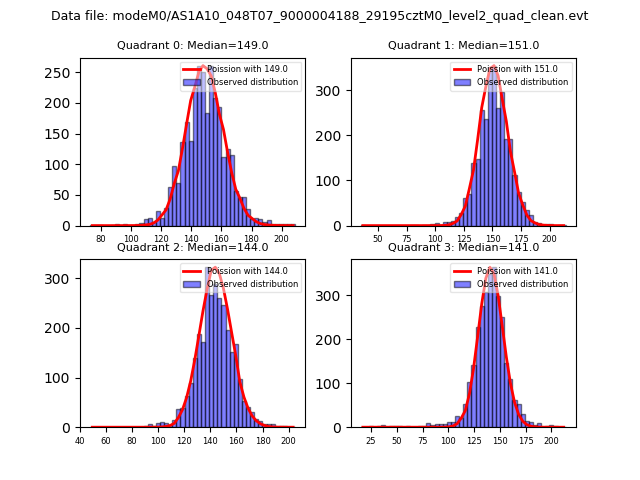 |
 |
| Quadrant-wise count rates Data is divided into 100 sec bins |
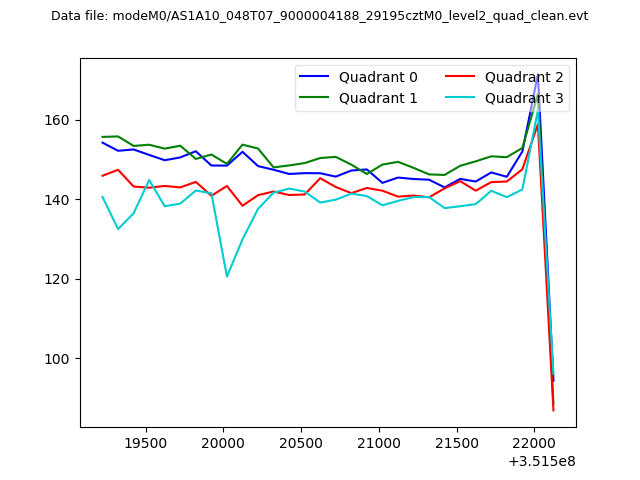 |
|
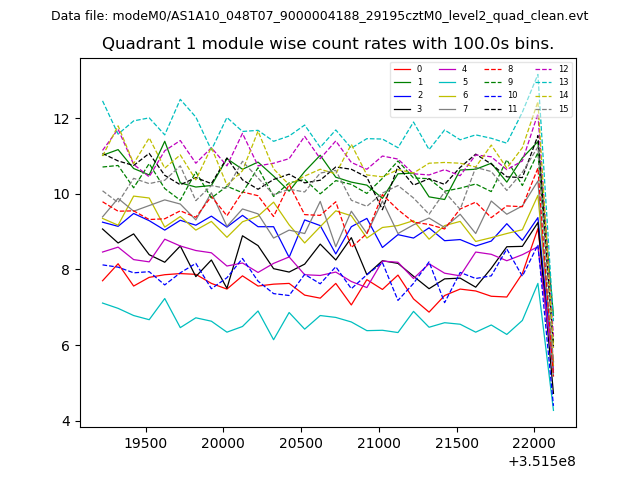
| Module-wise count rates for Quadrant A Data is divided into 100 sec bins |
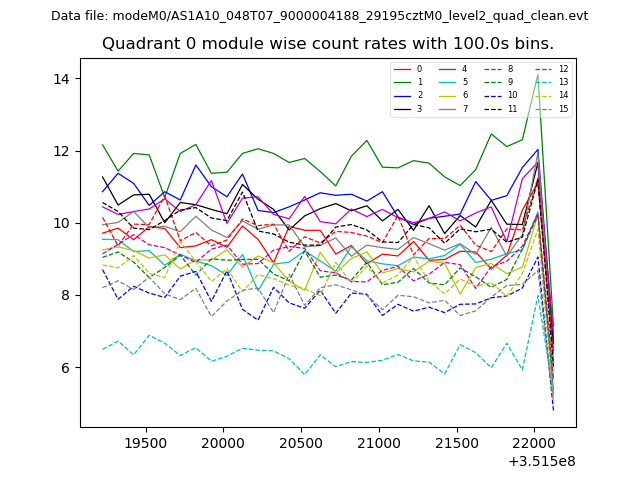 |
 |
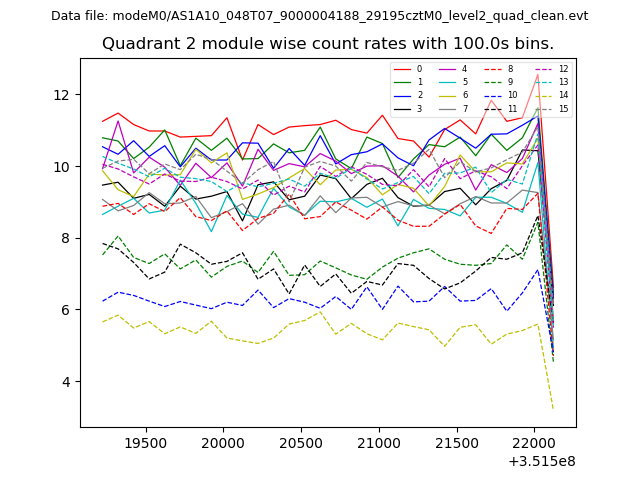
| Module-wise count rates for Quadrant B Data is divided into 100 sec bins |
 |
 |
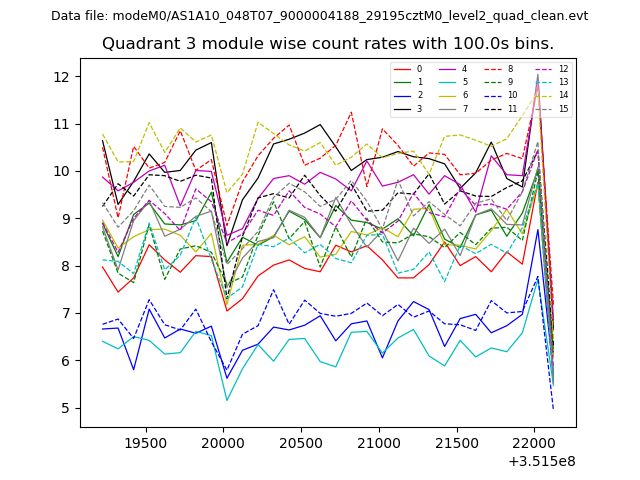
| Module-wise count rates for Quadrant C Data is divided into 100 sec bins |
 |
 |
| Module-wise count rates for Quadrant D Data is divided into 100 sec bins |
 |
 |
| Parameter | Plot |
|---|---|
| CZT HV Monitor | 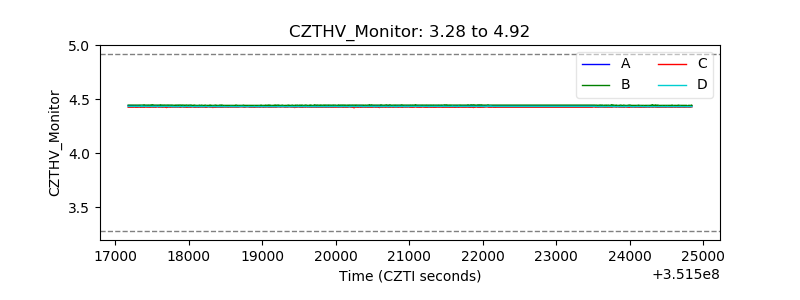 |
| D_VDD | 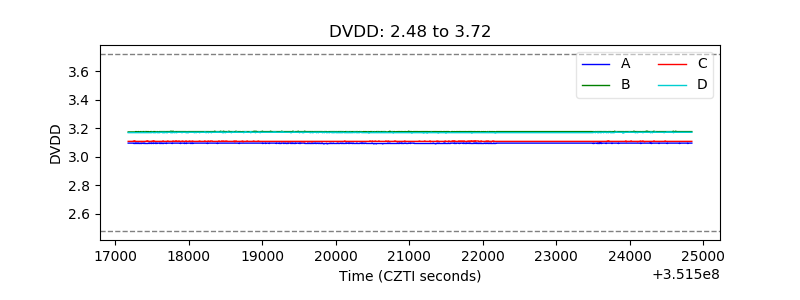 |
| Temperature 1 | 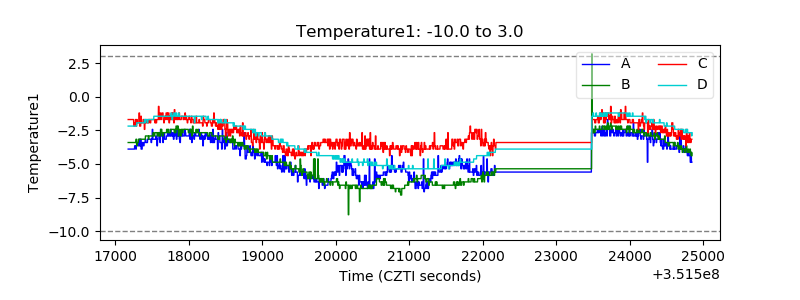 |
| Veto HV Monitor | 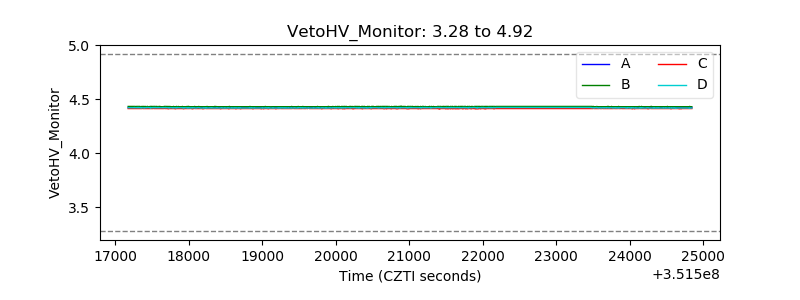 |
| Veto LLD | 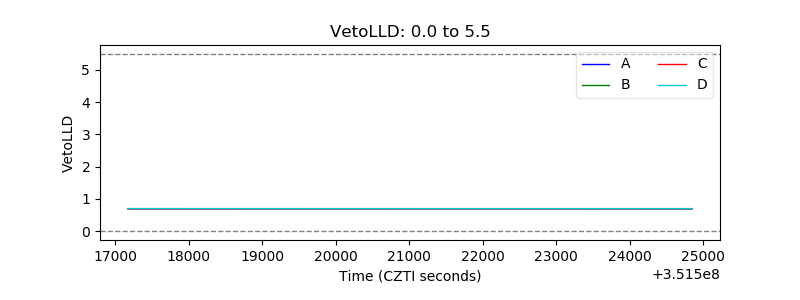 |
| Alpha Counter | 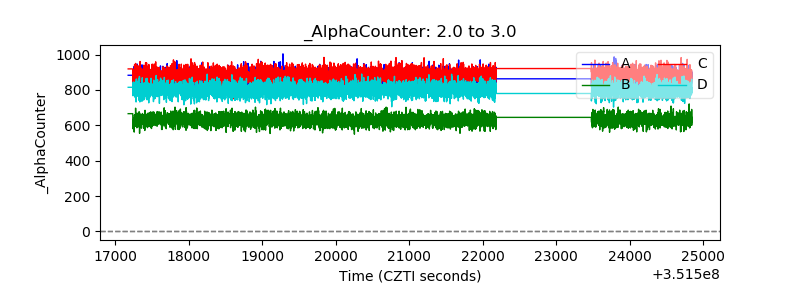 |
| _CPM_Rate | 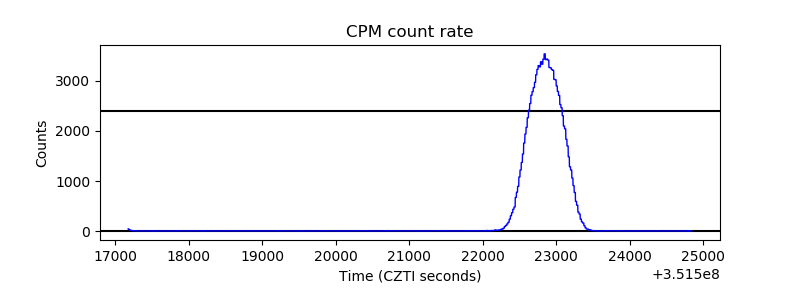 |
| CZT Counter | 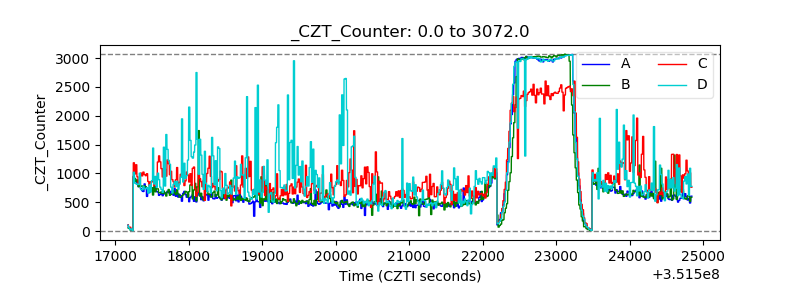 |
| +2.5 Volts monitor |  |
| +5 Volts monitor |  |
| _ROLL_ROT | 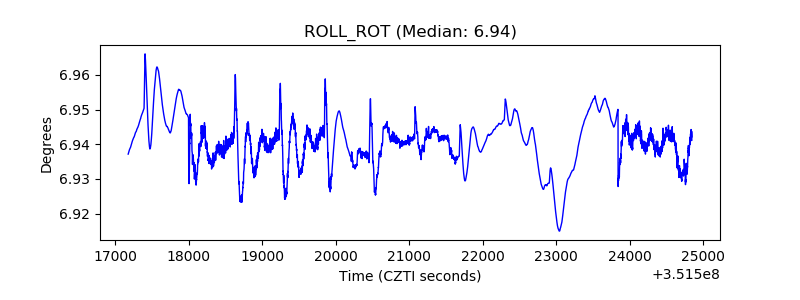 |
| _Roll_DEC | 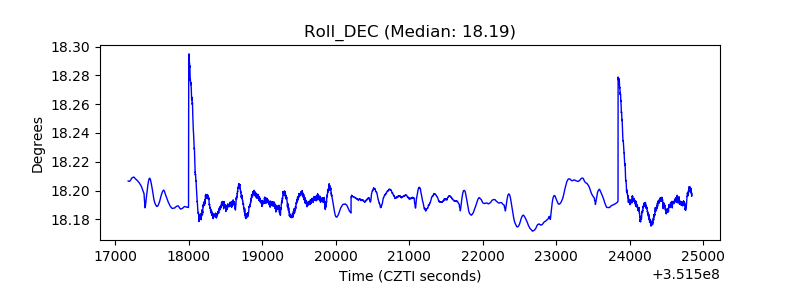 |
| _Roll_RA | 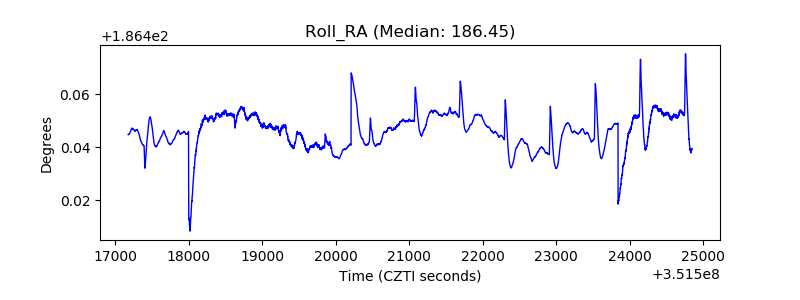 |
| Veto Counter | 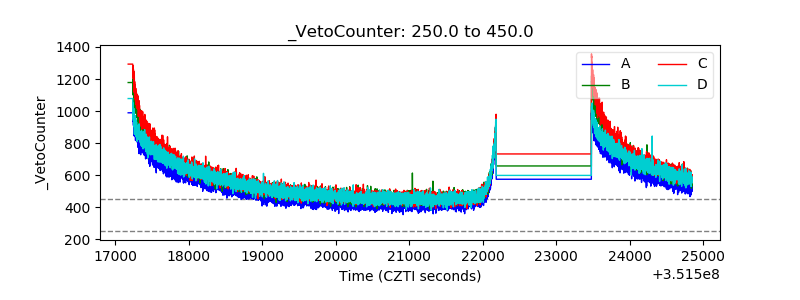 |