| Param | Original file | Final file |
|---|---|---|
| Filename | modeM0/AS1A10_048T07_9000004188_29197cztM0_level2.evt | modeM0/AS1A10_048T07_9000004188_29197cztM0_level2_quad_clean.evt |
| Size (bytes) | 299,851,200 | 54,129,600 |
| Size | 286.0 MB | 51.6 MB |
| Events in quadrant A | 1,837,406 | 350,989 |
| Events in quadrant B | 2,036,995 | 358,010 |
| Events in quadrant C | 2,067,876 | 348,097 |
| Events in quadrant D | 2,899,129 | 332,979 |
| Mode M9 | |||
|---|---|---|---|
| Quadrant | BADHDUFLAG | Total packets | Discarded packets |
| A | 0 | 9 | 0 |
| B | 0 | 10 | 0 |
| C | 0 | 10 | 0 |
| D | 0 | 10 | 0 |
| Mode SS | |||
|---|---|---|---|
| Quadrant | BADHDUFLAG | Total packets | Discarded packets |
| A | 0 | 70 | 0 |
| B | 0 | 70 | 0 |
| C | 0 | 70 | 0 |
| D | 0 | 70 | 0 |
| Mode M0 | |||
|---|---|---|---|
| Quadrant | BADHDUFLAG | Total packets | Discarded packets |
| A | 0 | 7781 | 1 |
| B | 0 | 8445 | 1 |
| C | 0 | 8589 | 1 |
| D | 0 | 11059 | 1 |
| Quadrant | Total seconds | Saturated seconds | Saturation percentage |
|---|---|---|---|
| A | 3513 | 11 | 0.313123% |
| B | 3513 | 27 | 0.768574% |
| C | 3513 | 45 | 1.280956% |
| D | 3513 | 171 | 4.867635% |
Noise dominated data is calculated using 1-second bins in cleaned event files. If a bin has >2000 counts, and if more than 50% of those come from <1% of pixels, then it is considered to be noise-dominated and hence unusable.
| Quadrant | # 1 sec bins | Bins with >0 counts | Bins with >2000 counts | High rate bins dominated by noise | Noise dominated (total time) | Noise dominated (detector-on time) | Marked lightcurve |
|---|---|---|---|---|---|---|---|
| A | 3513 | 3513 | 0 | 0 | 0.00% | 0.00% | 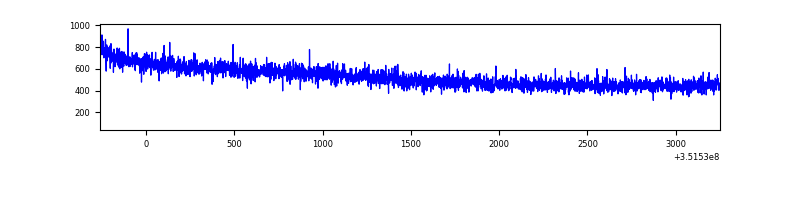 |
| B | 3513 | 3513 | 3 | 3 | 0.09% | 0.09% | 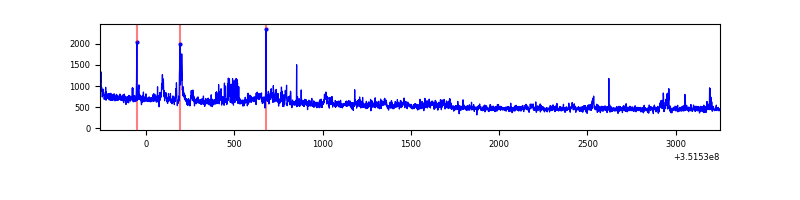 |
| C | 3513 | 3513 | 1 | 1 | 0.03% | 0.03% | 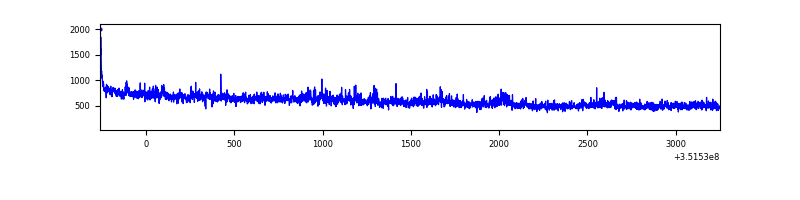 |
| D | 3513 | 3513 | 126 | 126 | 3.59% | 3.59% |  |
Top three noisy pixels from each quadrant. If the there are fewer than three noisy pixels in the level2.evt file, extra rows are filled as -1
| Pixel properties | Quadrant properties | ||||||
|---|---|---|---|---|---|---|---|
| Quadrant | DetID | PixID | Counts | Sigma | Mean | Median | Sigma |
| A | 13 | 254 | 6783 | 66.71 | 476 | 469 | 94.7 |
| A | 3 | 137 | 4296 | 40.43 | 476 | 469 | 94.7 |
| A | 0 | 226 | 4080 | 38.15 | 476 | 469 | 94.7 |
| B | 0 | 183 | 114464 | 1278.93 | 478 | 468 | 89.1 |
| B | 5 | 255 | 22514 | 247.34 | 478 | 468 | 89.1 |
| B | 3 | 209 | 12183 | 131.43 | 478 | 468 | 89.1 |
| C | 3 | 233 | 140674 | 1293.95 | 471 | 476 | 108.3 |
| C | 14 | 238 | 78122 | 716.63 | 471 | 476 | 108.3 |
| C | 2 | 114 | 8219 | 71.46 | 471 | 476 | 108.3 |
| D | 1 | 52 | 948004 | 8546.31 | 460 | 450 | 110.9 |
| D | 8 | 195 | 139550 | 1254.59 | 460 | 450 | 110.9 |
| D | 13 | 153 | 49364 | 441.17 | 460 | 450 | 110.9 |
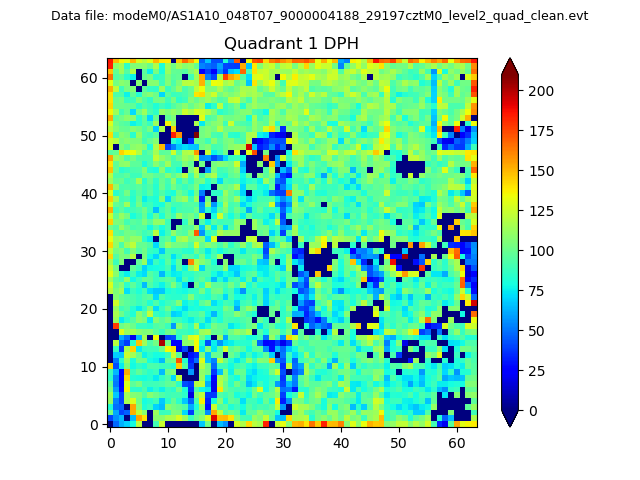
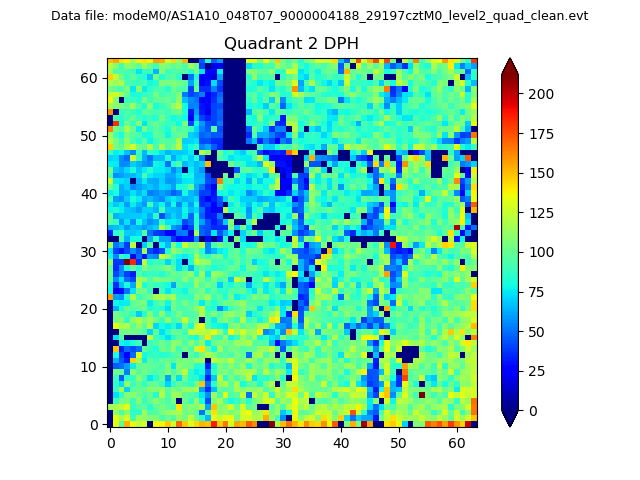
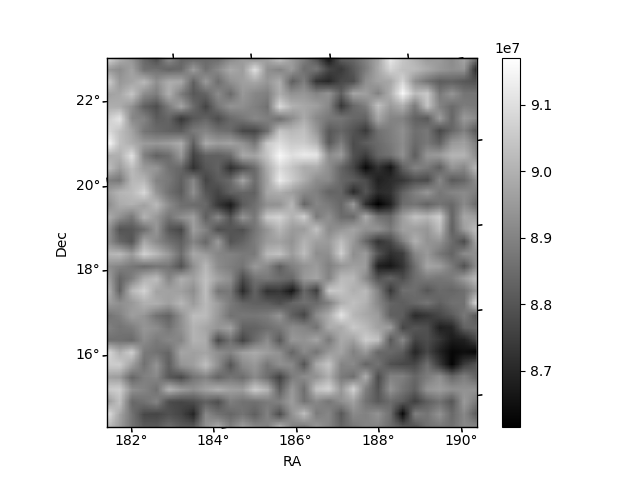
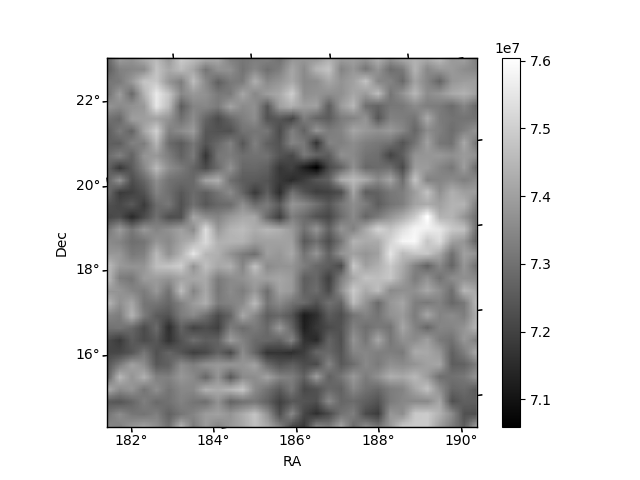
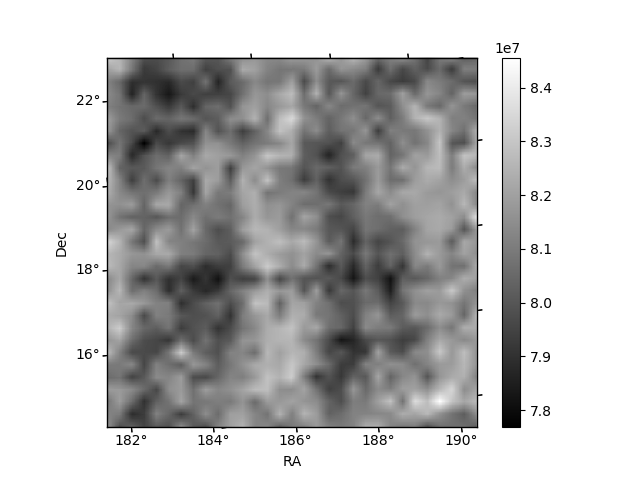
Histogram calculated using DETX and DETY for each event in the final _common_clean file
| Quadrant A | 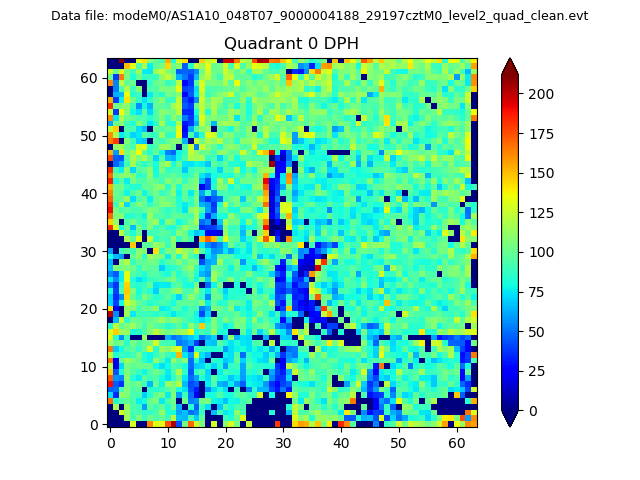 |
 |
Quadrant B |
|---|---|---|---|
| Quadrant D |  |
 |
Quadrant C |
| Plot type | Count rate plots | Images |
|---|---|---|
| Comparison with Poisson distribution Blue bars denote a histogram of data divided into 1 sec bins. Red curve is a Poisson curve with rate = median count rate of data. |
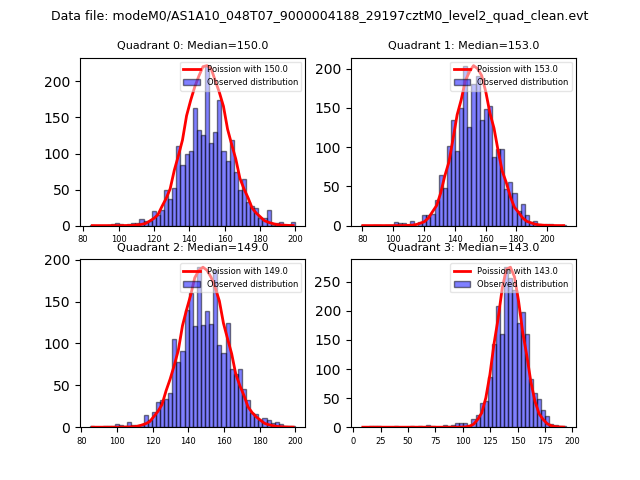 |
 |
| Quadrant-wise count rates Data is divided into 100 sec bins |
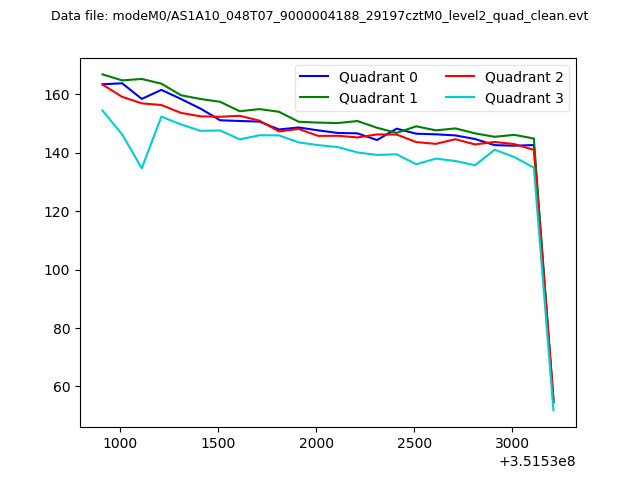 |
|
| Module-wise count rates for Quadrant A Data is divided into 100 sec bins |
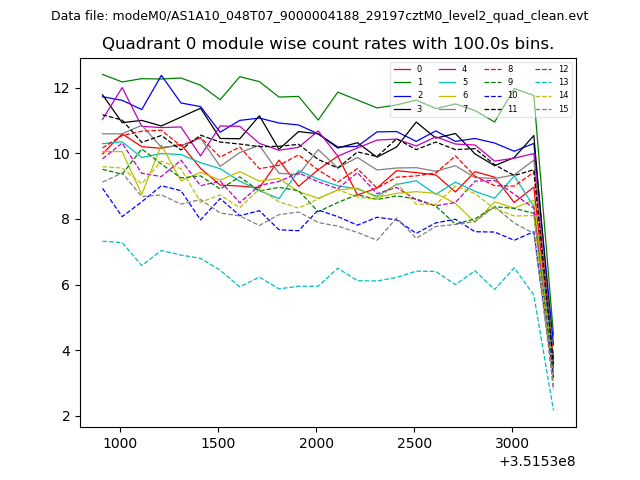 |
 |
| Module-wise count rates for Quadrant B Data is divided into 100 sec bins |
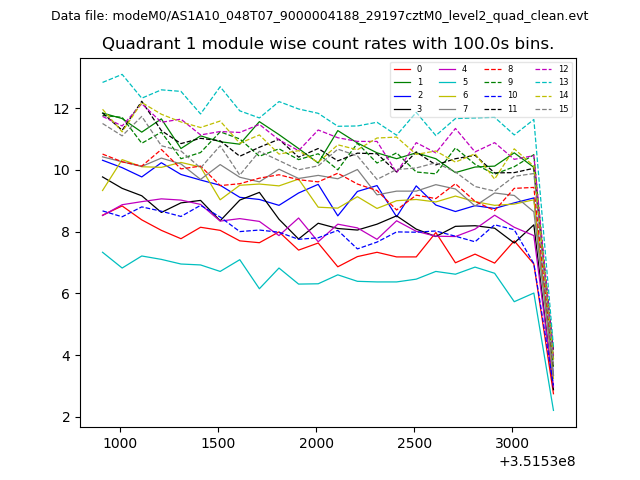 |
 |
| Module-wise count rates for Quadrant C Data is divided into 100 sec bins |
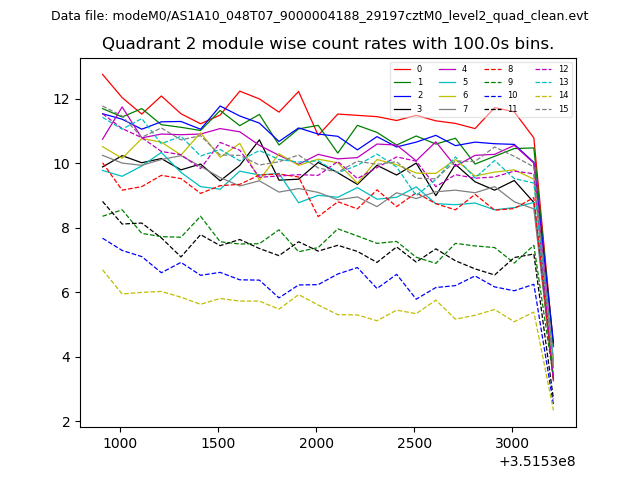 |
 |
| Module-wise count rates for Quadrant D Data is divided into 100 sec bins |
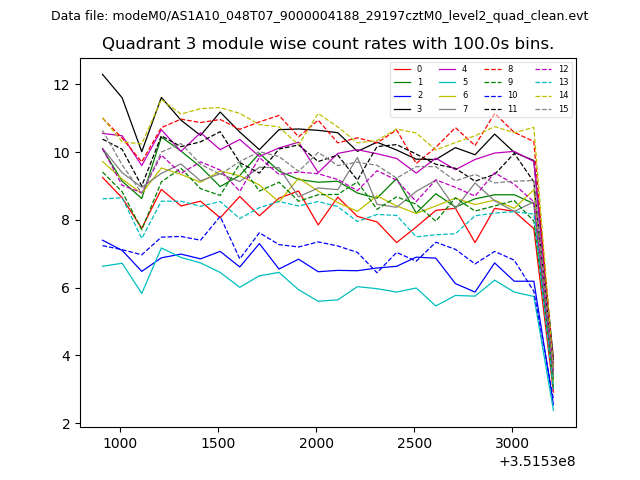 |
 |
| Parameter | Plot |
|---|---|
| CZT HV Monitor | 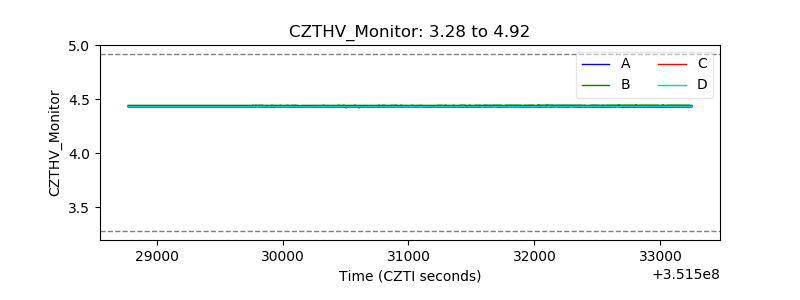 |
| D_VDD |  |
| Temperature 1 | 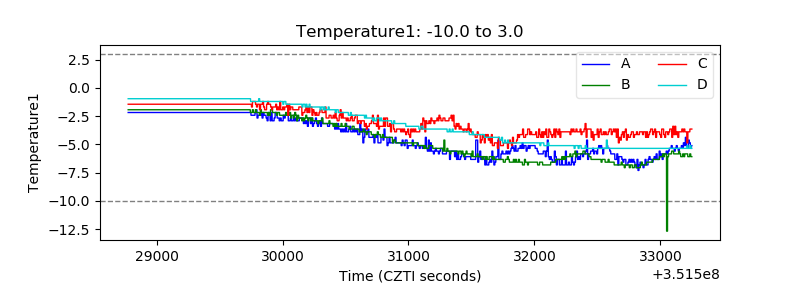 |
| Veto HV Monitor | 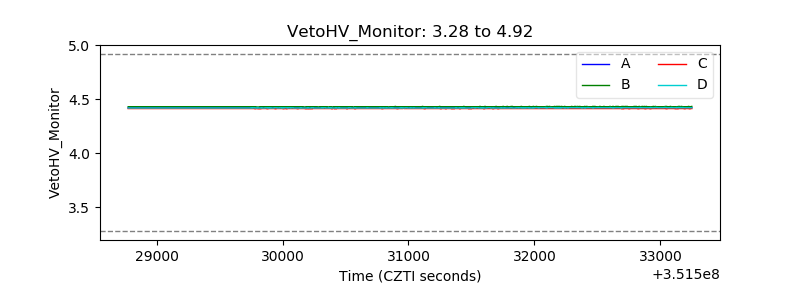 |
| Veto LLD | 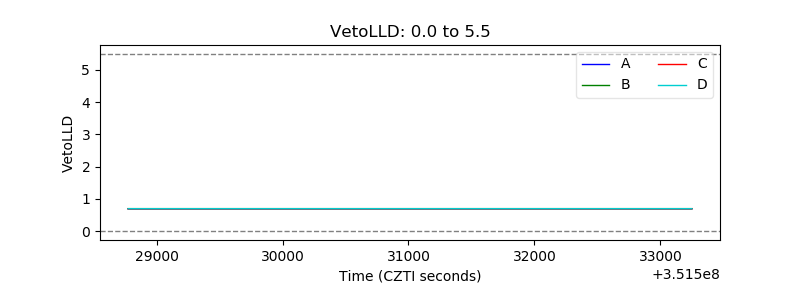 |
| Alpha Counter | 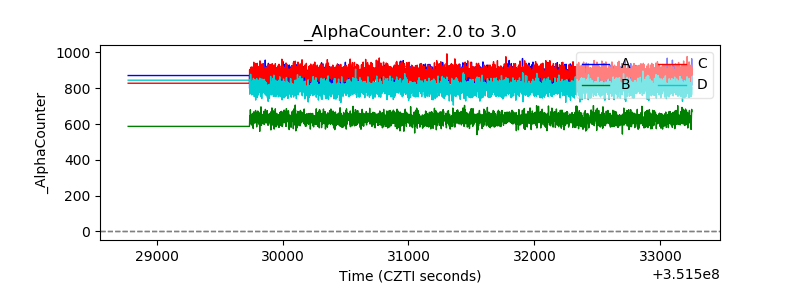 |
| _CPM_Rate | 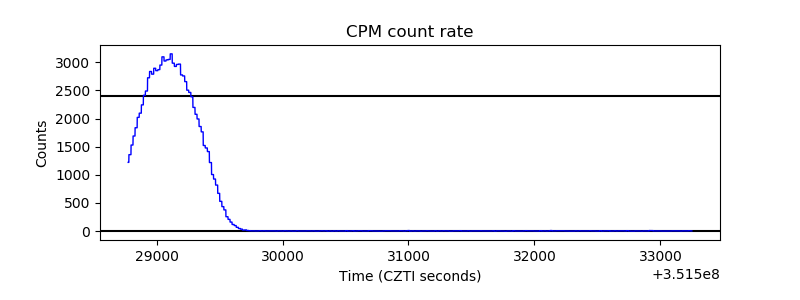 |
| CZT Counter | 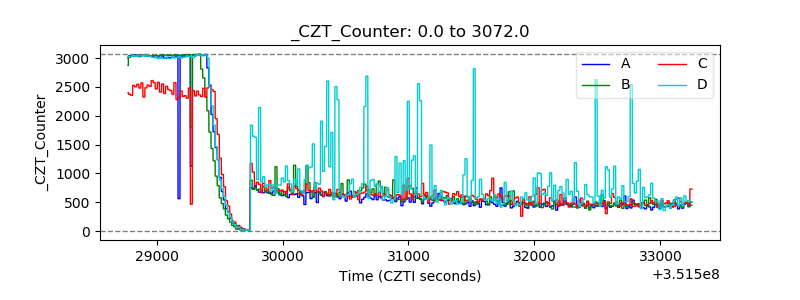 |
| +2.5 Volts monitor |  |
| +5 Volts monitor |  |
| _ROLL_ROT | 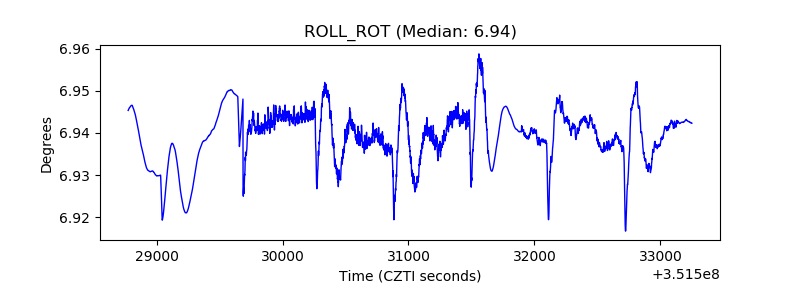 |
| _Roll_DEC | 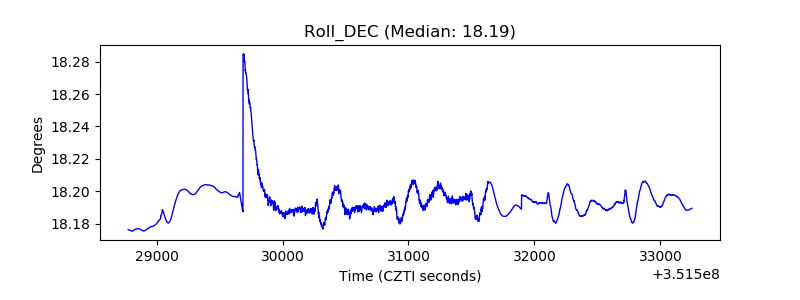 |
| _Roll_RA | 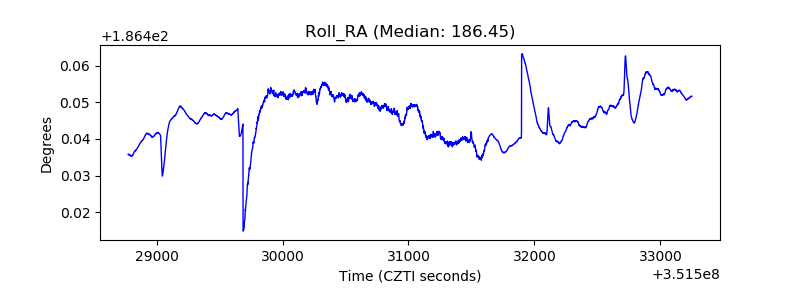 |
| Veto Counter | 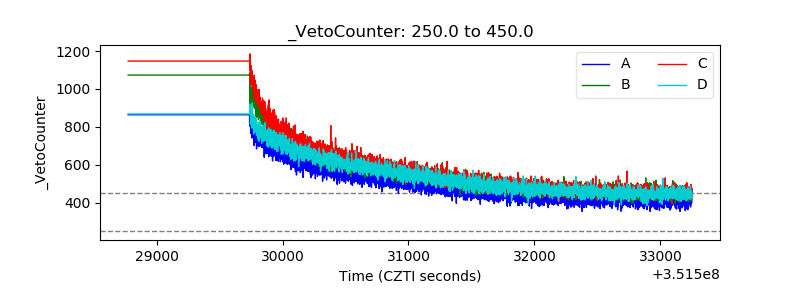 |