| Param | Original file | Final file |
|---|---|---|
| Filename | modeM0/AS1A10_053T19_9000004190cztM0_level2.fits | modeM0/AS1A10_053T19_9000004190cztM0_level2_quad_clean.evt |
| Size (bytes) | 68,207,040 | 28,370,880 |
| Size | 65.0 MB | 27.1 MB |
| Events in quadrant A | 431,096 | 105,459 |
| Events in quadrant B | 409,472 | 105,112 |
| Events in quadrant C | 413,150 | 100,960 |
| Events in quadrant D | 356,114 | 90,336 |
| Mode SS | |||
|---|---|---|---|
| Quadrant | BADHDUFLAG | Total packets | Discarded packets |
| A | 0 | 134 | 0 |
| B | 0 | 134 | 0 |
| C | 0 | 134 | 0 |
| D | 0 | 134 | 0 |
| Mode M0 | |||
|---|---|---|---|
| Quadrant | BADHDUFLAG | Total packets | Discarded packets |
| A | 0 | 13753 | 0 |
| B | 0 | 15976 | 0 |
| C | 0 | 19468 | 0 |
| D | 0 | 21538 | 0 |
| Mode M9 | |||
|---|---|---|---|
| Quadrant | BADHDUFLAG | Total packets | Discarded packets |
| A | 0 | 22 | 0 |
| B | 0 | 22 | 0 |
| C | 0 | 22 | 0 |
| D | 0 | 22 | 0 |
| Quadrant | Total seconds | Saturated seconds | Saturation percentage |
|---|---|---|---|
| A | 6532 | 42 | 0.642988% |
| B | 6532 | 148 | 2.265769% |
| C | 6532 | 212 | 3.245560% |
| D | 6532 | 399 | 6.108389% |
Noise dominated data is calculated using 1-second bins in cleaned event files. If a bin has >2000 counts, and if more than 50% of those come from <1% of pixels, then it is considered to be noise-dominated and hence unusable.
| Quadrant | # 1 sec bins | Bins with >0 counts | Bins with >2000 counts | High rate bins dominated by noise | Noise dominated (total time) | Noise dominated (detector-on time) | Marked lightcurve |
|---|---|---|---|---|---|---|---|
| A | 7616 | 6531 | 0 | 0 | 0.00% | 0.00% |  |
| B | 7616 | 6531 | 0 | 0 | 0.00% | 0.00% |  |
| C | 7616 | 6531 | 0 | 0 | 0.00% | 0.00% |  |
| D | 7616 | 6531 | 0 | 0 | 0.00% | 0.00% |  |
Top three noisy pixels from each quadrant. If the there are fewer than three noisy pixels in the level2.evt file, extra rows are filled as -1
| Pixel properties | Quadrant properties | ||||||
|---|---|---|---|---|---|---|---|
| Quadrant | DetID | PixID | Counts | Sigma | Mean | Median | Sigma |
| A | 0 | 29 | 393 | 9.97 | 112 | 106 | 28.8 |
| A | 7 | 110 | 326 | 7.64 | 112 | 106 | 28.8 |
| A | 9 | 19 | 310 | 7.08 | 112 | 106 | 28.8 |
| B | 2 | 9 | 318 | 9.12 | 108 | 104 | 23.5 |
| B | 5 | 128 | 292 | 8.01 | 108 | 104 | 23.5 |
| B | 2 | 8 | 286 | 7.76 | 108 | 104 | 23.5 |
| C | 1 | 80 | 317 | 7.23 | 109 | 103 | 29.6 |
| C | 1 | 81 | 310 | 7.0 | 109 | 103 | 29.6 |
| C | 3 | 187 | 305 | 6.83 | 109 | 103 | 29.6 |
| D | 15 | 46 | 273 | 6.3 | 101 | 92 | 28.7 |
| D | 6 | 231 | 271 | 6.23 | 101 | 92 | 28.7 |
| D | 3 | 14 | 259 | 5.81 | 101 | 92 | 28.7 |
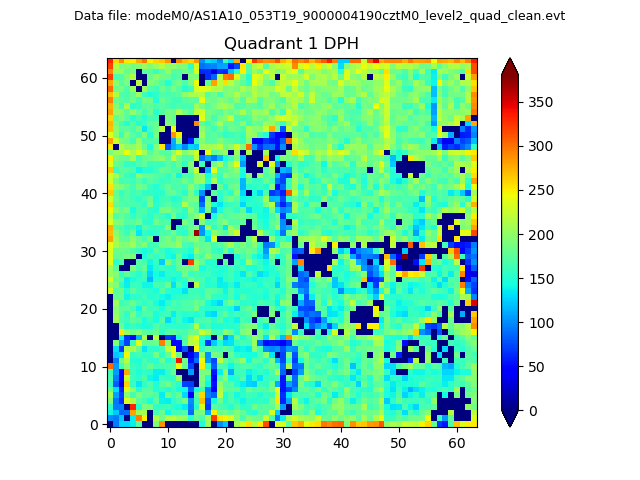
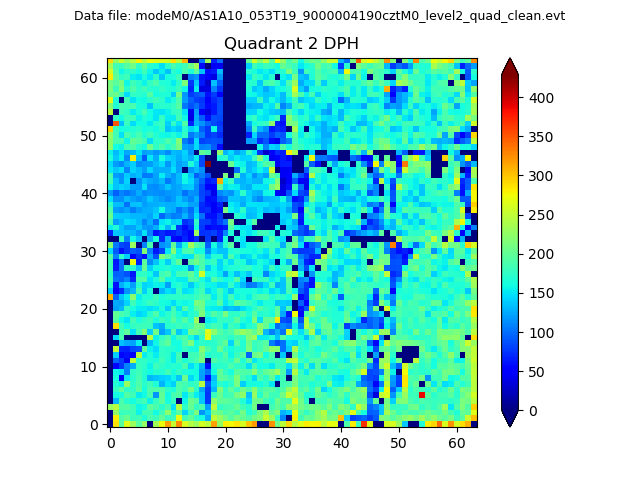
Histogram calculated using DETX and DETY for each event in the final _common_clean file
| Quadrant A |  |
 |
Quadrant B |
|---|---|---|---|
| Quadrant D | 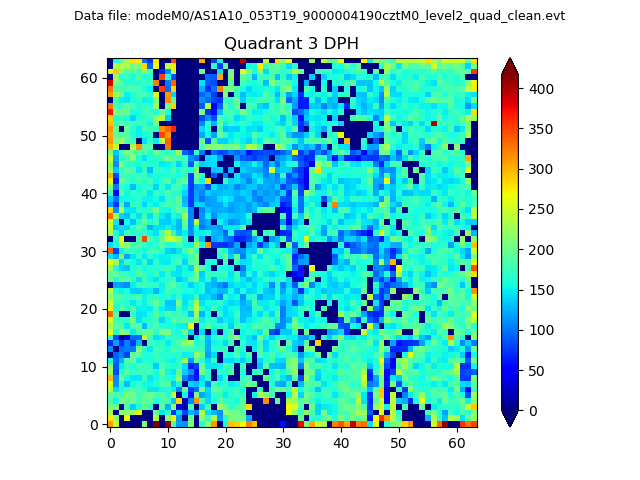 |
 |
Quadrant C |
| Plot type | Count rate plots | Images |
|---|---|---|
| Comparison with Poisson distribution Blue bars denote a histogram of data divided into 1 sec bins. Red curve is a Poisson curve with rate = median count rate of data. |
 |
 |
| Quadrant-wise count rates Data is divided into 100 sec bins |
 |
|
| Module-wise count rates for Quadrant A Data is divided into 100 sec bins |
 |
 |
| Module-wise count rates for Quadrant B Data is divided into 100 sec bins |
 |
 |
| Module-wise count rates for Quadrant C Data is divided into 100 sec bins |
 |
 |
| Module-wise count rates for Quadrant D Data is divided into 100 sec bins |
 |
 |
| Parameter | Plot |
|---|---|
| CZT HV Monitor |  |
| D_VDD |  |
| Temperature 1 |  |
| Veto HV Monitor |  |
| Veto LLD |  |
| Alpha Counter | 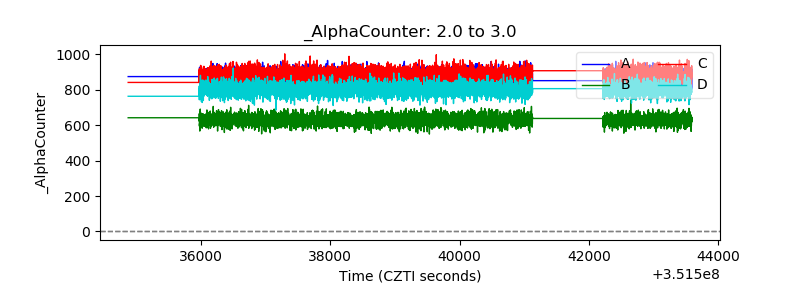 |
| _CPM_Rate |  |
| CZT Counter |  |
| +2.5 Volts monitor |  |
| +5 Volts monitor |  |
| _ROLL_ROT |  |
| _Roll_DEC |  |
| _Roll_RA |  |
| Veto Counter |  |