| Param | Original file | Final file |
|---|---|---|
| Filename | modeM0/AS1A10_053T19_9000004190_29197cztM0_level2.evt | modeM0/AS1A10_053T19_9000004190_29197cztM0_level2_quad_clean.evt |
| Size (bytes) | 142,583,040 | 30,680,640 |
| Size | 136.0 MB | 29.3 MB |
| Events in quadrant A | 717,366 | 213,258 |
| Events in quadrant B | 1,101,012 | 212,198 |
| Events in quadrant C | 1,060,208 | 205,466 |
| Events in quadrant D | 1,344,120 | 195,419 |
| Mode SS | |||
|---|---|---|---|
| Quadrant | BADHDUFLAG | Total packets | Discarded packets |
| A | 0 | 28 | 0 |
| B | 0 | 28 | 0 |
| C | 0 | 28 | 0 |
| D | 0 | 28 | 0 |
| Mode M0 | |||
|---|---|---|---|
| Quadrant | BADHDUFLAG | Total packets | Discarded packets |
| A | 0 | 2926 | 1 |
| B | 0 | 4228 | 1 |
| C | 0 | 4191 | 1 |
| D | 0 | 4971 | 1 |
| Mode M9 | |||
|---|---|---|---|
| Quadrant | BADHDUFLAG | Total packets | Discarded packets |
| A | 0 | 11 | 0 |
| B | 0 | 11 | 0 |
| C | 0 | 11 | 0 |
| D | 0 | 11 | 0 |
| Quadrant | Total seconds | Saturated seconds | Saturation percentage |
|---|---|---|---|
| A | 1369 | 3 | 0.219138% |
| B | 1369 | 71 | 5.186267% |
| C | 1369 | 44 | 3.214025% |
| D | 1369 | 76 | 5.551497% |
Noise dominated data is calculated using 1-second bins in cleaned event files. If a bin has >2000 counts, and if more than 50% of those come from <1% of pixels, then it is considered to be noise-dominated and hence unusable.
| Quadrant | # 1 sec bins | Bins with >0 counts | Bins with >2000 counts | High rate bins dominated by noise | Noise dominated (total time) | Noise dominated (detector-on time) | Marked lightcurve |
|---|---|---|---|---|---|---|---|
| A | 1368 | 1368 | 0 | 0 | 0.00% | 0.00% | 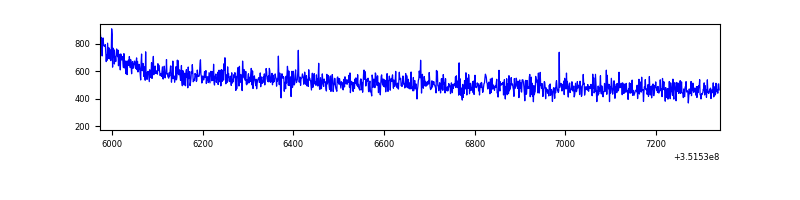 |
| B | 1368 | 1368 | 50 | 50 | 3.65% | 3.65% | 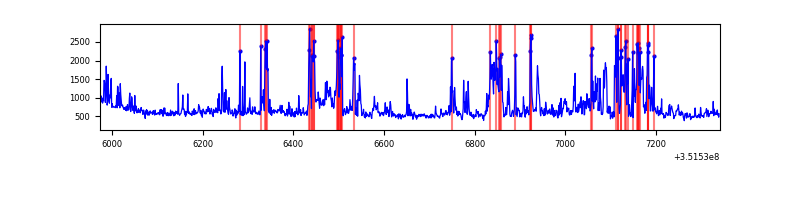 |
| C | 1368 | 1368 | 6 | 6 | 0.44% | 0.44% | 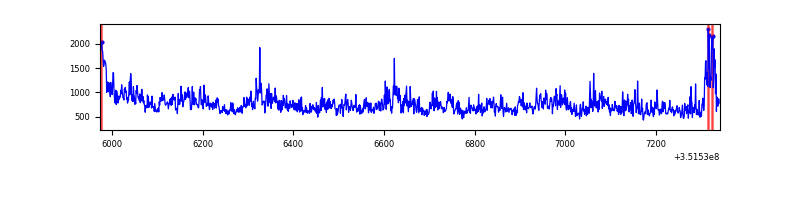 |
| D | 1368 | 1368 | 72 | 72 | 5.26% | 5.26% | 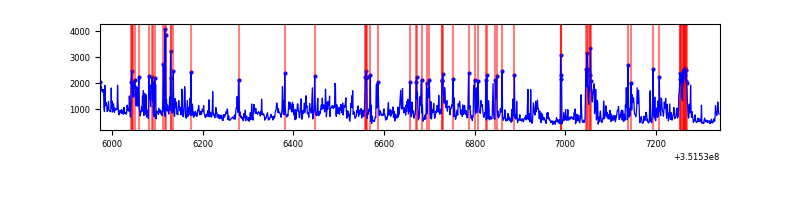 |
Top three noisy pixels from each quadrant. If the there are fewer than three noisy pixels in the level2.evt file, extra rows are filled as -1
| Pixel properties | Quadrant properties | ||||||
|---|---|---|---|---|---|---|---|
| Quadrant | DetID | PixID | Counts | Sigma | Mean | Median | Sigma |
| A | 13 | 254 | 2971 | 72.13 | 185 | 182 | 38.7 |
| A | 0 | 226 | 1636 | 37.61 | 185 | 182 | 38.7 |
| A | 3 | 137 | 1616 | 37.09 | 185 | 182 | 38.7 |
| B | 5 | 255 | 231354 | 6418.75 | 182 | 178 | 36.0 |
| B | 0 | 183 | 62530 | 1731.24 | 182 | 178 | 36.0 |
| B | 0 | 229 | 57772 | 1599.13 | 182 | 178 | 36.0 |
| C | 3 | 233 | 350309 | 8298.67 | 173 | 174 | 42.2 |
| C | 14 | 238 | 28316 | 667.0 | 173 | 174 | 42.2 |
| C | 2 | 114 | 3616 | 81.58 | 173 | 174 | 42.2 |
| D | 1 | 52 | 475583 | 11183.11 | 172 | 167 | 42.5 |
| D | 8 | 195 | 123921 | 2911.04 | 172 | 167 | 42.5 |
| D | 7 | 69 | 19964 | 465.68 | 172 | 167 | 42.5 |
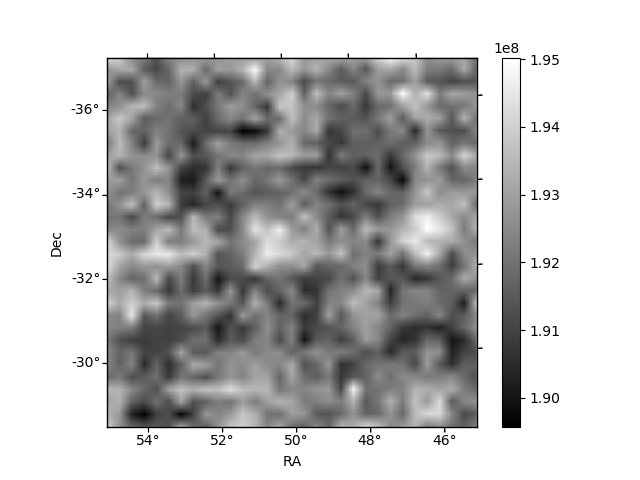
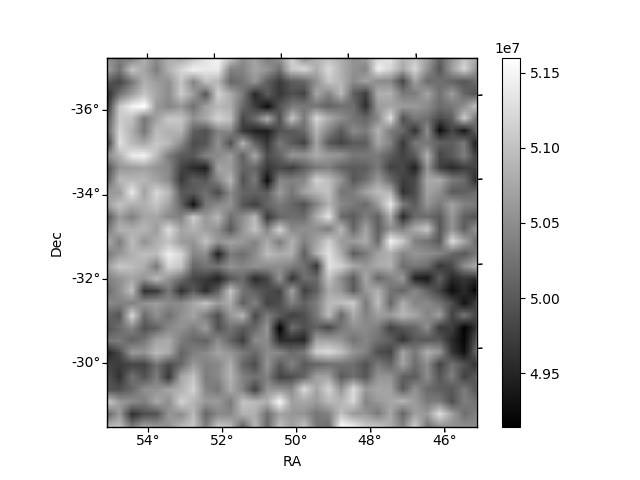
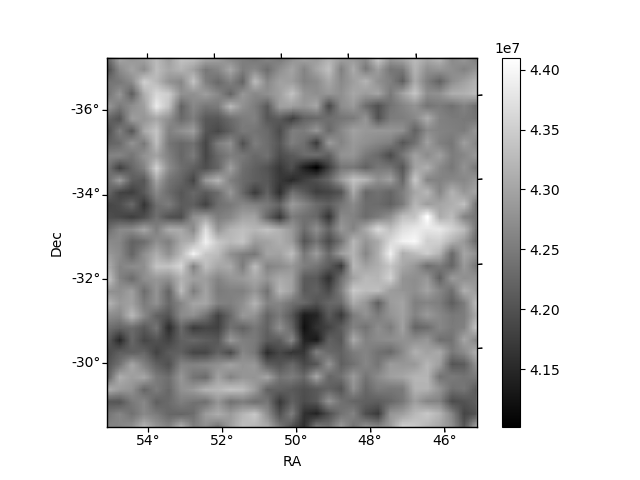
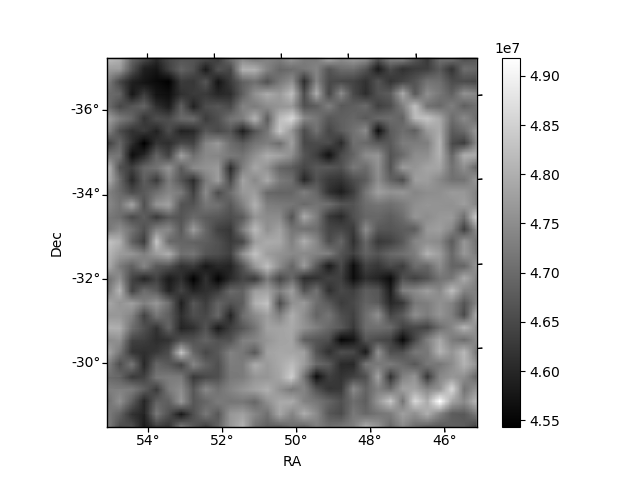
Histogram calculated using DETX and DETY for each event in the final _common_clean file
| Quadrant A | 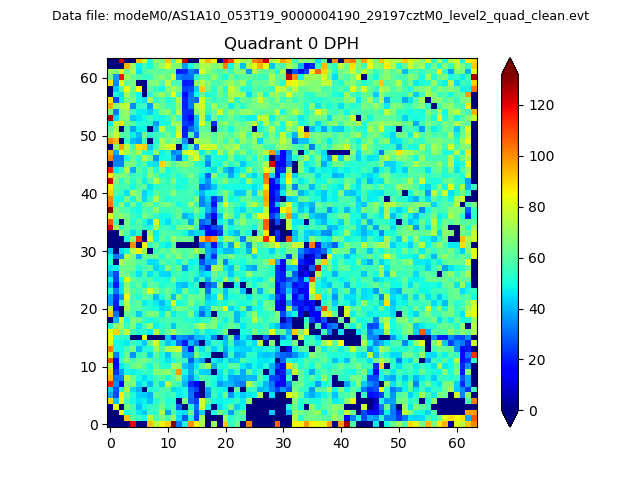 |
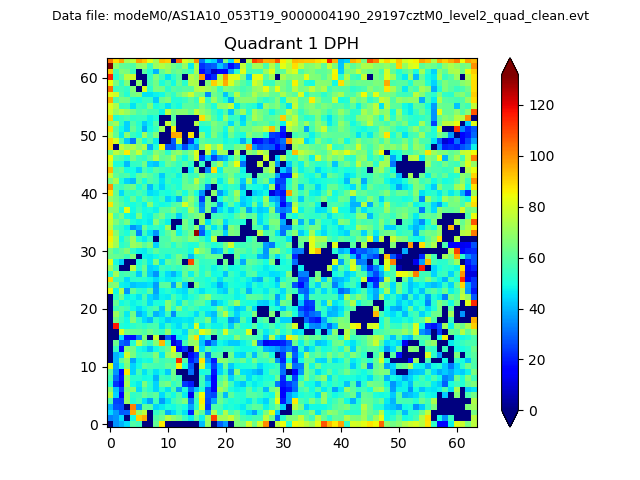 |
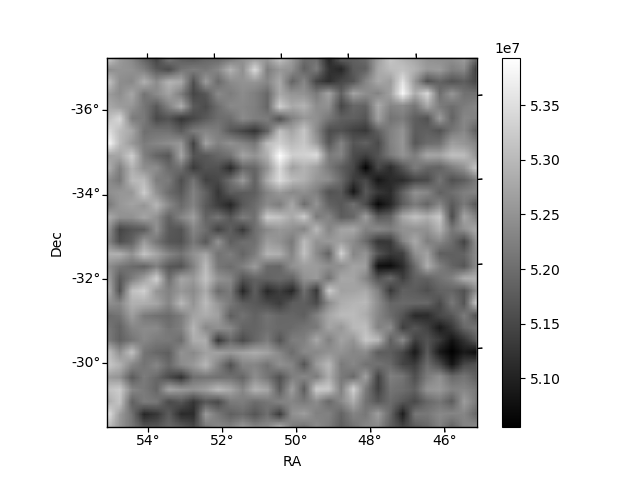
Quadrant B |
|---|---|---|---|
| Quadrant D | 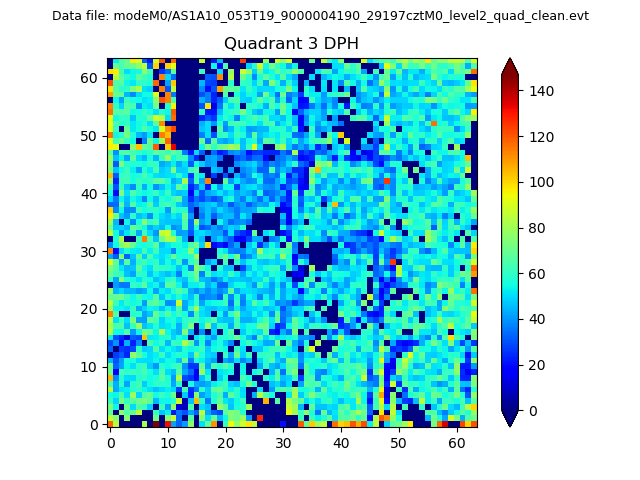 |
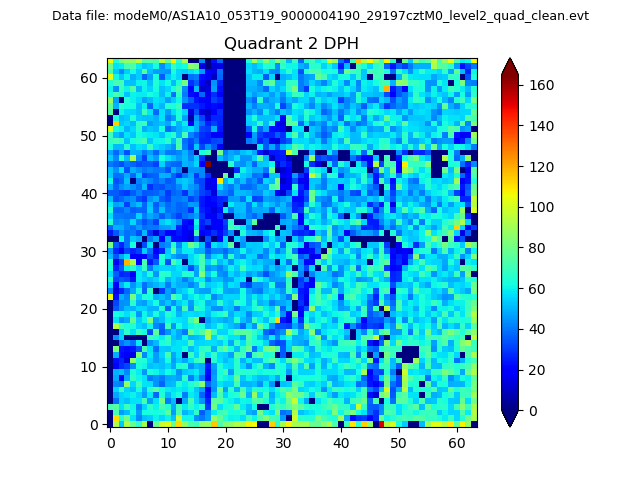 |
Quadrant C |
| Plot type | Count rate plots | Images |
|---|---|---|
| Comparison with Poisson distribution Blue bars denote a histogram of data divided into 1 sec bins. Red curve is a Poisson curve with rate = median count rate of data. |
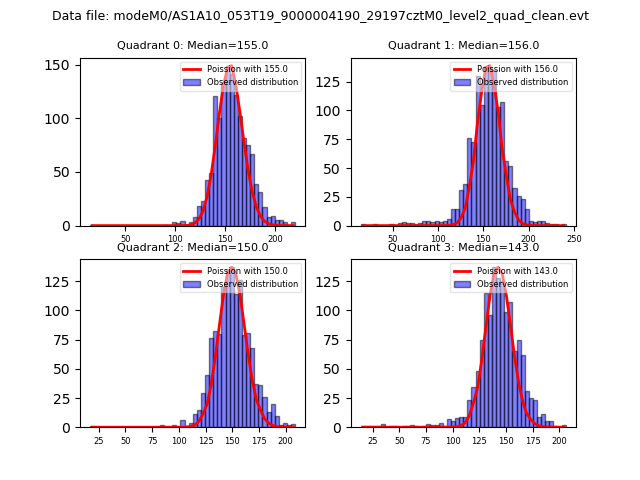 |
 |
| Quadrant-wise count rates Data is divided into 100 sec bins |
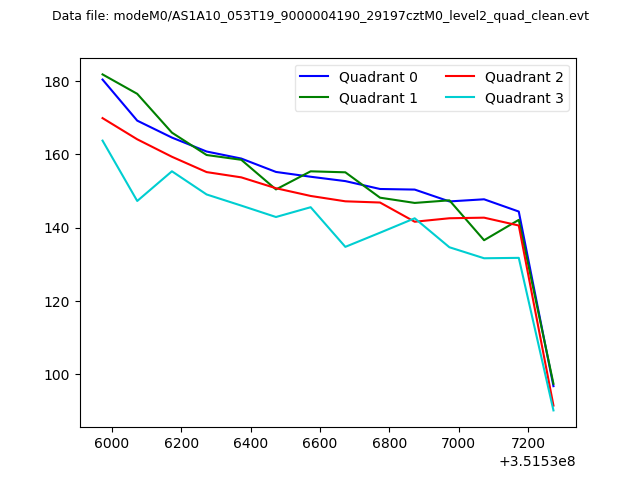 |
|
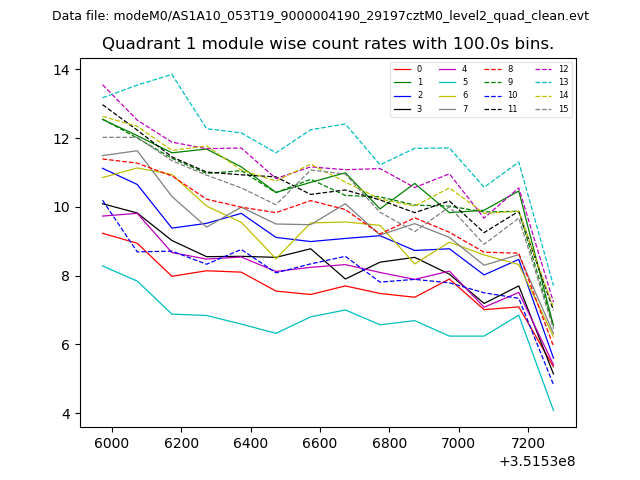
| Module-wise count rates for Quadrant A Data is divided into 100 sec bins |
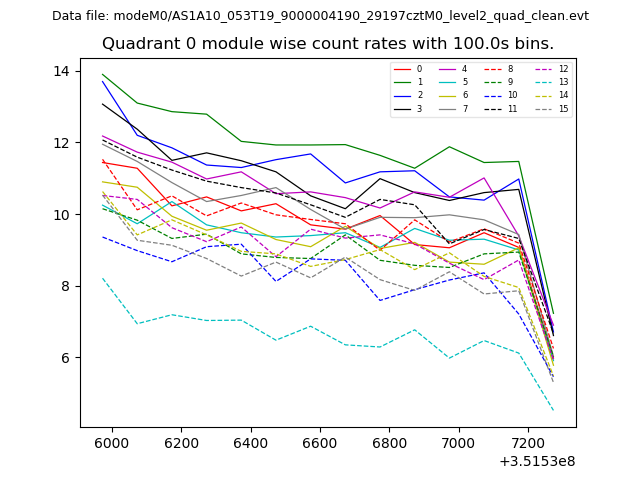 |
 |
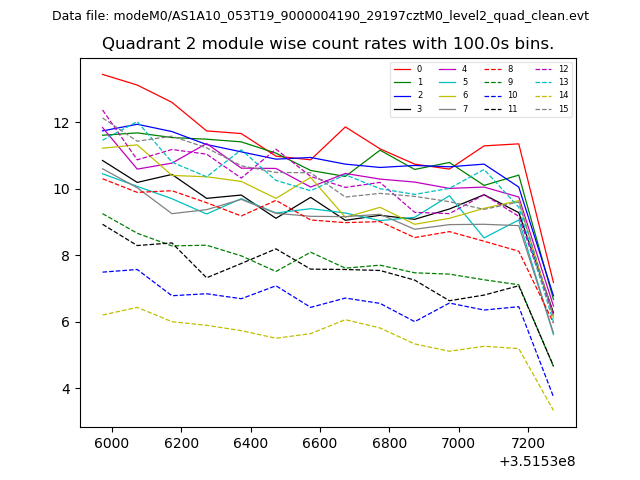
| Module-wise count rates for Quadrant B Data is divided into 100 sec bins |
 |
 |
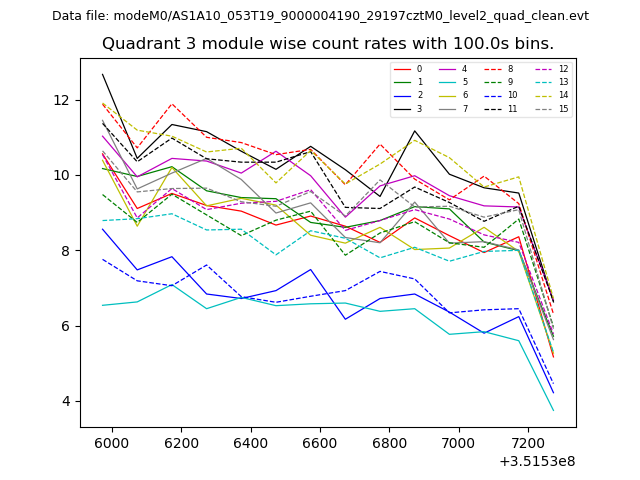
| Module-wise count rates for Quadrant C Data is divided into 100 sec bins |
 |
 |
| Module-wise count rates for Quadrant D Data is divided into 100 sec bins |
 |
 |
| Parameter | Plot |
|---|---|
| CZT HV Monitor | 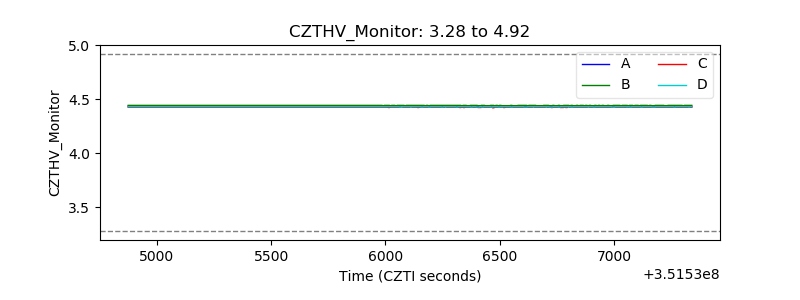 |
| D_VDD | 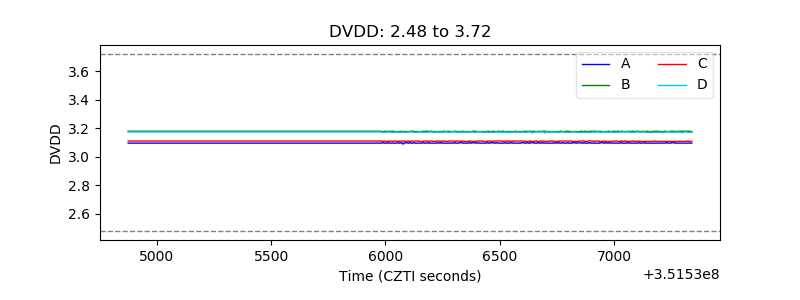 |
| Temperature 1 | 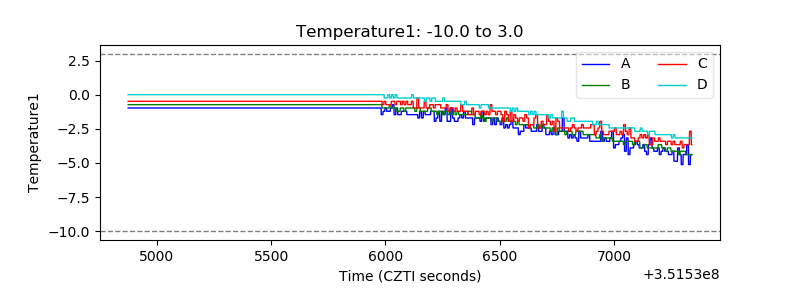 |
| Veto HV Monitor | 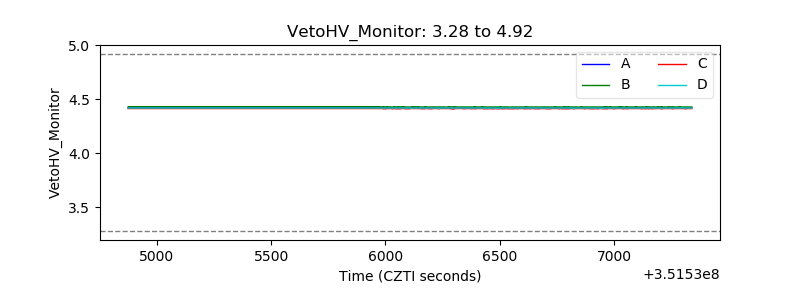 |
| Veto LLD | 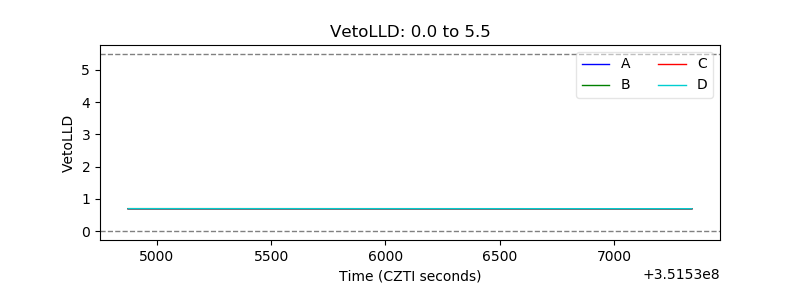 |
| Alpha Counter | 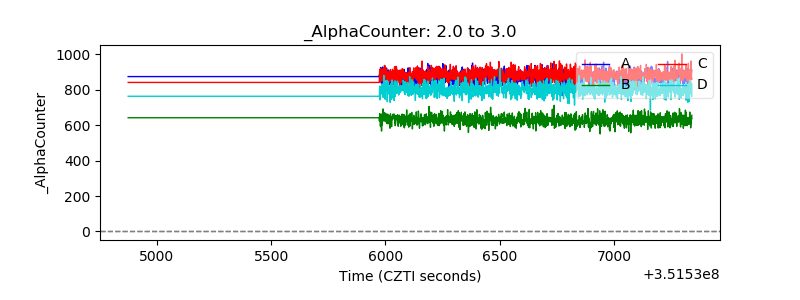 |
| _CPM_Rate | 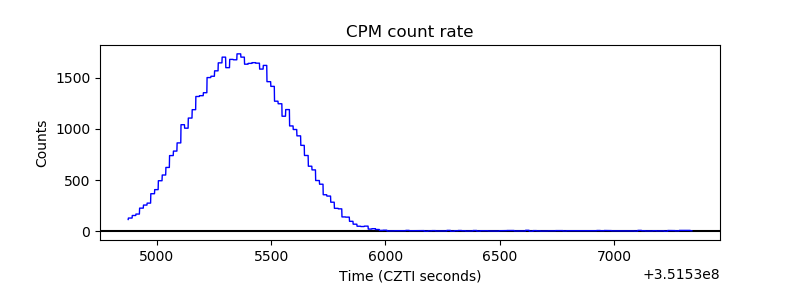 |
| CZT Counter | 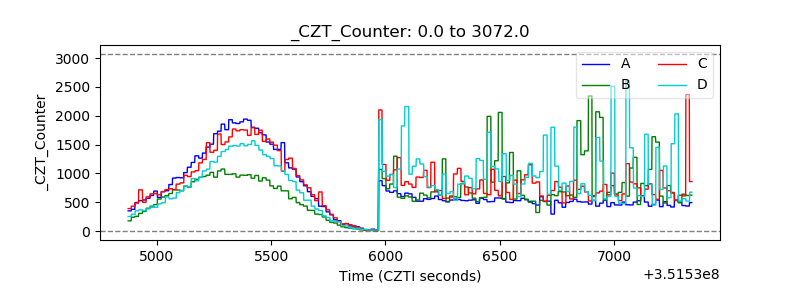 |
| +2.5 Volts monitor |  |
| +5 Volts monitor |  |
| _ROLL_ROT | 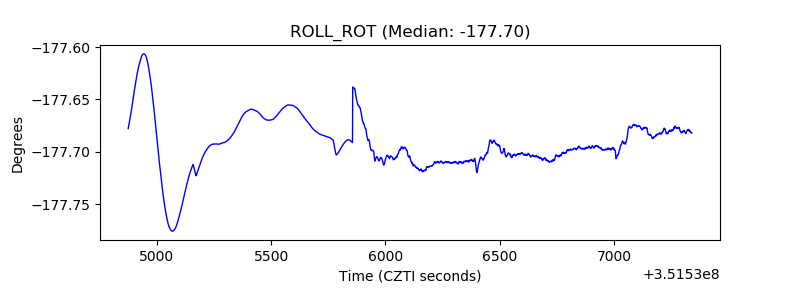 |
| _Roll_DEC | 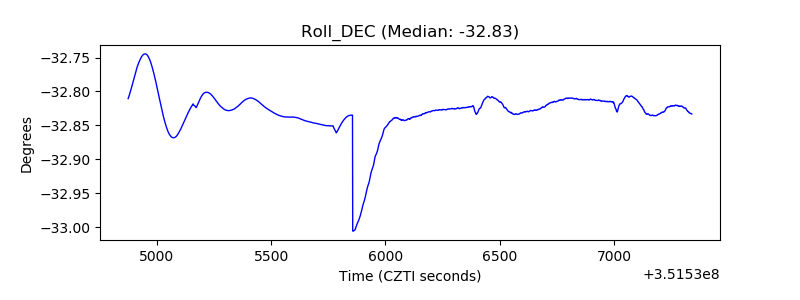 |
| _Roll_RA | 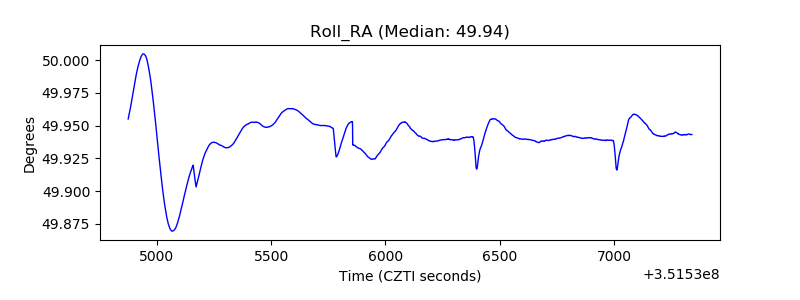 |
| Veto Counter | 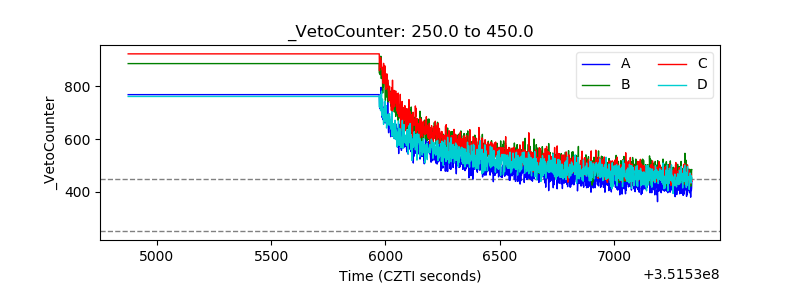 |