| Param | Original file | Final file |
|---|---|---|
| Filename | modeM0/AS1A10_053T19_9000004190_29198cztM0_level2.evt | modeM0/AS1A10_053T19_9000004190_29198cztM0_level2_quad_clean.evt |
| Size (bytes) | 589,438,080 | 94,633,920 |
| Size | 562.1 MB | 90.2 MB |
| Events in quadrant A | 3,146,204 | 623,525 |
| Events in quadrant B | 3,856,156 | 625,928 |
| Events in quadrant C | 4,836,502 | 601,884 |
| Events in quadrant D | 5,579,454 | 567,983 |
| Mode SS | |||
|---|---|---|---|
| Quadrant | BADHDUFLAG | Total packets | Discarded packets |
| A | 0 | 130 | 0 |
| B | 0 | 130 | 0 |
| C | 0 | 130 | 0 |
| D | 0 | 130 | 0 |
| Mode M0 | |||
|---|---|---|---|
| Quadrant | BADHDUFLAG | Total packets | Discarded packets |
| A | 0 | 13376 | 1 |
| B | 0 | 15558 | 1 |
| C | 0 | 18982 | 1 |
| D | 0 | 20964 | 1 |
| Mode M9 | |||
|---|---|---|---|
| Quadrant | BADHDUFLAG | Total packets | Discarded packets |
| A | 0 | 11 | 0 |
| B | 0 | 11 | 0 |
| C | 0 | 11 | 0 |
| D | 0 | 11 | 0 |
| Quadrant | Total seconds | Saturated seconds | Saturation percentage |
|---|---|---|---|
| A | 6398 | 40 | 0.625195% |
| B | 6398 | 137 | 2.141294% |
| C | 6398 | 187 | 2.922788% |
| D | 6399 | 372 | 5.813408% |
Noise dominated data is calculated using 1-second bins in cleaned event files. If a bin has >2000 counts, and if more than 50% of those come from <1% of pixels, then it is considered to be noise-dominated and hence unusable.
| Quadrant | # 1 sec bins | Bins with >0 counts | Bins with >2000 counts | High rate bins dominated by noise | Noise dominated (total time) | Noise dominated (detector-on time) | Marked lightcurve |
|---|---|---|---|---|---|---|---|
| A | 7483 | 6399 | 0 | 0 | 0.00% | 0.00% | 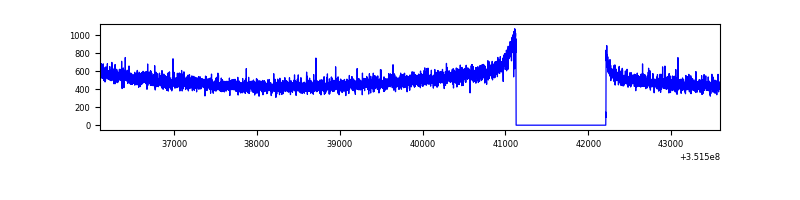 |
| B | 7483 | 6399 | 57 | 57 | 0.76% | 0.89% | 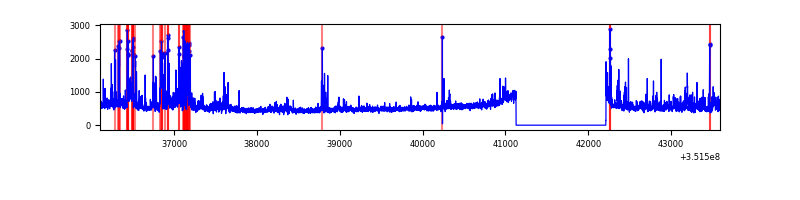 |
| C | 7483 | 6399 | 13 | 13 | 0.17% | 0.20% | 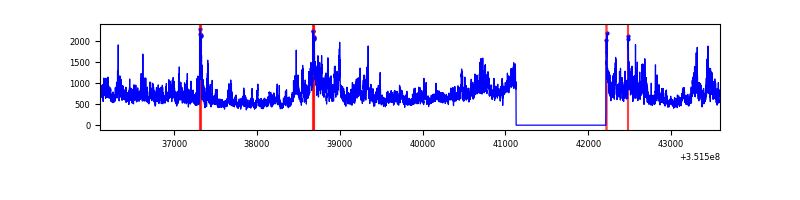 |
| D | 7484 | 6400 | 371 | 371 | 4.96% | 5.80% | 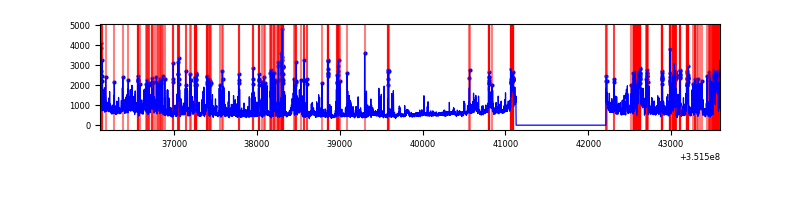 |
Top three noisy pixels from each quadrant. If the there are fewer than three noisy pixels in the level2.evt file, extra rows are filled as -1
| Pixel properties | Quadrant properties | ||||||
|---|---|---|---|---|---|---|---|
| Quadrant | DetID | PixID | Counts | Sigma | Mean | Median | Sigma |
| A | 13 | 254 | 12964 | 74.72 | 815 | 801 | 162.8 |
| A | 3 | 137 | 7703 | 42.4 | 815 | 801 | 162.8 |
| A | 0 | 226 | 6940 | 37.71 | 815 | 801 | 162.8 |
| B | 5 | 255 | 254488 | 1659.58 | 807 | 787 | 152.9 |
| B | 0 | 183 | 245863 | 1603.16 | 807 | 787 | 152.9 |
| B | 0 | 229 | 98062 | 636.32 | 807 | 787 | 152.9 |
| C | 3 | 233 | 1663263 | 9130.12 | 778 | 786 | 182.1 |
| C | 14 | 238 | 125856 | 686.87 | 778 | 786 | 182.1 |
| C | 2 | 114 | 15800 | 82.45 | 778 | 786 | 182.1 |
| D | 1 | 52 | 1724382 | 9368.16 | 767 | 748 | 184.0 |
| D | 8 | 195 | 488283 | 2649.81 | 767 | 748 | 184.0 |
| D | 2 | 250 | 190579 | 1031.75 | 767 | 748 | 184.0 |
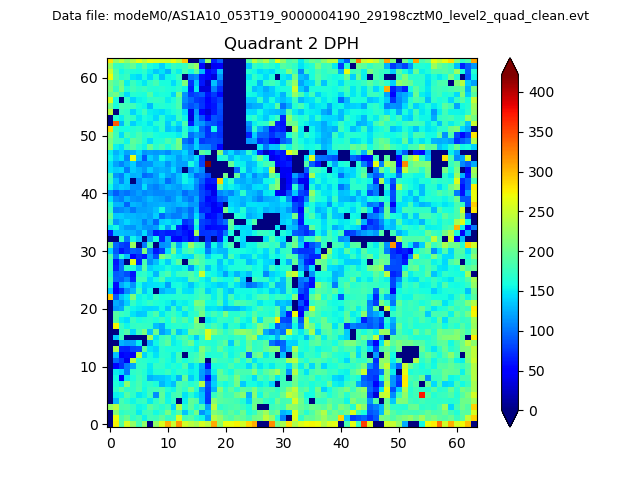
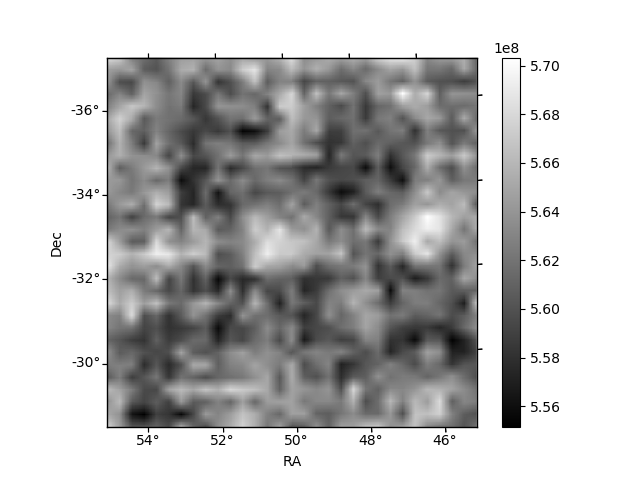
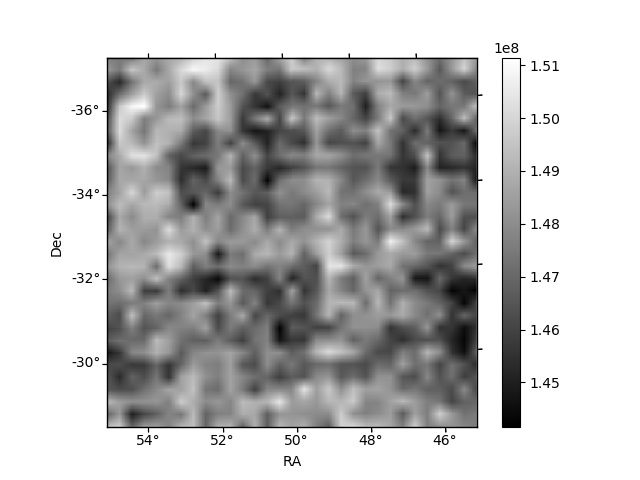
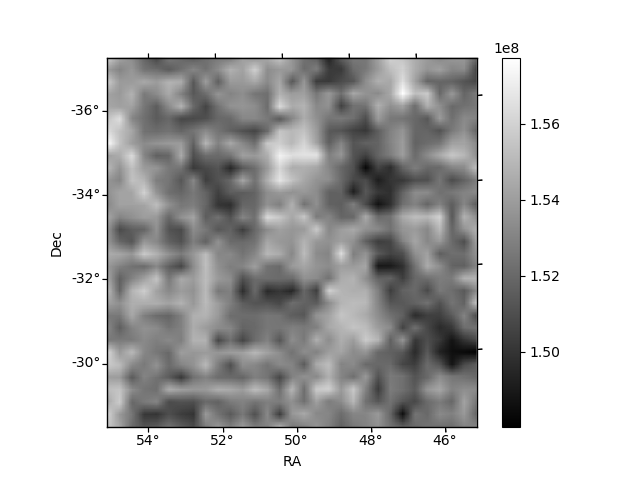
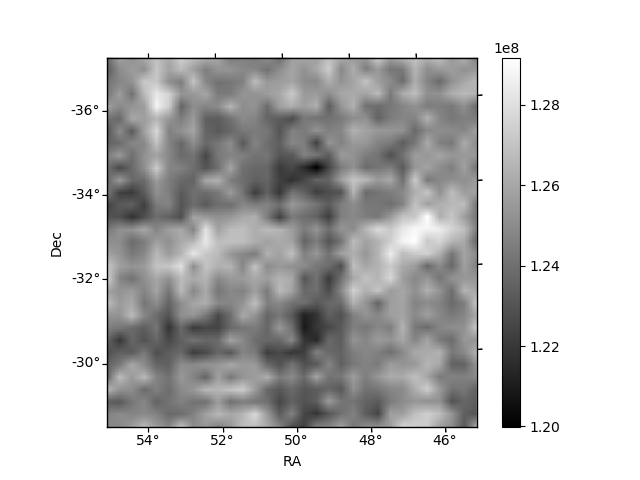
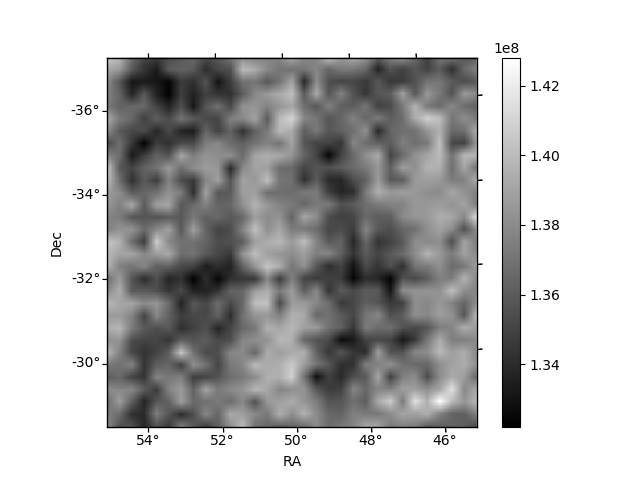
Histogram calculated using DETX and DETY for each event in the final _common_clean file
| Quadrant A | 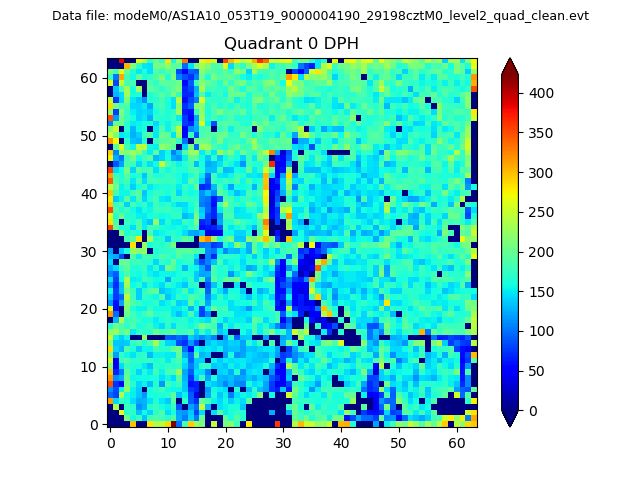 |
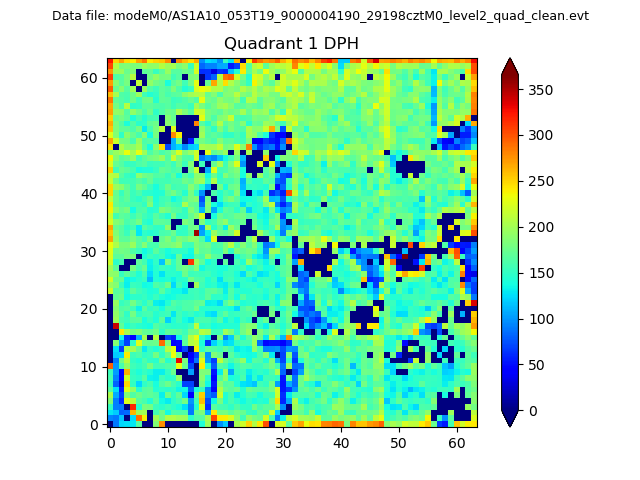 |
Quadrant B |
|---|---|---|---|
| Quadrant D | 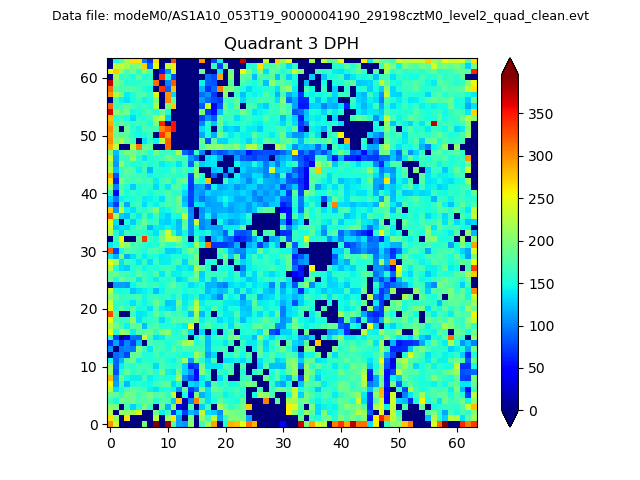 |
 |
Quadrant C |
| Plot type | Count rate plots | Images |
|---|---|---|
| Comparison with Poisson distribution Blue bars denote a histogram of data divided into 1 sec bins. Red curve is a Poisson curve with rate = median count rate of data. |
 |
 |
| Quadrant-wise count rates Data is divided into 100 sec bins |
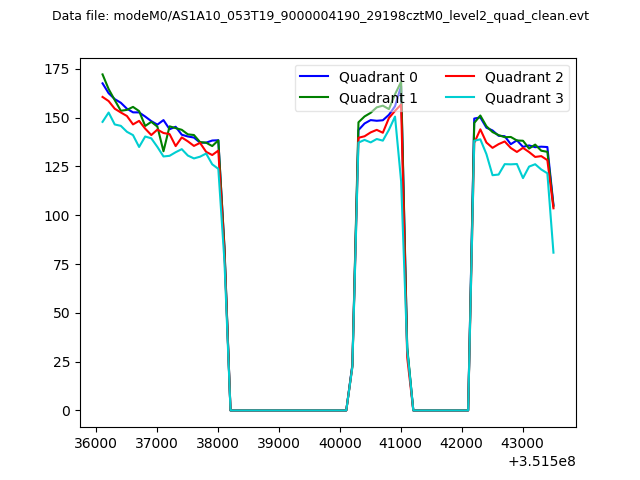 |
|
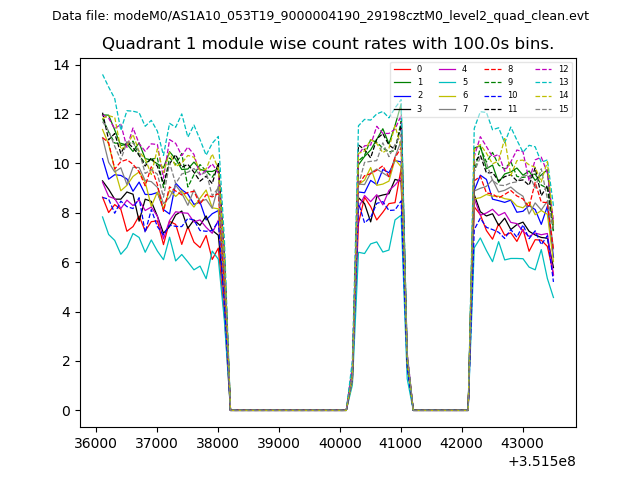
| Module-wise count rates for Quadrant A Data is divided into 100 sec bins |
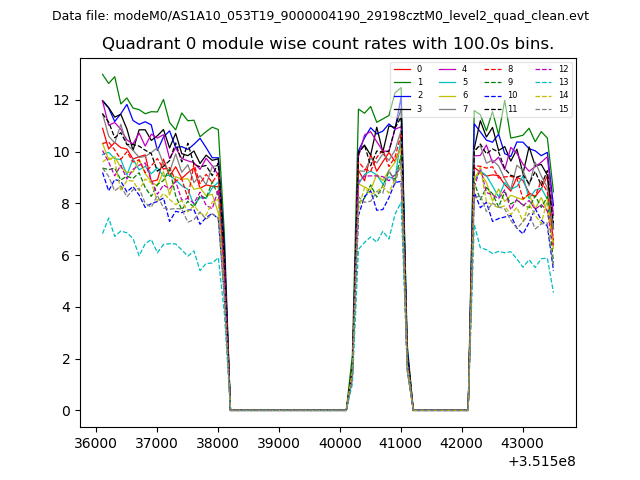 |
 |
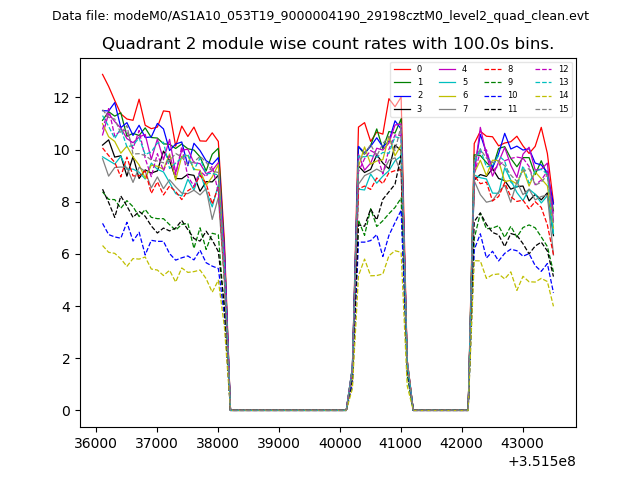
| Module-wise count rates for Quadrant B Data is divided into 100 sec bins |
 |
 |
| Module-wise count rates for Quadrant C Data is divided into 100 sec bins |
 |
 |
| Module-wise count rates for Quadrant D Data is divided into 100 sec bins |
 |
 |
| Parameter | Plot |
|---|---|
| CZT HV Monitor | 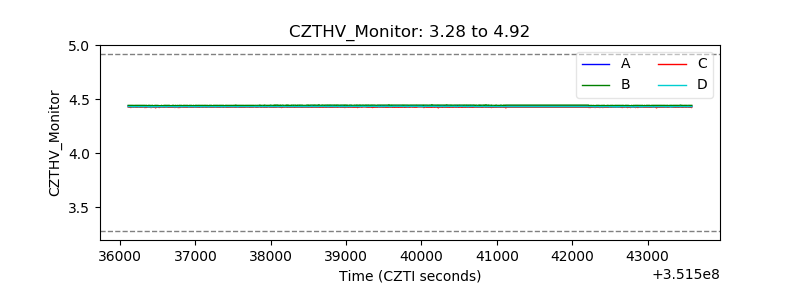 |
| D_VDD | 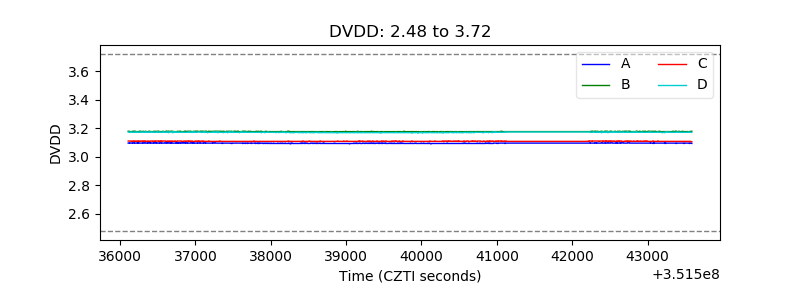 |
| Temperature 1 | 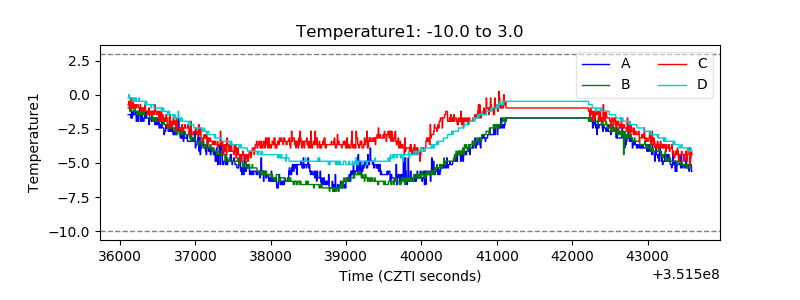 |
| Veto HV Monitor | 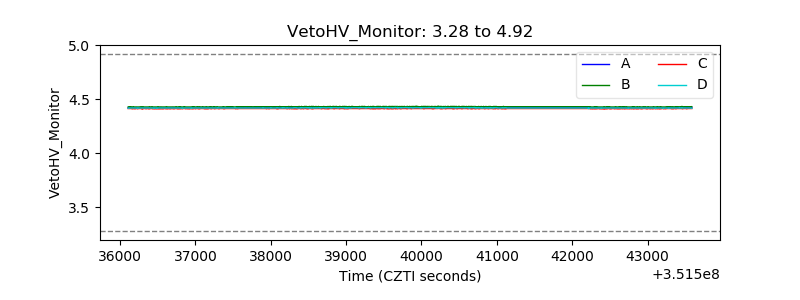 |
| Veto LLD | 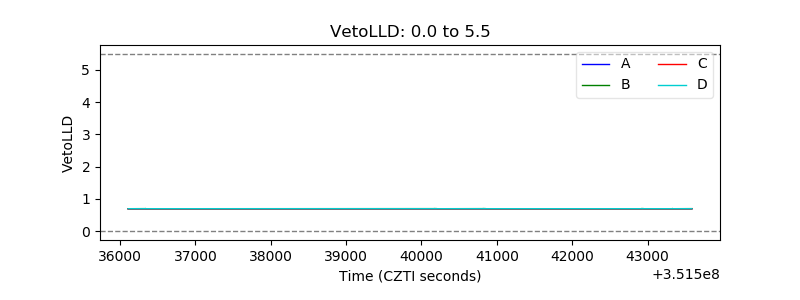 |
| Alpha Counter |  |
| _CPM_Rate | 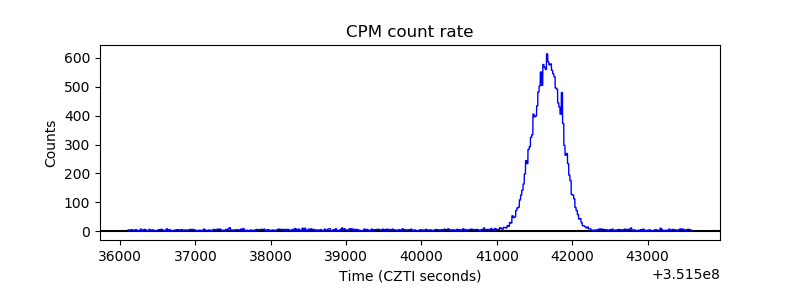 |
| CZT Counter | 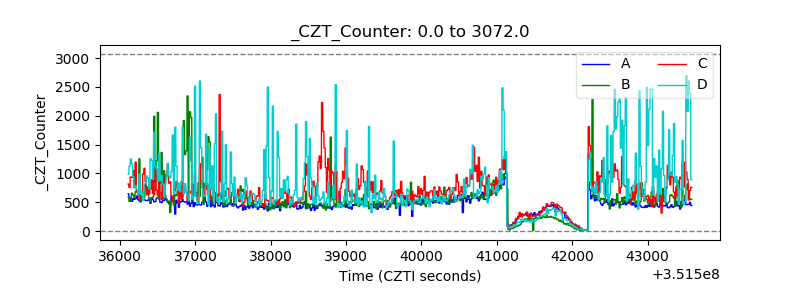 |
| +2.5 Volts monitor |  |
| +5 Volts monitor |  |
| _ROLL_ROT | 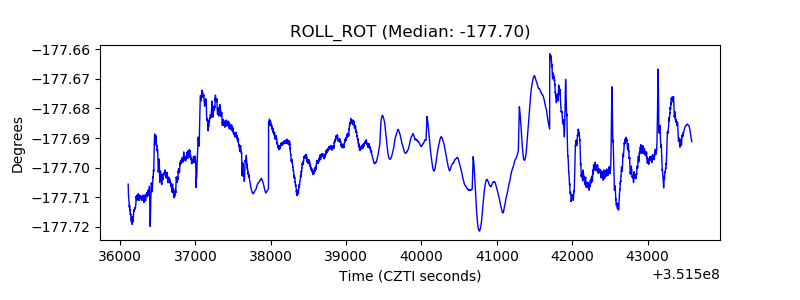 |
| _Roll_DEC | 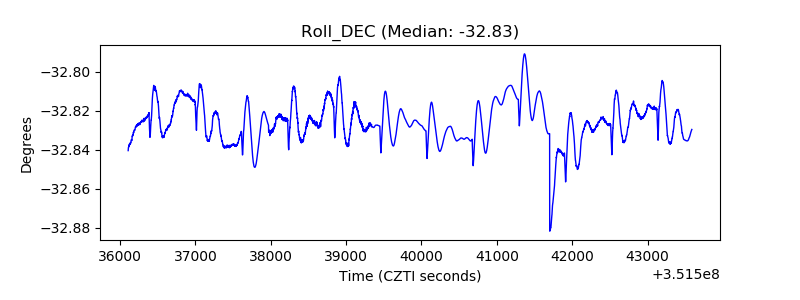 |
| _Roll_RA | 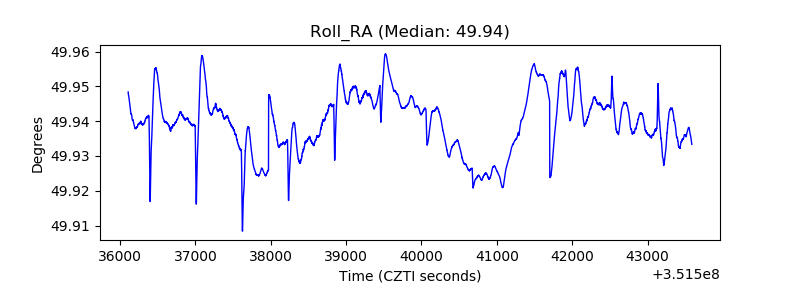 |
| Veto Counter | 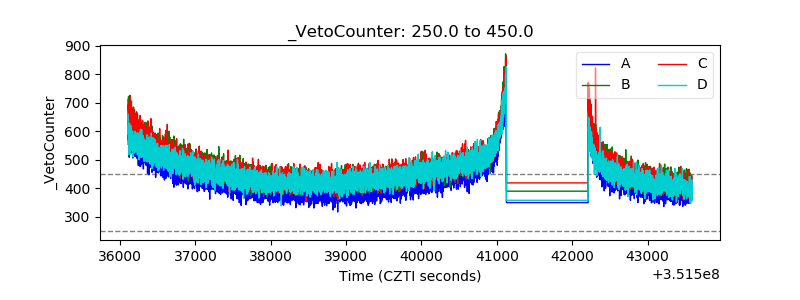 |