| Param | Original file | Final file |
|---|---|---|
| Filename | modeM0/AS1A10_053T19_9000004190_29199cztM0_level2.evt | modeM0/AS1A10_053T19_9000004190_29199cztM0_level2_quad_clean.evt |
| Size (bytes) | 78,528,960 | 15,808,320 |
| Size | 74.9 MB | 15.1 MB |
| Events in quadrant A | 358,076 | 106,950 |
| Events in quadrant B | 468,424 | 107,314 |
| Events in quadrant C | 574,010 | 103,994 |
| Events in quadrant D | 920,750 | 96,983 |
| Mode SS | |||
|---|---|---|---|
| Quadrant | BADHDUFLAG | Total packets | Discarded packets |
| A | 0 | 16 | 0 |
| B | 0 | 16 | 0 |
| C | 0 | 16 | 0 |
| D | 0 | 16 | 0 |
| Mode M0 | |||
|---|---|---|---|
| Quadrant | BADHDUFLAG | Total packets | Discarded packets |
| A | 0 | 1590 | 0 |
| B | 0 | 1902 | 0 |
| C | 0 | 2254 | 0 |
| D | 0 | 3291 | 0 |
| Quadrant | Total seconds | Saturated seconds | Saturation percentage |
|---|---|---|---|
| A | 793 | 1 | 0.126103% |
| B | 794 | 4 | 0.503778% |
| C | 794 | 3 | 0.377834% |
| D | 794 | 96 | 12.090680% |
Noise dominated data is calculated using 1-second bins in cleaned event files. If a bin has >2000 counts, and if more than 50% of those come from <1% of pixels, then it is considered to be noise-dominated and hence unusable.
| Quadrant | # 1 sec bins | Bins with >0 counts | Bins with >2000 counts | High rate bins dominated by noise | Noise dominated (total time) | Noise dominated (detector-on time) | Marked lightcurve |
|---|---|---|---|---|---|---|---|
| A | 793 | 793 | 0 | 0 | 0.00% | 0.00% | 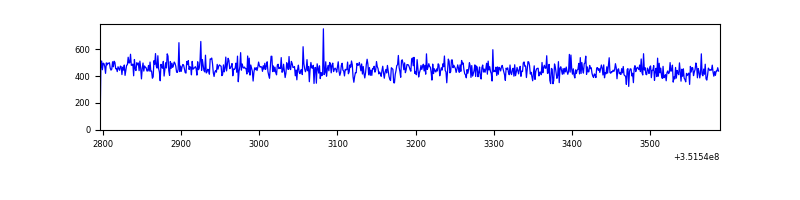 |
| B | 794 | 794 | 2 | 2 | 0.25% | 0.25% | 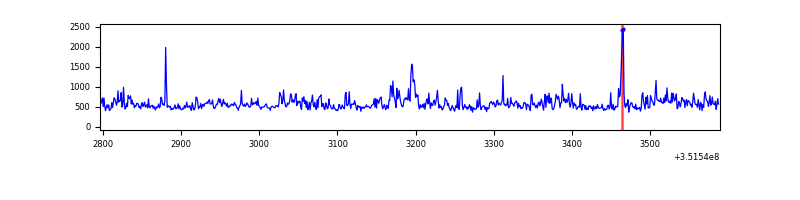 |
| C | 794 | 794 | 0 | 0 | 0.00% | 0.00% | 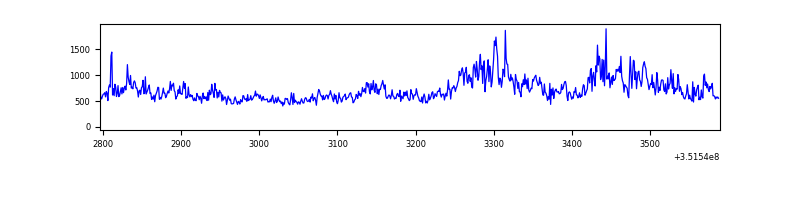 |
| D | 794 | 794 | 128 | 128 | 16.12% | 16.12% | 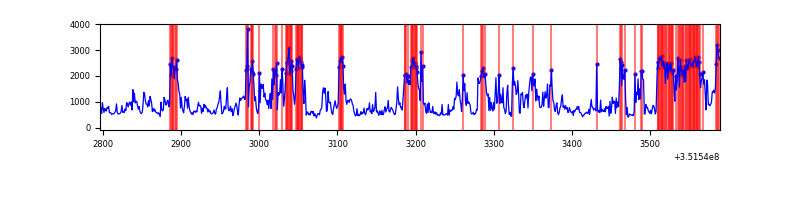 |
Top three noisy pixels from each quadrant. If the there are fewer than three noisy pixels in the level2.evt file, extra rows are filled as -1
| Pixel properties | Quadrant properties | ||||||
|---|---|---|---|---|---|---|---|
| Quadrant | DetID | PixID | Counts | Sigma | Mean | Median | Sigma |
| A | 13 | 254 | 1756 | 79.35 | 92 | 90 | 21.0 |
| A | 3 | 137 | 841 | 35.77 | 92 | 90 | 21.0 |
| A | 0 | 226 | 841 | 35.77 | 92 | 90 | 21.0 |
| B | 0 | 183 | 64825 | 3243.61 | 92 | 89 | 20.0 |
| B | 5 | 255 | 16931 | 843.85 | 92 | 89 | 20.0 |
| B | 10 | 245 | 9421 | 467.56 | 92 | 89 | 20.0 |
| C | 3 | 233 | 214424 | 9569.13 | 88 | 88 | 22.4 |
| C | 14 | 238 | 13932 | 618.07 | 88 | 88 | 22.4 |
| C | 2 | 114 | 1875 | 79.78 | 88 | 88 | 22.4 |
| D | 1 | 52 | 449814 | 20222.32 | 85 | 83 | 22.2 |
| D | 8 | 195 | 87383 | 3925.48 | 85 | 83 | 22.2 |
| D | 12 | 233 | 23804 | 1066.62 | 85 | 83 | 22.2 |
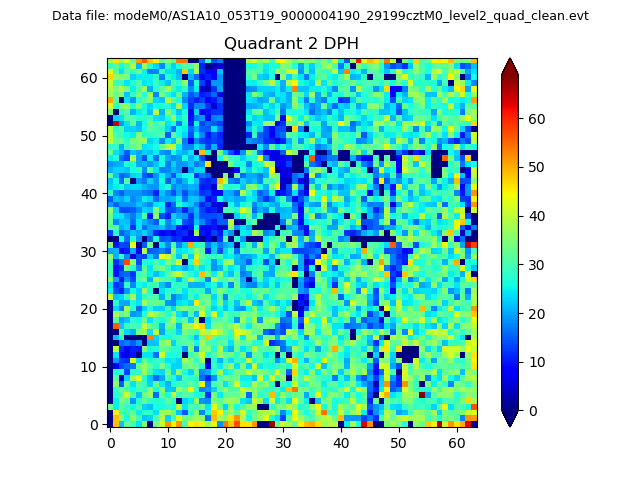
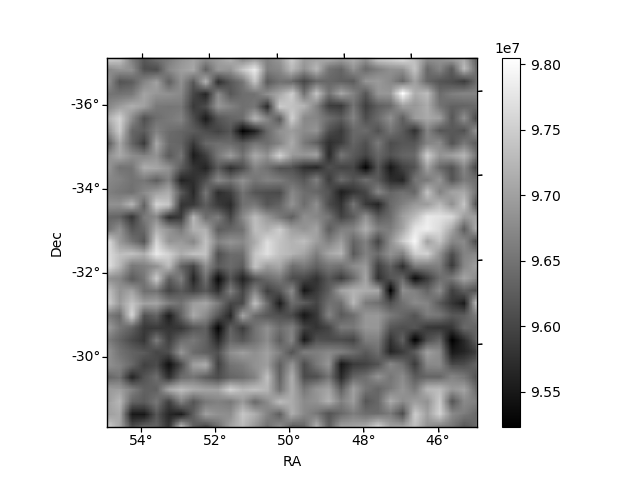
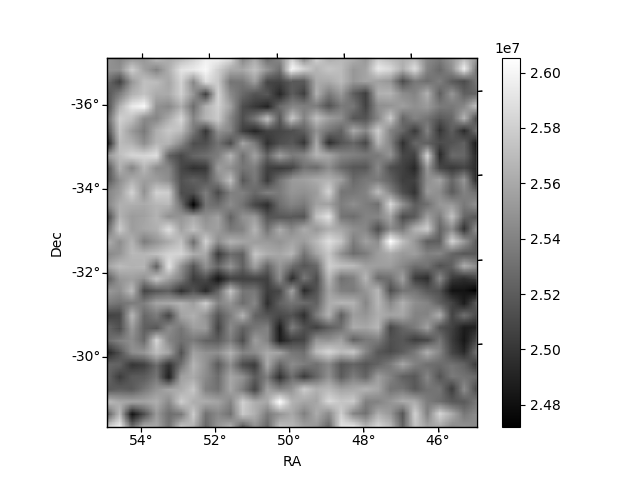
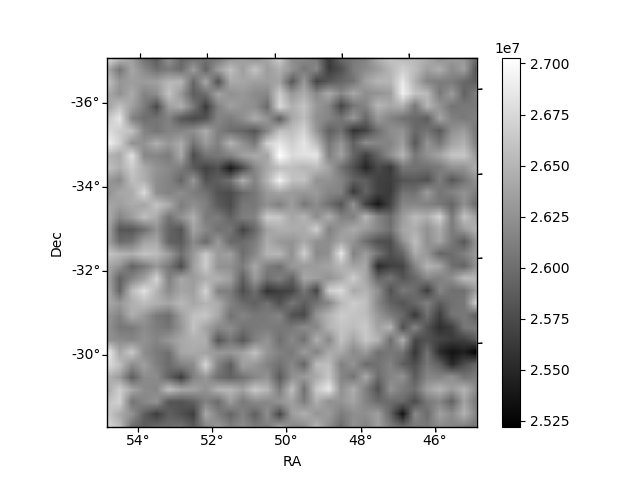
Histogram calculated using DETX and DETY for each event in the final _common_clean file
| Quadrant A | 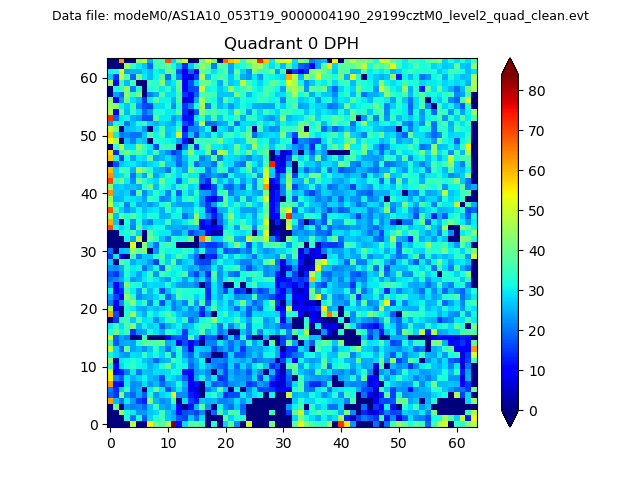 |
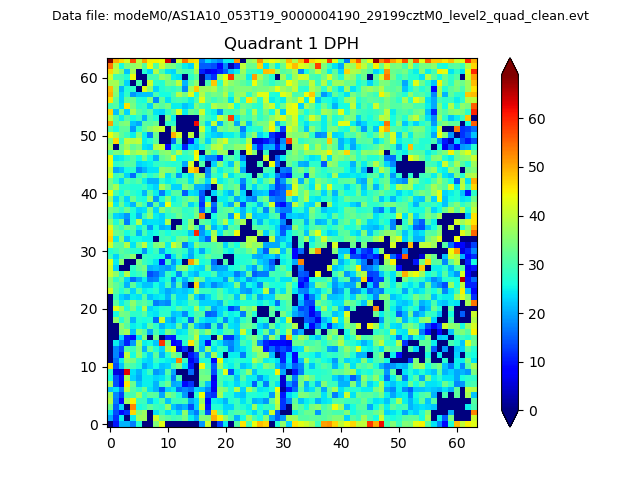 |
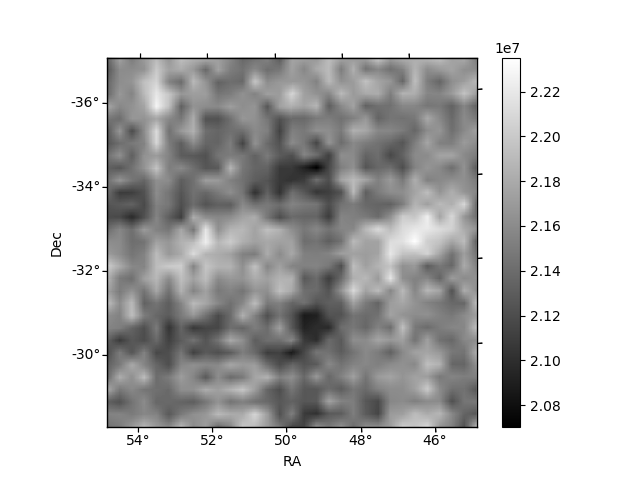
Quadrant B |
|---|---|---|---|
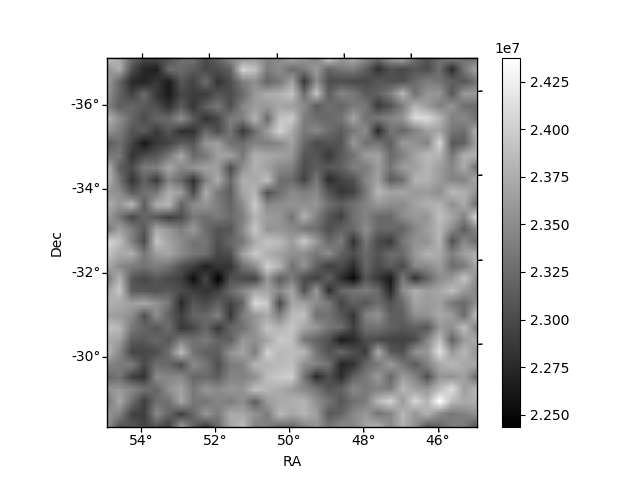
| Quadrant D | 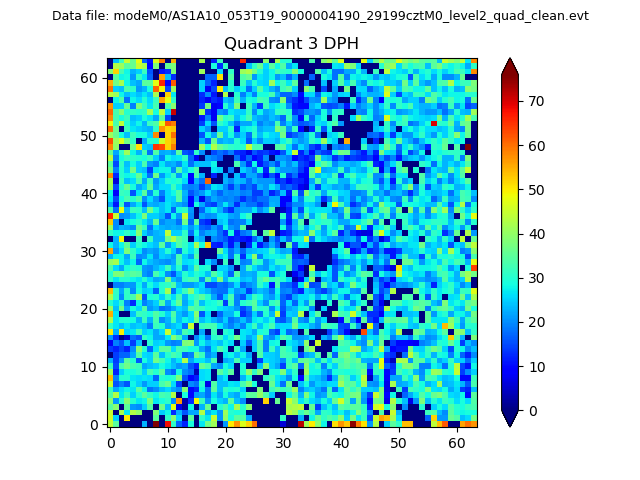 |
 |
Quadrant C |
| Plot type | Count rate plots | Images |
|---|---|---|
| Comparison with Poisson distribution Blue bars denote a histogram of data divided into 1 sec bins. Red curve is a Poisson curve with rate = median count rate of data. |
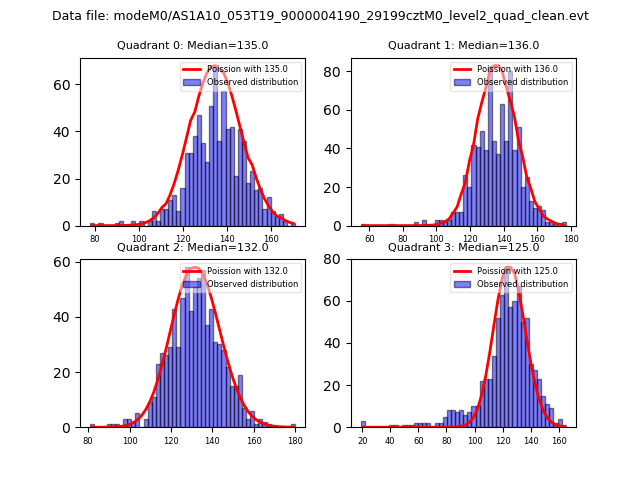 |
 |
| Quadrant-wise count rates Data is divided into 100 sec bins |
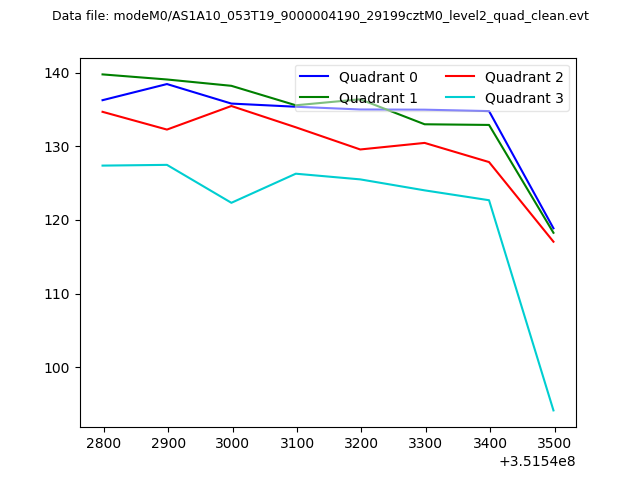 |
|
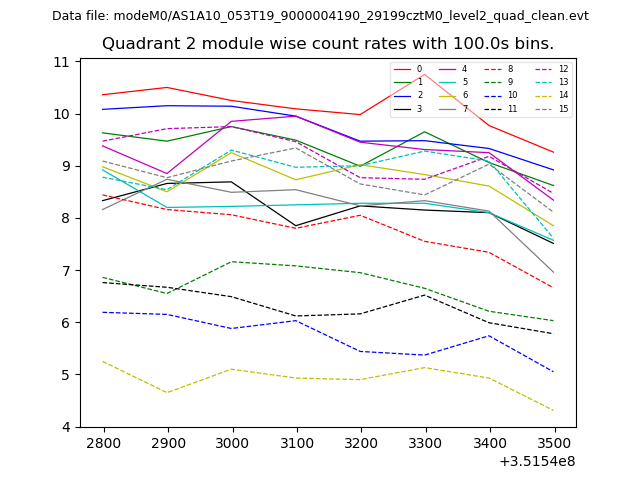
| Module-wise count rates for Quadrant A Data is divided into 100 sec bins |
 |
 |
| Module-wise count rates for Quadrant B Data is divided into 100 sec bins |
 |
 |
| Module-wise count rates for Quadrant C Data is divided into 100 sec bins |
 |
 |
| Module-wise count rates for Quadrant D Data is divided into 100 sec bins |
 |
 |
| Parameter | Plot |
|---|---|
| CZT HV Monitor | 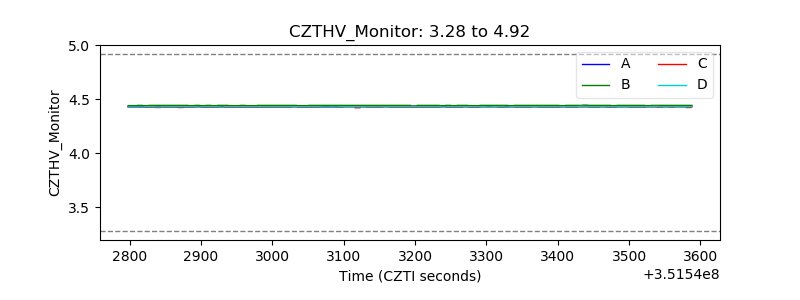 |
| D_VDD | 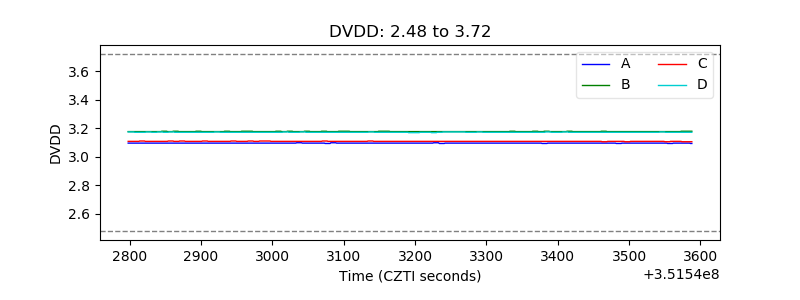 |
| Temperature 1 | 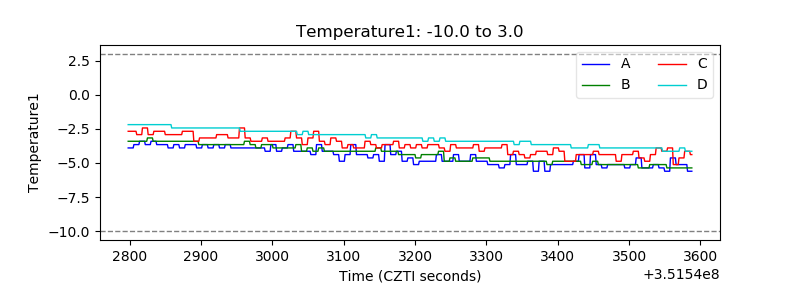 |
| Veto HV Monitor | 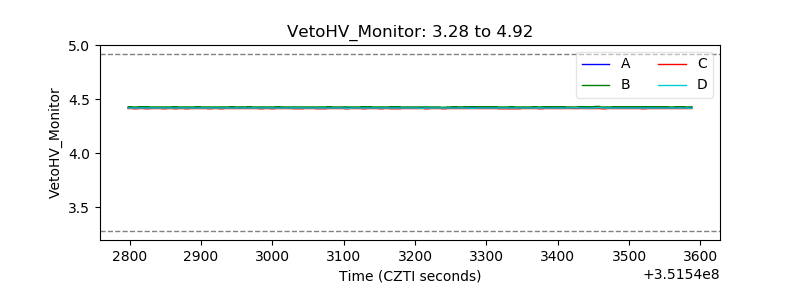 |
| Veto LLD | 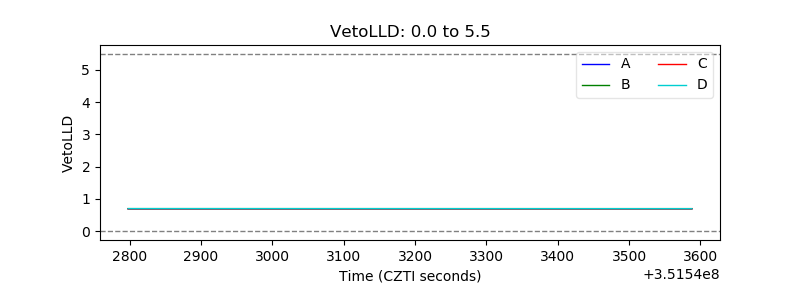 |
| Alpha Counter | 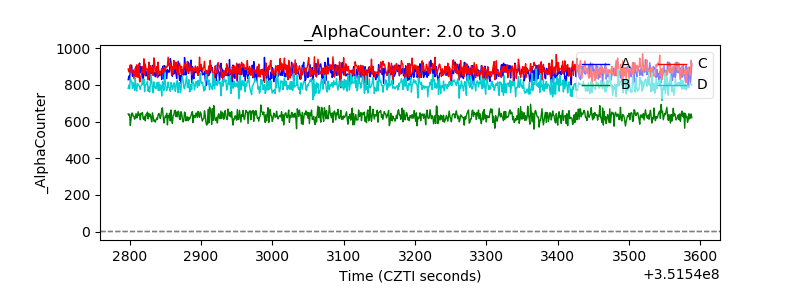 |
| _CPM_Rate | 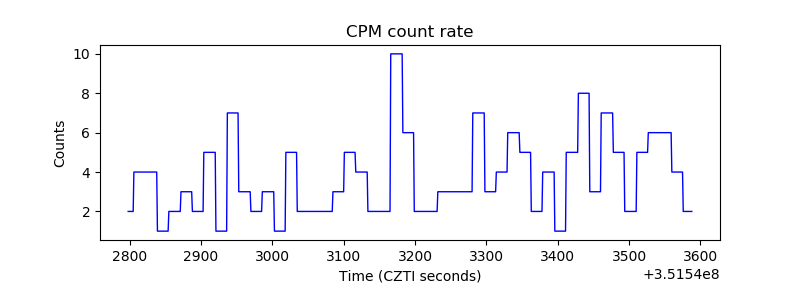 |
| CZT Counter | 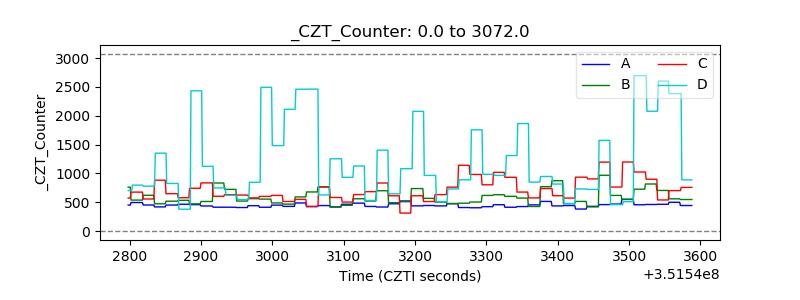 |
| +2.5 Volts monitor | 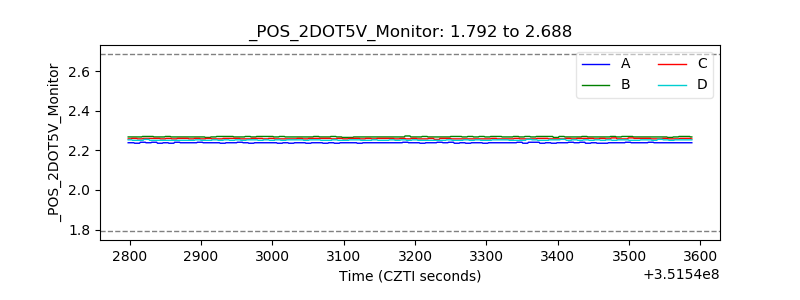 |
| +5 Volts monitor |  |
| _ROLL_ROT |  |
| _Roll_DEC |  |
| _Roll_RA | 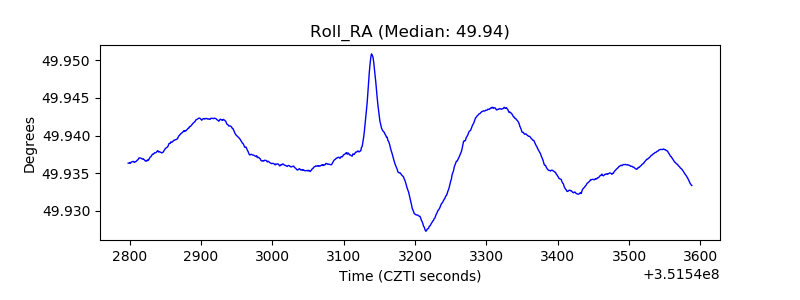 |
| Veto Counter | 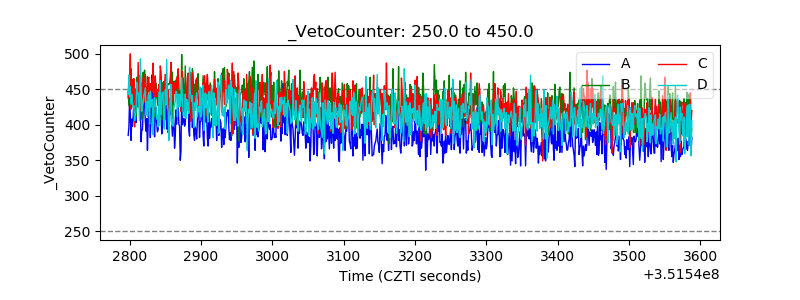 |