| Param | Original file | Final file |
|---|---|---|
| Filename | modeM0/AS1A10_053T34_9000004192cztM0_level2.fits | modeM0/AS1A10_053T34_9000004192cztM0_level2_quad_clean.evt |
| Size (bytes) | 301,962,240 | 274,029,120 |
| Size | 288.0 MB | 261.3 MB |
| Events in quadrant A | 1,898,762 | 1,730,484 |
| Events in quadrant B | 1,806,520 | 1,704,655 |
| Events in quadrant C | 1,678,704 | 1,297,567 |
| Events in quadrant D | 1,549,574 | 1,357,441 |
| Mode M9 | |||
|---|---|---|---|
| Quadrant | BADHDUFLAG | Total packets | Discarded packets |
| A | 0 | 21 | 0 |
| B | 0 | 21 | 0 |
| C | 0 | 21 | 0 |
| D | 0 | 21 | 0 |
| Mode SS | |||
|---|---|---|---|
| Quadrant | BADHDUFLAG | Total packets | Discarded packets |
| A | 0 | 654 | 0 |
| B | 0 | 654 | 0 |
| C | 0 | 654 | 0 |
| D | 0 | 654 | 0 |
| Mode M0 | |||
|---|---|---|---|
| Quadrant | BADHDUFLAG | Total packets | Discarded packets |
| A | 0 | 66205 | 0 |
| B | 0 | 72672 | 0 |
| C | 0 | 145368 | 0 |
| D | 0 | 111150 | 0 |
| Quadrant | Total seconds | Saturated seconds | Saturation percentage |
|---|---|---|---|
| A | 32113 | 251 | 0.781615% |
| B | 32113 | 555 | 1.728272% |
| C | 32113 | 6875 | 21.408775% |
| D | 32113 | 3070 | 9.559991% |
Noise dominated data is calculated using 1-second bins in cleaned event files. If a bin has >2000 counts, and if more than 50% of those come from <1% of pixels, then it is considered to be noise-dominated and hence unusable.
| Quadrant | # 1 sec bins | Bins with >0 counts | Bins with >2000 counts | High rate bins dominated by noise | Noise dominated (total time) | Noise dominated (detector-on time) | Marked lightcurve |
|---|---|---|---|---|---|---|---|
| A | 34238 | 32113 | 0 | 0 | 0.00% | 0.00% |  |
| B | 34238 | 32110 | 0 | 0 | 0.00% | 0.00% |  |
| C | 34238 | 32114 | 0 | 0 | 0.00% | 0.00% |  |
| D | 34237 | 32091 | 0 | 0 | 0.00% | 0.00% | 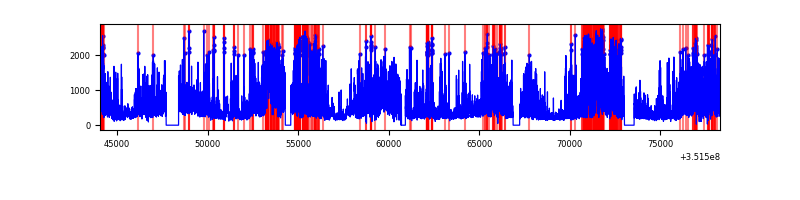 |
Top three noisy pixels from each quadrant. If the there are fewer than three noisy pixels in the level2.evt file, extra rows are filled as -1
| Pixel properties | Quadrant properties | ||||||
|---|---|---|---|---|---|---|---|
| Quadrant | DetID | PixID | Counts | Sigma | Mean | Median | Sigma |
| A | 0 | 29 | 1593 | 9.06 | 494 | 463 | 124.7 |
| A | 7 | 110 | 1479 | 8.15 | 494 | 463 | 124.7 |
| A | 9 | 19 | 1431 | 7.76 | 494 | 463 | 124.7 |
| B | 2 | 9 | 1474 | 10.46 | 478 | 453 | 97.6 |
| B | 2 | 8 | 1232 | 7.98 | 478 | 453 | 97.6 |
| B | 5 | 225 | 1196 | 7.62 | 478 | 453 | 97.6 |
| C | 9 | 209 | 1185 | 6.79 | 443 | 415 | 113.3 |
| C | 12 | 241 | 1157 | 6.55 | 443 | 415 | 113.3 |
| C | 12 | 249 | 1101 | 6.05 | 443 | 415 | 113.3 |
| D | 15 | 46 | 1153 | 6.27 | 442 | 402 | 119.7 |
| D | 10 | 189 | 1140 | 6.16 | 442 | 402 | 119.7 |
| D | 3 | 14 | 1119 | 5.99 | 442 | 402 | 119.7 |
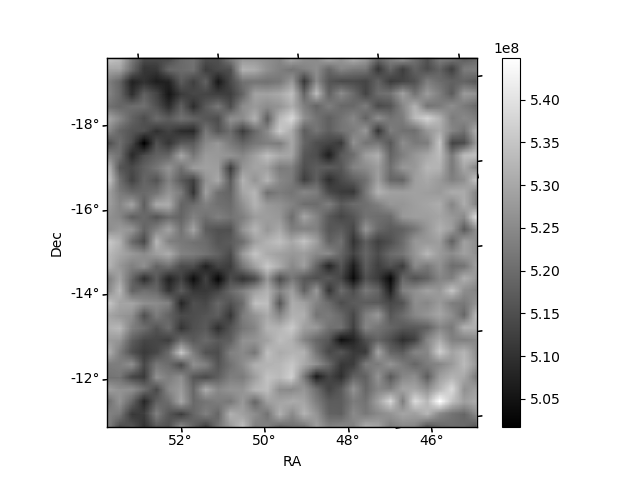
Histogram calculated using DETX and DETY for each event in the final _common_clean file
| Quadrant A | 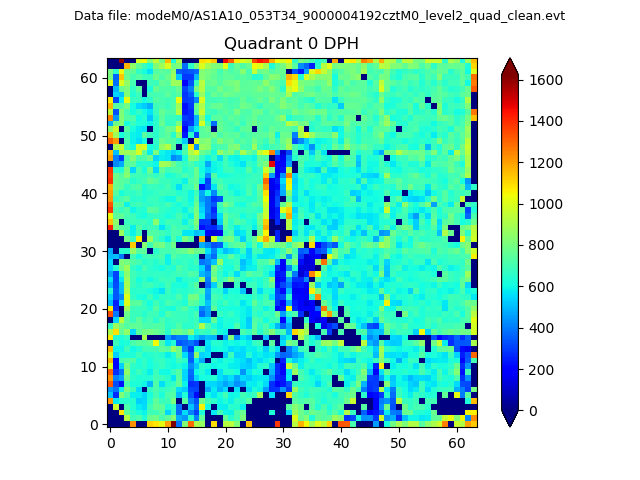 |
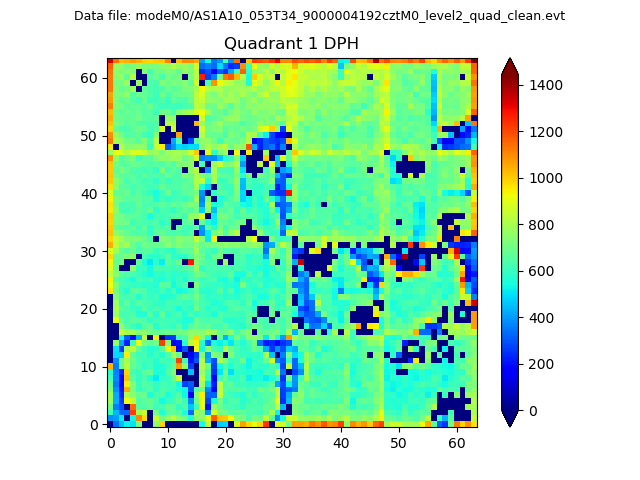 |
Quadrant B |
|---|---|---|---|
| Quadrant D | 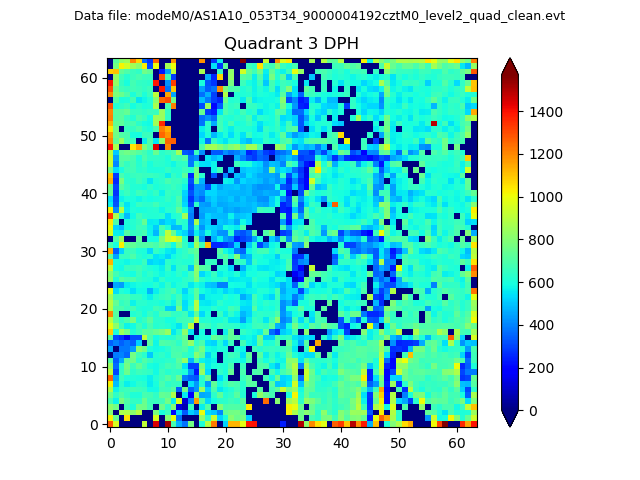 |
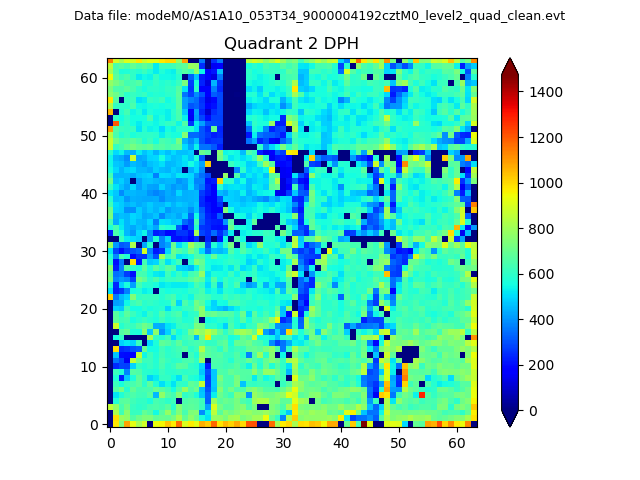 |
Quadrant C |
| Plot type | Count rate plots | Images |
|---|---|---|
| Comparison with Poisson distribution Blue bars denote a histogram of data divided into 1 sec bins. Red curve is a Poisson curve with rate = median count rate of data. |
 |
 |
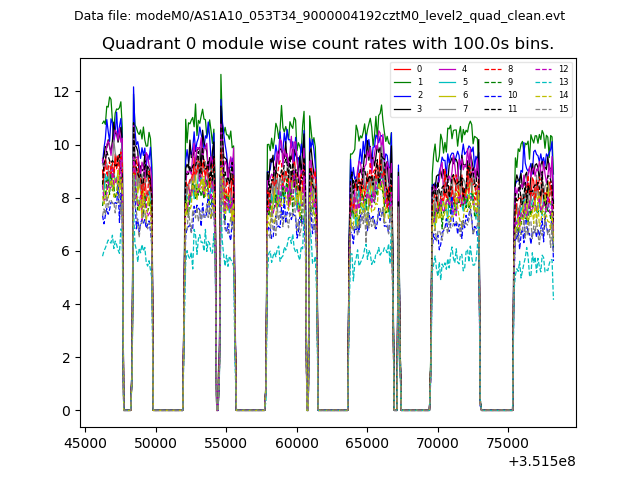
| Quadrant-wise count rates Data is divided into 100 sec bins |
 |
|
| Module-wise count rates for Quadrant A Data is divided into 100 sec bins |
 |
 |
| Module-wise count rates for Quadrant B Data is divided into 100 sec bins |
 |
 |
| Module-wise count rates for Quadrant C Data is divided into 100 sec bins |
 |
 |
| Module-wise count rates for Quadrant D Data is divided into 100 sec bins |
 |
 |
| Parameter | Plot |
|---|---|
| CZT HV Monitor |  |
| D_VDD | 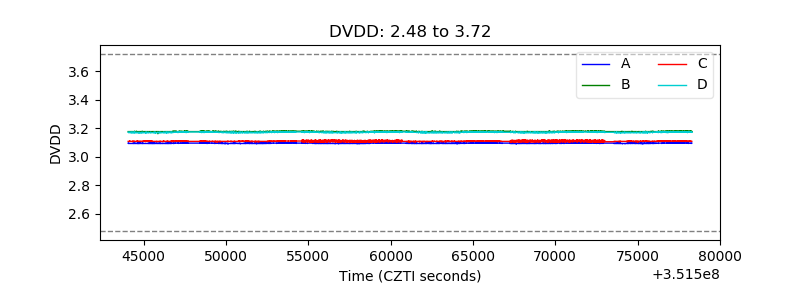 |
| Temperature 1 |  |
| Veto HV Monitor | 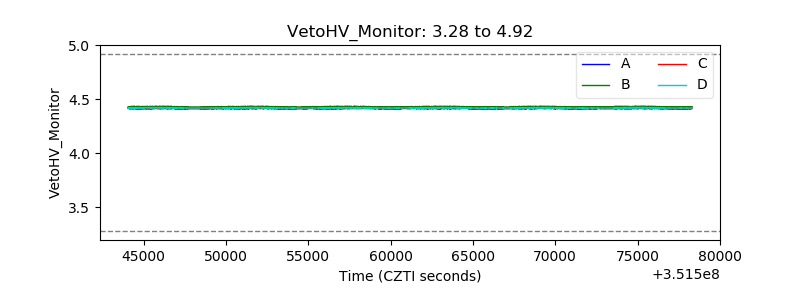 |
| Veto LLD | 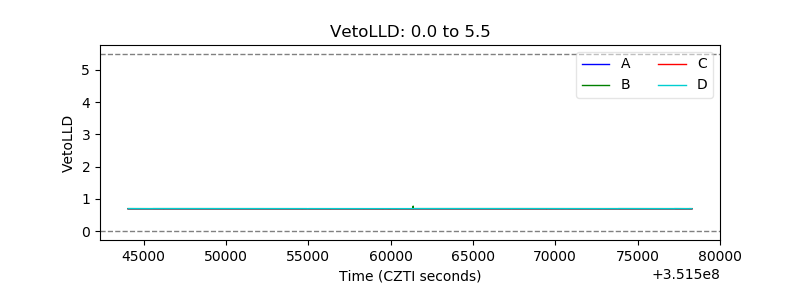 |
| Alpha Counter |  |
| _CPM_Rate | 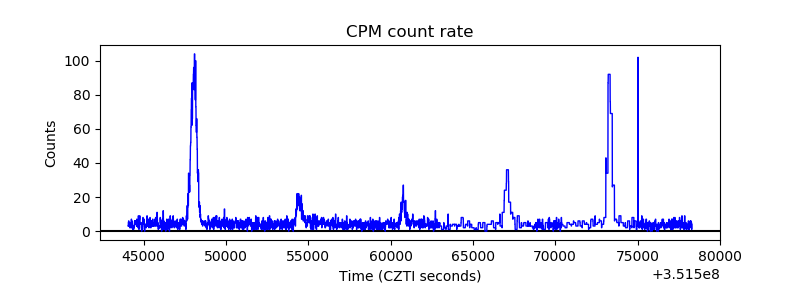 |
| CZT Counter |  |
| +2.5 Volts monitor |  |
| +5 Volts monitor |  |
| _ROLL_ROT |  |
| _Roll_DEC |  |
| _Roll_RA |  |
| Veto Counter | 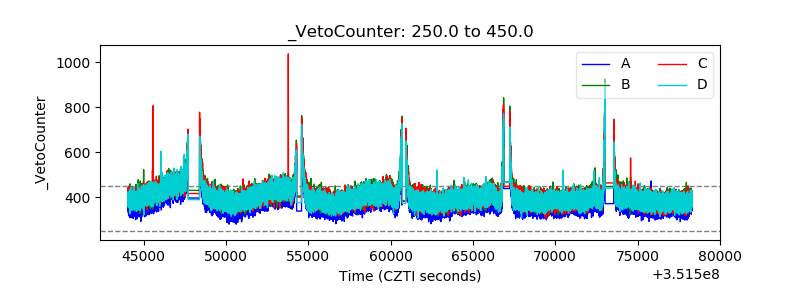 |